Leading Vs Lagging Indicators: Differences, Examples, Uses, Which is Better?

 Author

 Editor
Leading and lagging indicators are two broader categories of indicators used by traders to analyze the market and to make informed trading decisions. Leading and lagging indicators help traders to understand market momentum, trend direction, reversals, and overall market behavior in different market conditions.
Both types of indicators are used in technical analysis, but their effectiveness totally depends on their way of use. Hence it is important to know the difference between them to choose the right indicator for better market analysis and trade execution.
What are leading indicators
Leading indicators are mathematical tools that aim to predict future price movements before they actually happen. Leading indicators give early hints about where the market or a stock might go next. Some commonly used leading indicators are the stochastic oscillator, RSI, and volume.
What are Lagging Indicators?
Lagging indicators are mathematical tools that confirm the trend after they have already started. Lagging indicators don’t give early hints; instead, they give validation. Some commonly used lagging indicators are moving averages, MACD, and Bollinger Bands.
5 Key Differences Between Leading vs Lagging Indicators
There are many differences between leading and lagging indicators but 5 major key differences are discussed below.
| Parameter | Leading Indicators | Lagging Indicators |
|---|---|---|
| Primary Purpose | Predict potential future price movements and provide early reversal signals. | Confirm an existing trend and validate market direction. |
| Signal Timing | Generate signals before a trend is fully established. | Generate signals after a trend has already started. |
| Risk Profile | Higher risk due to false signals and whipsaws. | Lower risk because signals are more confirmed and reliable. |
| Best Market Condition | Works best in sideways or range-bound markets. | Works best in strong trending markets. |
| Example Signals | Divergence, overbought/oversold conditions, momentum shifts. | Moving average crossovers, trend breakouts, confirmation signals. |
| Common Misuse | Using them in strong trends can create repeated false reversal signals. | Using them in sideways markets may lead to late entries and missed opportunities. |
| Typical Users | Scalpers, aggressive traders, and short-term traders seeking early entries. | Swing traders, trend followers, and investors seeking confirmation. |
| Analogy | Like a weather forecast predicting rain before it happens. | Like a wet road confirming it already rained. |
1.Signal Timing
Signal timing is the most fundamental distinction between leading indicator and lagging indicator. Leading indicators give signals before the market forms any trend or reversal on chart, whereas lagging indicators provide signals after the market has already moved.
Since leading indicators try to predict future prices and give you signals before market moves, it is more prone to fake signals or uncertainty. Whereas a lagging indicator will give you a late signal, but the probability of trading in the correct direction increases.
2.Primary Purpose
The primary purpose of a leading indicator is to forecast possible market reversals, momentum shifts, or trend changes, whereas the primary purpose of lagging indicators is to confirm and validate the market trend and momentum that has already occurred.
RSI, stochastic oscillator, or pivot points are few commonly used leading indicators that help find overbought and oversold zones and possible market reversals. Whereas, moving averages, MACD, and supertrend are few examples of lagging indicators that move after market to validate the market move.
3.Reliability and Risk
The reliability of the leading indicator is comparatively lesser than the reliability of the lagging indicator, because the leading indicator provides a signal for future price move, which has not occurred yet. This increases the chance of false breakouts and whipsaws, especially in volatile markets.
Whereas, a lagging indicator validates and confirms the market move which has already occurred in the market. Hence, this confirmed signal from lagging indicators reduces the number of false trades and improves confidence in trend direction.
4.Best Market Conditions
Leading and lagging indicators perform best in different market conditions due to their distinct features. The leading indicator is suitable for the range-bound or sideways market where price keeps reversing from support and resistance. In such conditions, overbought and oversold zones become more relevant to capture reversals.
Lagging Indicators on the other hand, performs best in the trending market. In a strong trending market (uptrend or downtrend), confirmation based indicator helps traders to stay within the trend and avoid exiting too early due to temporary pullbacks.
5.Ideal for What Strategy
Leading indicators are mostly used for aggressive forms of trading like scalping, intraday or short-term swing trading. Such short-term trading strategy requires quick momentum and reversals identification, where leading indicators clearly serve the purpose.
Whereas, lagging indicators are suitable for swing trading, positional trading and trend trading. Such strategies require confirmation and trend continuation instead of early entry signals. Hence, a lagging indicator is often preferred by investors for confirmed and clear entries.
Best Technical Analysis Software with Leading and Lagging Indicators
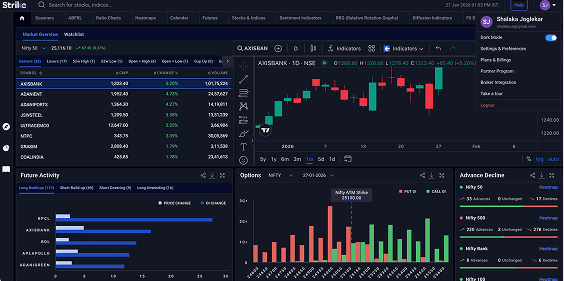
There are several technical analysis software available in the market which provide access to all the leading and lagging indicators. Platforms like Strike Money, Tradingview, Investopedia, chartink, and brokers with integrated Tradingview are few known softwares.
However, these platforms only provide traditional leading and lagging indicators like MACD, RSI, moving averages ,etc. Strike Money on the other hand provides custom build leading and lagging indicators along with traditional ones.
There are five major indicators available on strike that will help you to get additional insights in the market.
- Diffusion Indicator: Diffusion indicator gives signal by measuring the percentage of stocks participating in the move based on selected condition, like what percent of stocks giving MACD bullish cross, or what percentage of stocks has RSI above 60, etc. Depending on the percentage, it suggests whether the trend is going to reverse or continue.
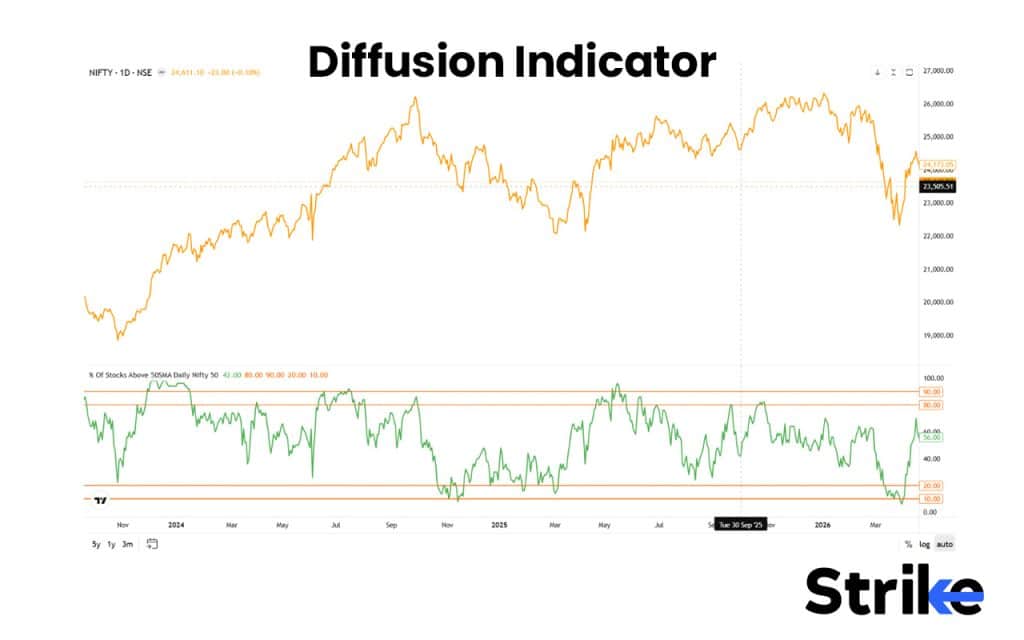
In the above example, it shows what percentage of stocks in Nifty 50 is above 50-SMA. If it’s between 20% and 30%, the indicator signals an oversold market and a potential reversal to upside, conversely, if the percentage is between 80-90%, it signals an overbought market and a potential reversal to downside.
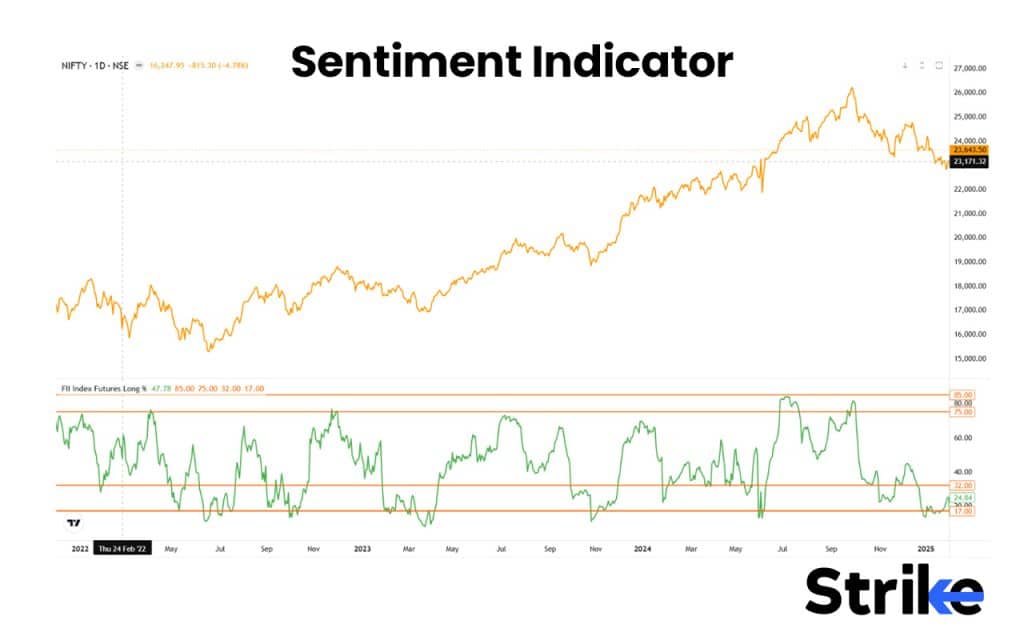
- Sentiment Indicator: This indicator tells about the current market sentiment based on institutional participants. For instance, if a large percentage of institutions like FII or DII are continuously buying, the sentiment indicator suggests bullish sentiment.
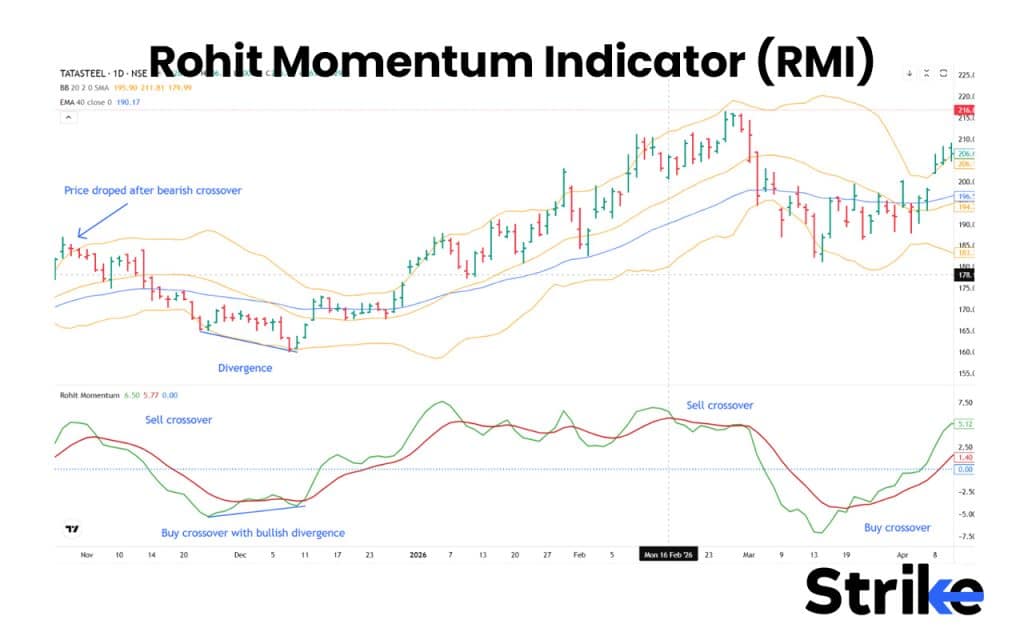
- Rohit Momentum Indicator (RMI): It is a momentum indicator that gives buy and sell signals. It is similar to MACD, but gives a fast and smooth signal.
- Relative Rotation Graph (RRG): It is a visual market analysis tool that measures the strength and momentum of stock, sectors, and index with the benchmark index Nifty 50 and plots the values in four quadrants, a leading quadrant, lagging quadrant, improving quadrant, and weakening quadrant.
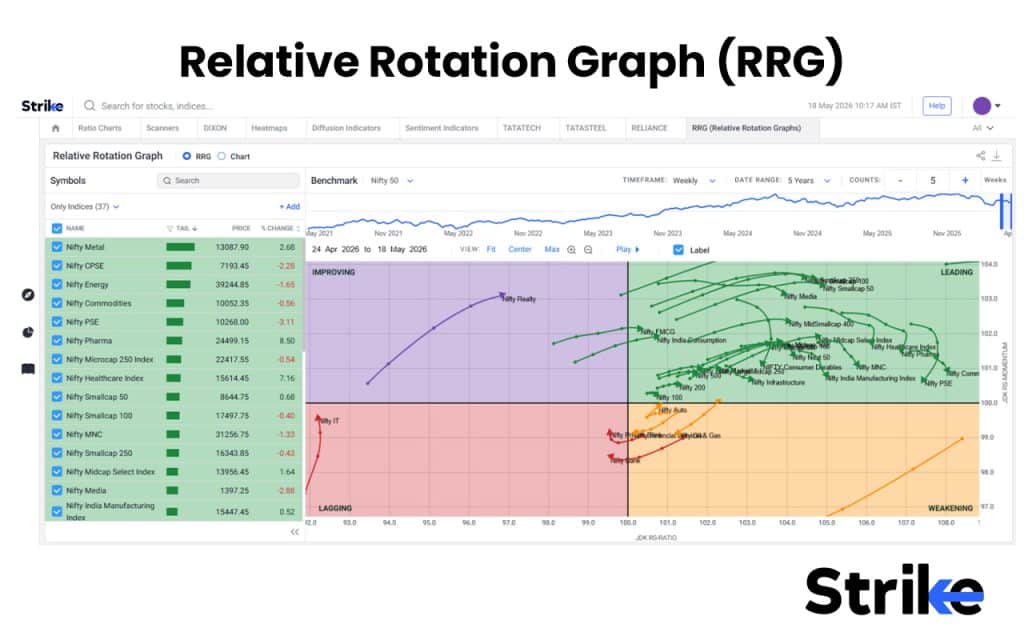
This helps identify which stocks, sector, or index is leading and which one is lagging, also what will be their next probable move.
- Strike OI Insights: This tool works on open interest data and tells you the key support and resistance levels based on strike with strong OI. This level can be monitored for breakout trading, if broken with high OI change.
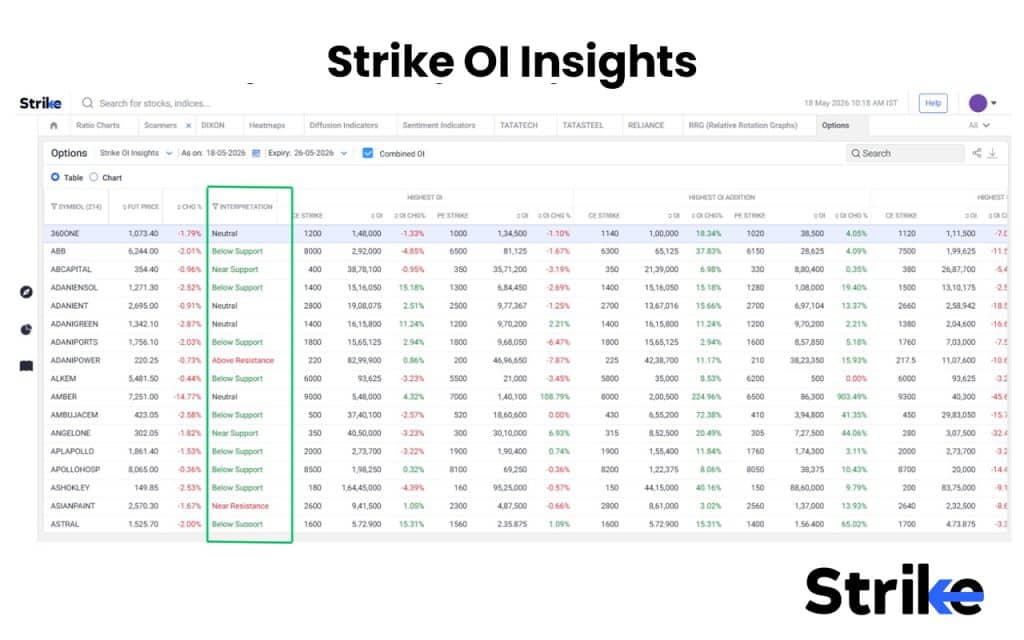
These additional indicators help traders analyze market participation, momentum, sentiment, sector rotation, and open interest activity more deeply, giving better insights beyond traditional technical indicators for improved trading decisions.
Examples of Leading Indicators
| Indicator | Why They Are Leading | Reliability |
|---|---|---|
| RSI | Shows overbought and oversold conditions before reversals. | High |
| Stochastic Oscillator | Detects momentum shifts before trend changes. | Moderate |
| MACD Histogram | Signals momentum weakening early. | High |
| Bollinger Bands | Identifies volatility-based reversal zones. | Moderate |
| Williams %R | Spots extreme buying or selling pressure early. | Moderate |
| CCI | Detects early momentum deviations. | Moderate to High |
| Momentum Indicator | Measures price acceleration before reversals. | Moderate |
| OBV | Shows volume accumulation before price movement. | High |
| ROC | Identifies changes in price momentum speed. | Moderate |
| Advance-Decline Line | Reveals market strength before the index moves. | High |
Examples of Lagging Indicators
| Indicator | Why They Are Lagging | Reliability |
|---|---|---|
| Moving Averages | Based on past price data to confirm trends. | High |
| MACD Line | Uses moving averages to confirm momentum changes. | High |
| Average Directional Index (ADX) | Confirms trend strength after trend starts. | High |
| Bollinger Bands Middle Line | Uses average price to confirm direction. | Moderate |
| Supertrend | Follows price trend after breakout confirmation. | High |
| Ichimoku Cloud | Confirms trend direction using historical averages. | High |
| Parabolic SAR | Gives signals after price movement develops. | Moderate |
| Volume Moving Average | Confirms volume trend using past data. | Moderate |
| VWAP | Tracks average traded price during the session. | High |
| Trendlines | Confirm trend continuation after price reaction. | Moderate |
Pros & Cons of Leading Indicators
The pros and cons of leading indicators are briefly discussed below in the table.
| Pros of Leading Indicators | Cons of Leading Indicators |
|---|---|
| Provide early entry and exit signals. | Can generate frequent false signals. |
| Help traders identify reversals before they happen. | Less reliable in strong trending markets. |
| Offer better risk-reward opportunities due to early entries. | High chances of whipsaws in volatile conditions. |
| Work effectively in sideways and range-bound markets. | May trigger premature buy or sell signals. |
| Useful for scalping and short-term trading strategies. | Require additional confirmation for better accuracy. |
| Help detect momentum shifts quickly. | Overbought or oversold signals can remain for long periods in trends. |
| Allow traders to prepare before major market moves. | Can increase trading frequency and emotional decisions. |
| Useful for spotting divergence and weakening momentum. | Higher risk compared to lagging indicators. |
Although the leading indicator provides an early signal, it is important to confirm the signal with price action to filter false signals and improve consistency.
Pros & Cons of Lagging Indicators
The pros and cons of lagging indicators are briefly discussed below in the table.
| Pros of Lagging Indicators | Cons of Lagging Indicators |
|---|---|
| Provide more reliable and confirmed signals. | Signals are delayed because they react after the move begins. |
| Help traders trade in the direction of the trend. | May miss the early part of a trend. |
| Reduce false signals compared to leading indicators. | Can give late entries and exits. |
| Work very well in strong trending markets. | Perform poorly in sideways or choppy markets. |
| Help traders stay in trends for longer periods. | Frequent crossovers in range-bound markets can create whipsaws. |
| Easy to understand and widely used by traders. | Depend heavily on past price data. |
| Useful for swing trading and trend-following strategies. | Not suitable for catching reversals early. |
| Improve confidence through trend confirmation. | Profit potential may reduce due to delayed confirmation. |
Although lagging indicators are slow, their ability to confirm market trends and reduce the false signals and make them highly reliable for traders, especially trend traders.
How to Use Leading Indicators?
Leading indicators are used to predict the upcoming price movement in order to plan trade before market moves.
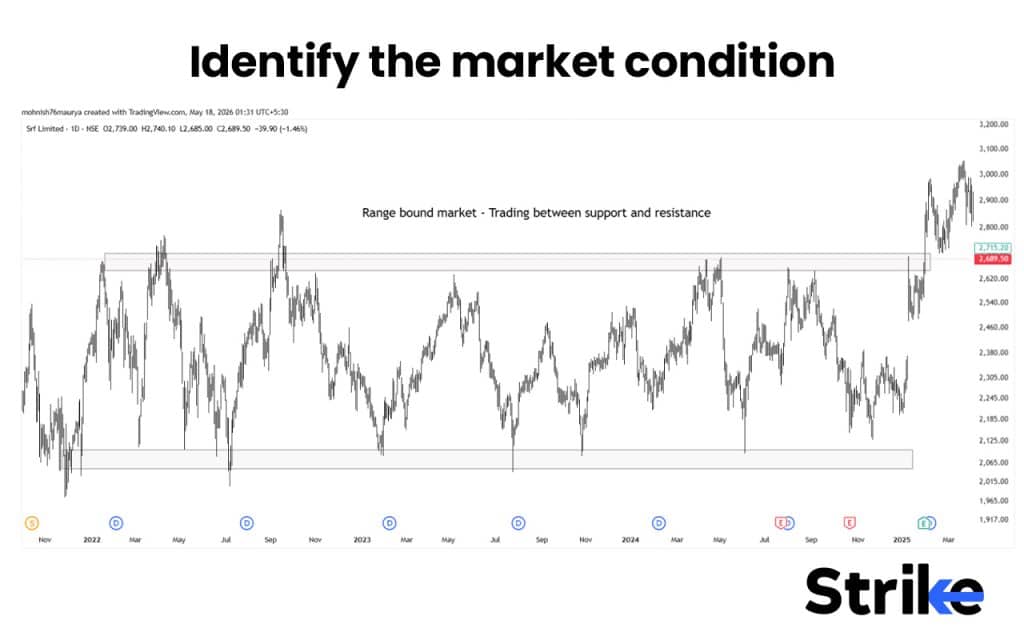
- Identify the market condition: As we have discussed earlier, that leading indicator works best in a range bound market by providing reversal zones. Before entering the trade it’s important to identify a sideways market where price is trading between support and resistance.
- Select the right leading indicator: The application of the leading indicator differs among different strategies. Some commonly used leading indicators are RSI to identify overbought and oversold zones, Commodity Channel Index to measure deviation from average price, and Stochastic Oscillator to detect momentum reversals.
- Look for trend reversal: The most common way to identify trend reversal is using RSI overbought/oversold condition and RSI divergence. RSI above 70 indicates overbought condition and a possible pullback. While RSI below 30 indicates oversold condition and a possible bounce.
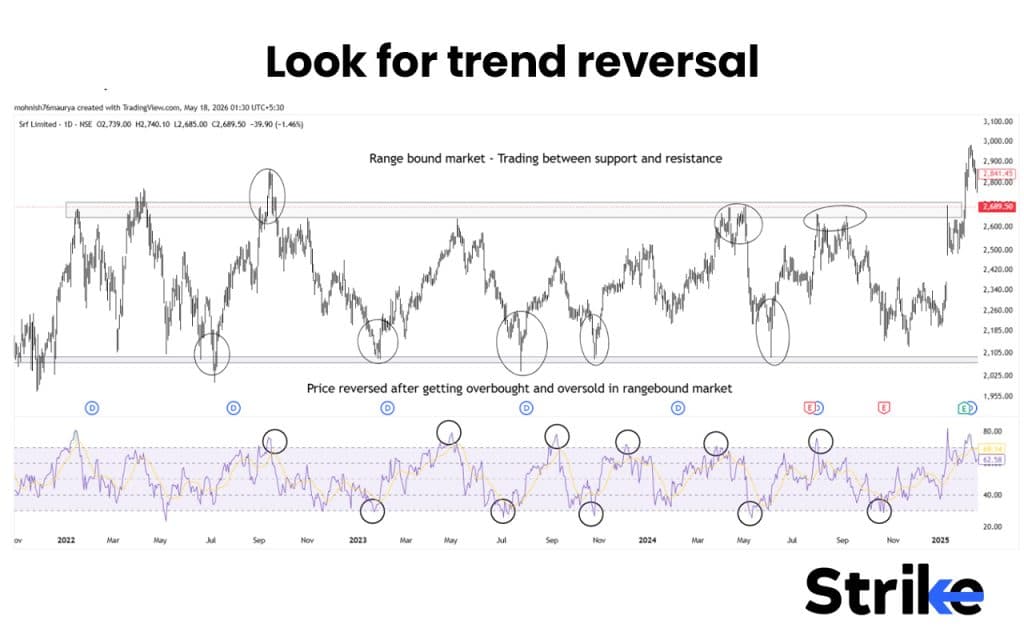
You can also use divergence to catch the reversal. When the price and RSI indicator moves in opposite directions to signal reversals.
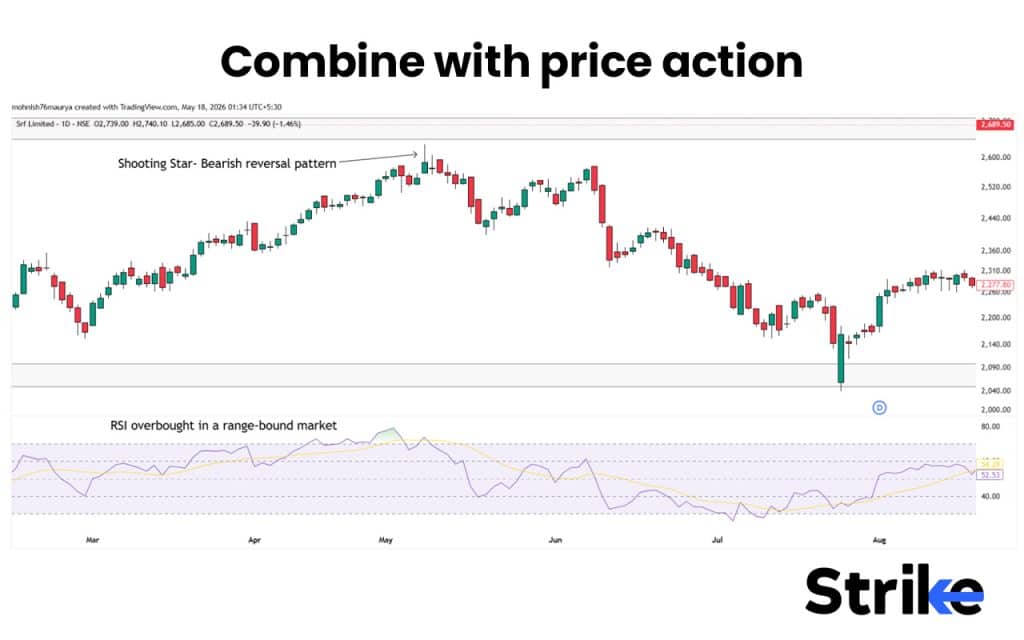
- Combine with price action: Combine the indicator signals with price action context to increase the significance. Traders usually combine them with candle patterns, chart patterns, support/resistance, trendline, etc.
- Execute the trade with proper risk management: Since leading indicators can give loss through false signals, it is very important to keep stoploss. For long trade put your stoploss below swing low and for short trade put your stoploss below swing high.
It is important to use price action along with leading indicators to avoid the false signals and improve trade accuracy.
How to Use Lagging Indicators?
Lagging indicators are used to confirm and validate the market movement which has already happened. This helps traders to align their trades with a confirmed market direction.
- Identify the market condition: Lagging indicator works best in trending markets, as it confirms ongoing momentum rather than predicting reversals. Before entering the trade it’s important to identify a trending market using lagging indicators like moving averages, MACD, ADX, supertrend,etc.
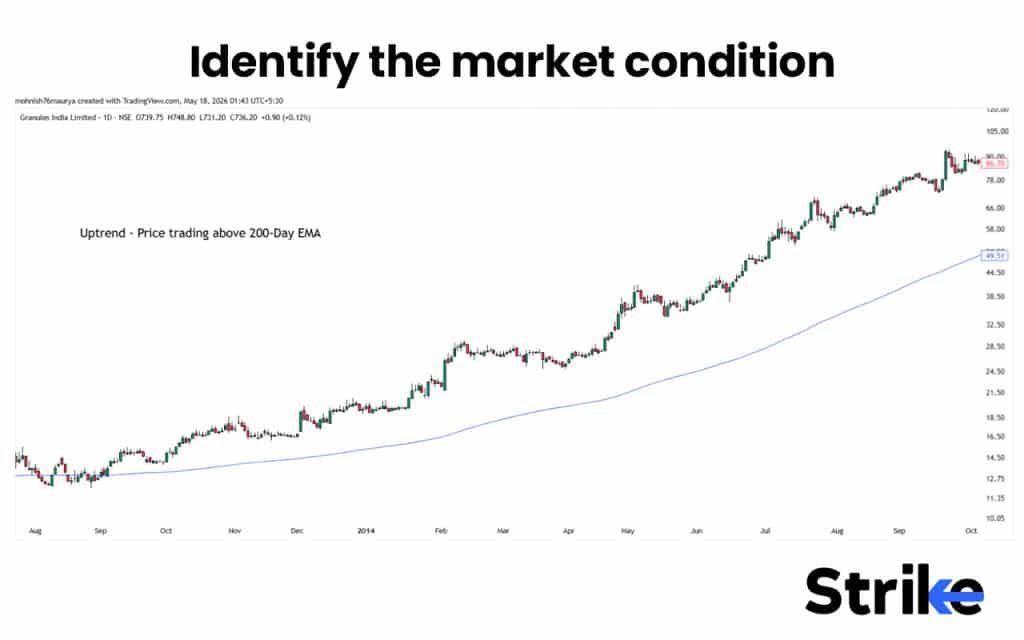
- Select the right lagging indicator: There are different lagging indicators designed to confirm the market trend and momentum. Some commonly used lagging indicators are moving average to identify trend of the market, MACD to measure momentum, ADX to measure trend strength.
- Look for pullback entries: In a trending market, look to enter in the direction of trend after a temporary pullback. In an uptrend look for buying after pullback, while in during down trend, look for selling after pullback.
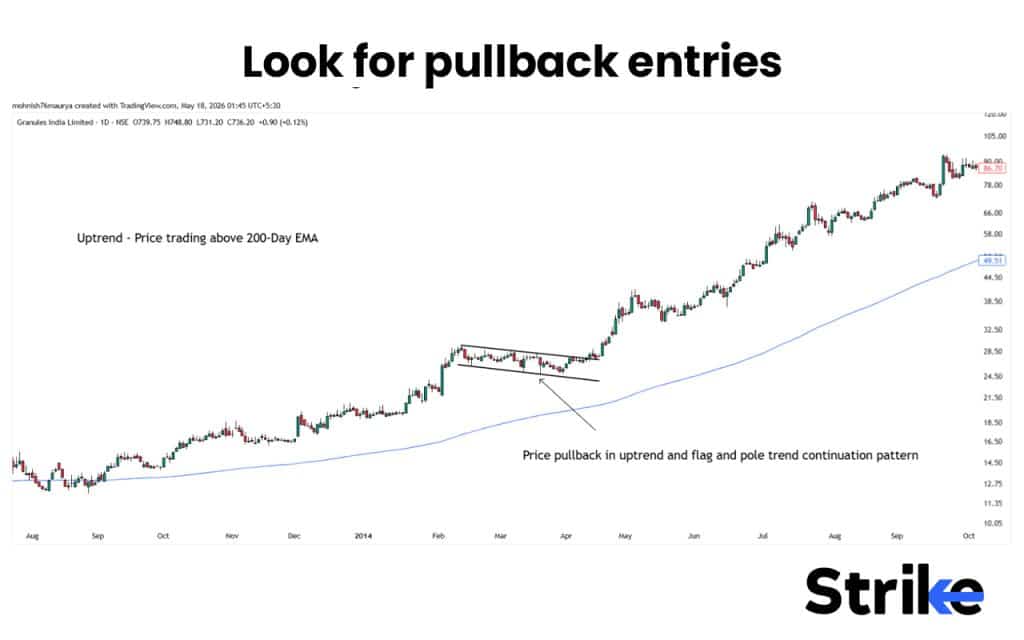
- Combine with price action: Combine the indicator signals with price action context to increase the significance. Traders usually combine them with candle patterns, chart patterns, support/resistance, trendline, etc.
- Execute the trade with proper risk management: Although the lagging indicator provides confirmed signal, no indicator is full proof. Always use stoploss and proper position sizing to avoid losses.
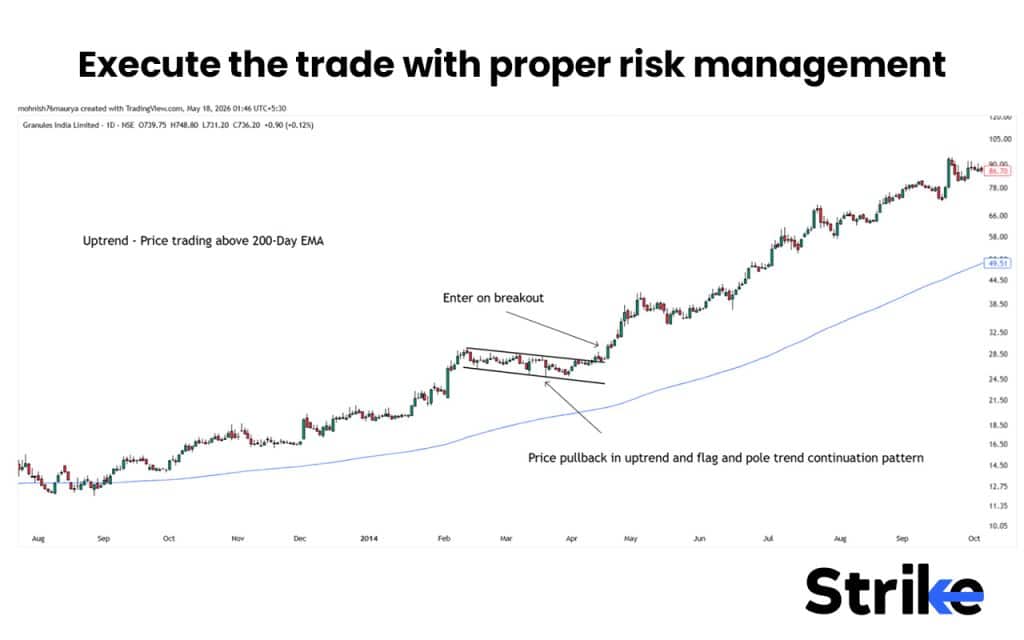
Hence, the real strength of lagging indicators is to validate the market condition which protects traders from taking unnecessary trades against market momentum.
How Does the Confluence of a Leading and Lagging Indicator Works?
The confluence of leading and lagging indicators works by combining the signals of both the indicators to generate high probability setups. In this confluence, the leading indicator helps to predict the upcoming price movement, whereas lagging indicators are used to confirm the move.
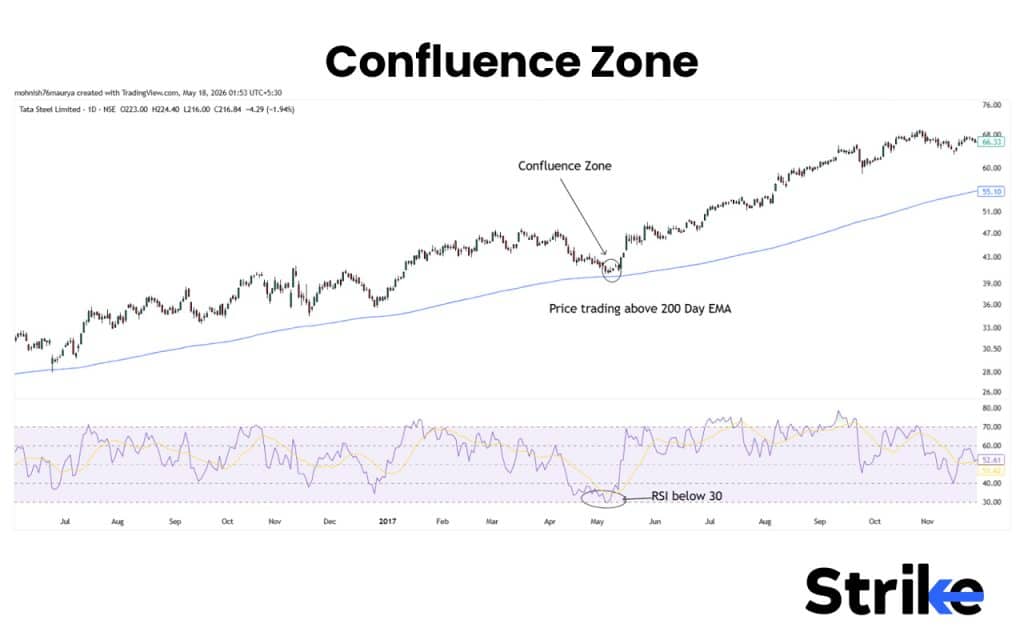
Let’s understand how confluence works in trading using RSI and moving average.
- Leading Indicator: It suggests the possible upcoming moves such as reversal or breakout. If RSI drops below 30, it indicates oversold condition and a potential upcoming bullish reversal.
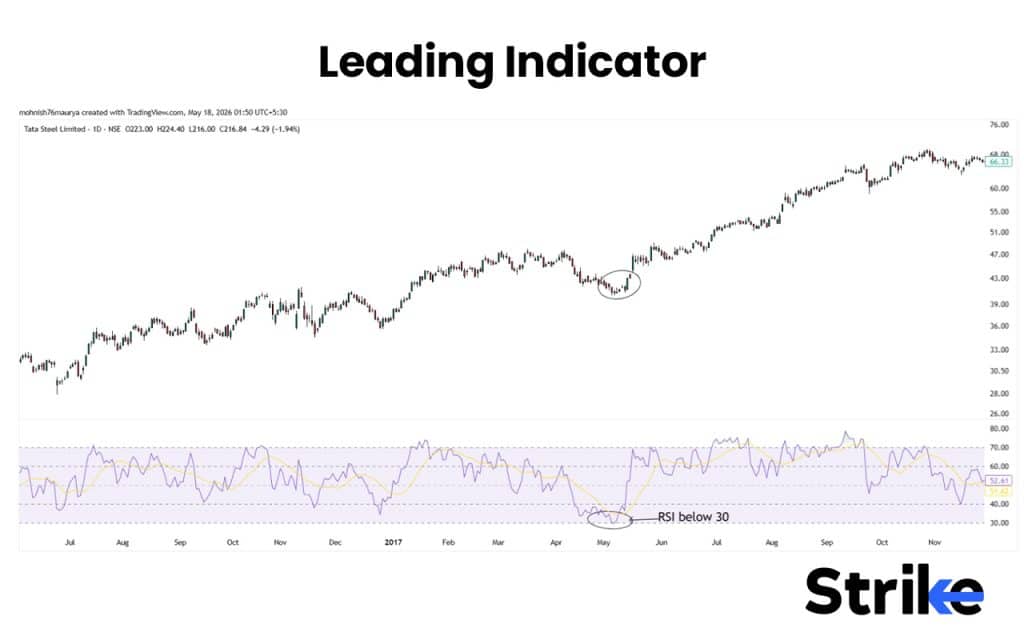
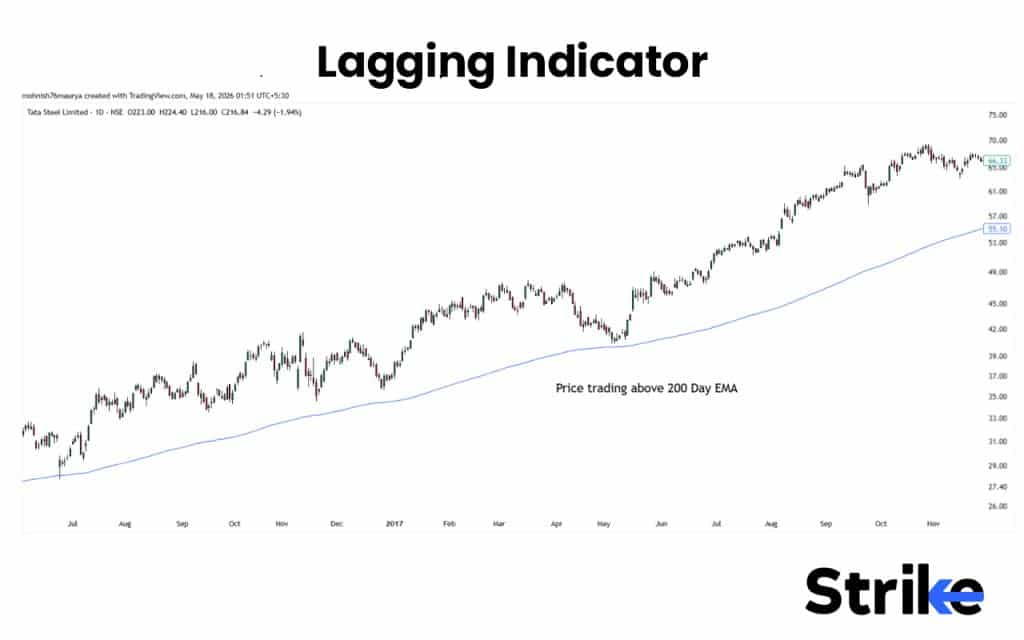
- Lagging Indicator: It validates the signal once price movement begins. If price crosses above 200 EMA, it confirms the uptrend.
- Confluence Zone: When both the indicators agree at the same point, it becomes a confluence zone. In this case, the confluence zone is where price crosses above 200 EMA after being RSI oversold.
While using trading indicators in confluence, make sure both indicators are from different families. For instance, avoid using RSI and stochastic oscillator in confluence as both are leading indicators. Also combine price action at the confluence zone to further improve the setup.
Is a Leading or Lagging Indicator Better?
Neither of them are universally better because they both serve different purposes. The better choice depends on your trading style, market condition, and objective. Leading indicator works best for early entry, reversal, and ranging market, whereas lagging indicator works best for trend confirmation and trend trading. Many traders also use both the indicators in combination to get early signals along with validation.
Are Leading Indicators Too Unreliable?
No, leading indicators are only unreliable when used alone without price action. Leading indicators alone are more prone to give false signals because their role is to predict the future price movement of the market.
Are Lagging Indicators Too Slow?
Not always, lagging indicators are slower in general because they derive their value from past price data, but it does not mean that lagging indicators are always too slow. Their slowness also depends on market conditions, indicator settings and trading style.
For instance, the supertrend indicator has default settings of ATR 10 and factor 3. If you change the settings to AR 5 and factor 1.5, the responsiveness of supertrend increases. Hence, lagging indicators are not too slow, they are just wrongly used to time the entries. The real job of lagging indicators is confirmation not prediction.
Which Indicator is More Effective in a Trending Market?
Lagging indicators are the most effective indicators to use in a trending market, because they help in confirming and validating the existing trend of the market. When the market trend is confirmed by lagging indicators, it increases the odds of winning. Moving averages, MACD, or supertrend are few popularly used lagging indicators. Lagging indicators also protects trades from early exiting in a strong trend.
The leading indicator in this case is less reliable, because leading indicators mostly work on a sideways market trend by giving reversal signals, which will not work in trending markets.
Which Indicator is More Effective in a Ranging Market?
Leading indicators are the most effective indicators to use in a range bound market, because it gives a reversal signal near support and resistance before price actually reverses from there. Leading indicators like RSI or Stochastic usually tells the overbought and oversold condition from where price would probability reverse within the range.
The Lagging indicator in this case is less effective because of their delayed signal. By the time the lagging indicator would give a signal, reversal would have already happened.
 24 mins