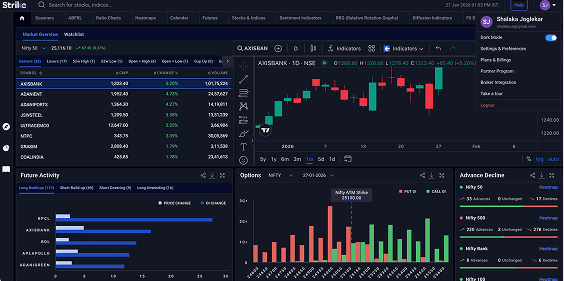
Relative Strength Index (RSI): How We Used This 70/30 Indicator in 6 High Win-rate Strategies


 Author

 Editor
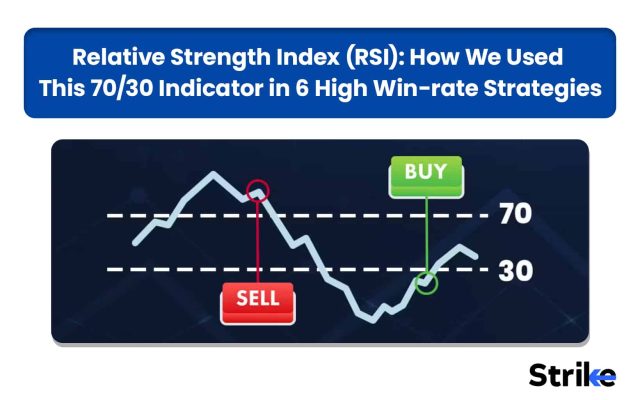
RSI (Relative Strength Index) is the most popular momentum indicator in technical analysis widely used by traders to measure price strength, identify overbought and oversold conditions, and spot potential trend reversals. RSI was developed by J. Welles Wilder Jr. and introduced in 1978 in his book New Concepts in Technical Trading Systems.
Even after 50 years, it is used by millions of intraday, swing, and long-term traders across stocks, forex, commodities, and cryptocurrencies to improve trade timing and confirm market momentum. In this guide, you’ll learn how RSI works, how to read its signals, the best settings and strategies, its advantages and limitations, and how to use it effectively in real trading.
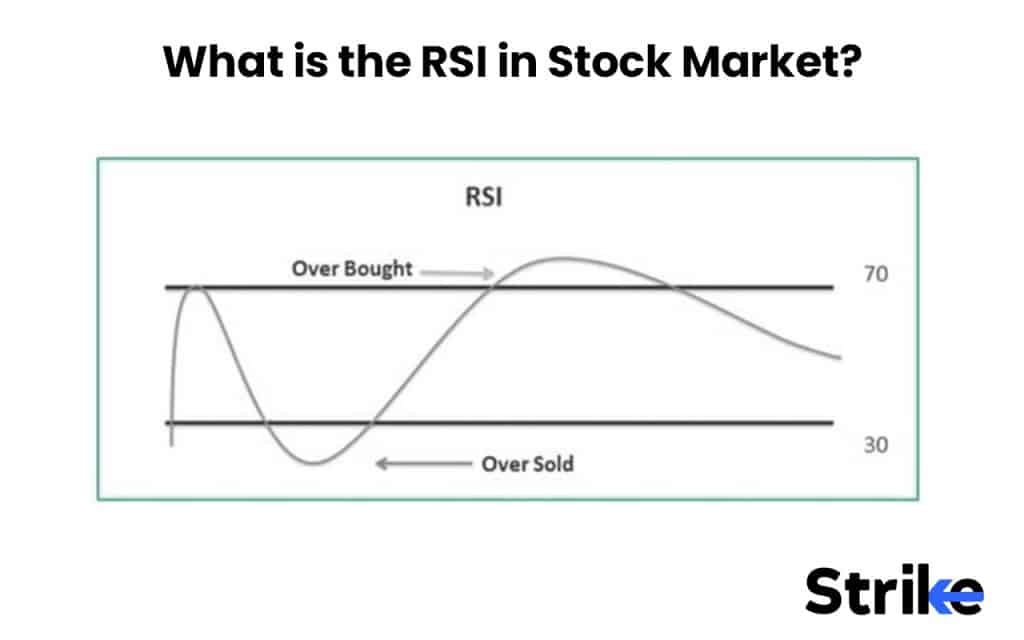
What is the RSI in Stock Market?
RSI (Relative Strength Index) is a momentum indicator that measures the speed and magnitude of the underlying asset on the scale of 0 to 100. This indicator is commonly used amongst technical traders to identify trend, momentum, overbought and oversold conditions.
How is RSI calculated?
RSI is calculated in two steps where the first step is to calculate the RS (Relative strength) and second step is to calculate RSI.
- RS (Relative Strength): RS is a ratio of the average gain and average loss of an asset over the last 14 days.
- RSI (Relative Strength Index): After the RS is calculated, it is then converted into an oscillator that ranges between 0 and 100 using the following formula given below.
RSI = 100 − (100 ÷ (1 + RS))
Let’s calculate the RSI using an example. We will first calculate the average gain and average loss for the last 14 periods.
- Average Gain = Average of all positive price changes.
- Average Loss = Average of all negative price changes (ignoring the sign).
For example:
| Day | Price Change |
| 1 | +2 |
| 2 | +1 |
| 3 | -1 |
| 4 | +3 |
| 5 | -2 |
| 6 | +1 |
| 7 | +2 |
| 8 | -1 |
| 9 | +1 |
| 10 | +2 |
| 11 | -1 |
| 12 | +3 |
| 13 | +1 |
| 14 | -1 |
Here the average gain is 1.14 (16 ÷ 14 ) and the average loss is 0.43 (6 ÷ 14). Now we will move to the next step.
Step 1: Calculate Relative Strength (RS)
Relative Strength (RS) compares average gains to average losses.
RS = 1.14 ÷ 0.43 = 2.65
Step 2: Convert RS into RSI
RS is then converted into a value between 0 and 100 using RS = 2. 65
RSI = 100 − [100 ÷ (1 + RS)]
RSI = 100 − [100 ÷ (1 + 2.65)]
RSI = 100 − [100 ÷ 3.65]
RSI = 100 − 27.40
RSI = 72.60
This is how a RSI is calculated. Calculates the ratio of average gains to average losses over a given period (usually 14 periods) and converts it into a momentum score between 0 and 100. The stronger the recent gains compared to losses, the higher the RSI value.
Why is the 14-period Setting Standard for RSI Calculation?
The 14-period setting is the default setting for RSI since it was invented by J. Welles Wilder Jr. in his 1978 book, New Concepts in Technical Trading Systems. However, the selection of 14-period setting was not random, he chose 14-period because it provides a good balance between sensitivity and reliability.
There are also a few different explanations floating around this question, why 14-period? One more explanation to this is that it represents half of a 28-day lunar cycle. Since many traders in the 1960s and 1970s believed markets moved in repeating cycles, Wilder may have viewed 14 days as a meaningful midpoint of a natural cycle.
As 14-period is default setting and provides a good balance, but you can change the settings of period to increase or decrease the responsiveness of RSI. Shorter periods like 5-9 are more sensitive and suit best for scalpers, whereas longer periods like 20-25 are less sensitive and filter out noise, suitable for long-term traders and investors.
What are Overbought and Oversold Conditions in RSI?
Overbought and oversold conditions in RSI is a term used by traders or investors to describe the extreme momentum of the underlying in one direction, from where the underlying may reverse. Lets understand about overbought and oversold conditions in detail with real time examples and charts.
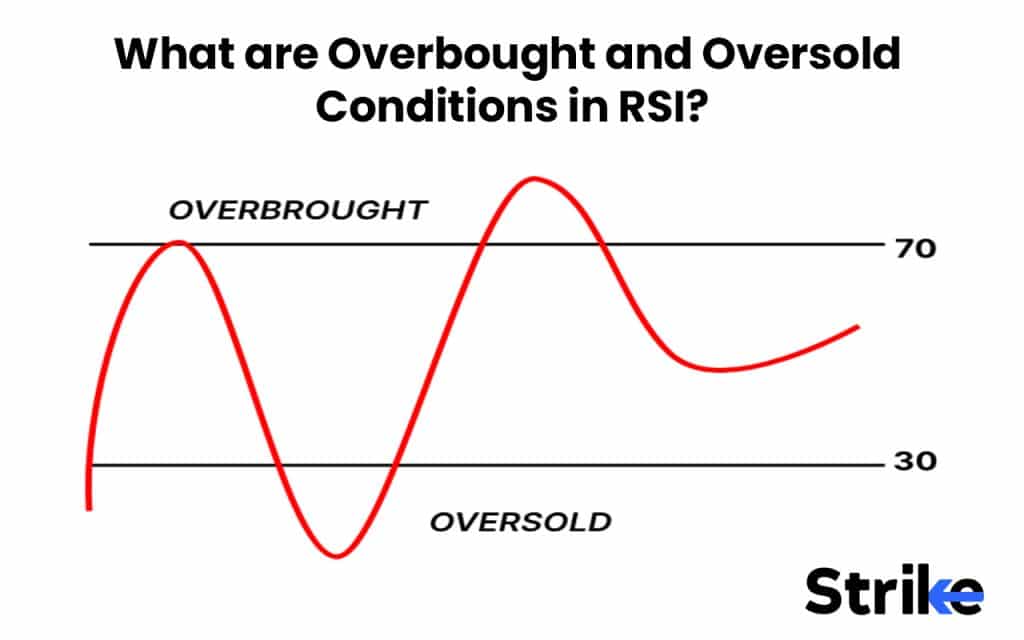
- Overbought Condition: A stock or any other underlying is said to be in overbought condition when it moves extensively in upward direction, where reading of RSI crosses above 70. This suggests buyers are very dominating and stock has risen strongly in a short period.
- Oversold Condition: A stock or any other underlying is said to be in oversold condition when it moves extensively in a downward direction, where reading of RSI crosses below 30. This suggests that the sellers are very dominating and stock has fallen strongly in a short period.
During these conditions, traders often expect prices to reverse due to its overextended move in one direction. So, if the price has increased aggressively in the upward or downward direction causing RSI to signal overbought or oversold, traders expect a fall or rise in price led by profit booking or a logic of mean reversion.
However, overbought and oversold condition does not mean guaranteed reversal. A stock can stay above RSI 70 for a long period if the uptrend is very strong. Similarly, a stock can stay below RSI 30 for a long period, if the downtrend is very strong. In my experience of trading, overbought and oversold reversal trades, rising wedges in overbought conditions is the best reversal setup to trade with a win rate of more than 65-70%.
Why does RSI Move Between 0 and 100?
RSI moves in between 0 and 100 because it is a mathematically normalized indicator, which means the value of the indicator is mathematically designed to stay in a range. Let me explain using the RSI formula.
If we consider the worst case scenario, where the stock price is continually falling and not gaining, the average gain will be equal to zero and average loss will be equal to X% (more than zero)
- Average Gain = 0
- Average Loss > 0
Now if we calculate RSI,
- RS (relative strength) = Average gain/Average loss = 0
- RSI = 100 − (100 / (1 + RS) = 100 − (100 / (1 + 0) = 100 – 100 = 0
It means during extreme bearish momentum RSI cannot go below zero.
Similarly, consider a very optimistic condition where stock is continuously rising and not falling, the average gain will be equal to Y% (more than zero) and average loss is going to be 0.
- Average Gain > 0
- Average Loss = 0
Now if we calculate RSI,
- RS (relative strength) = Average gain/Average loss = Infinite
- RSI = 100 − (100 / (1 + RS) = 100 − (100 / (1 + infinity) = 100 – 0= 100
It means during extreme bullish momentum RSI cannot go above 100.
However, in the real market stock usually has a mix of positive and negative, so stock usually doesn’t reach exactly zero or exactly 100 levels. In my trading journey so far I have never seen any stock reaching extreme ends of RSI. The minimum value of RSI I have seen is near 10 while maximum RSI value is near 90.
What Does RSI 70, 50 and 30 Mean?
RSI 70, 50 and 30 are standard reference points for reading RSI, where it helps traders to understand the strengths of the buying/selling momentum, and shift in momentum.
- RSI 70: RSI 70 is a critical level to identify bullish momentum and potential bearish reversal. If the RSI is above 70, it means that the buying side momentum is very strong and a stock has stretched in upward direction temporarily. During this condition traders look for a bearish reversal setup if confirmed by a bearish reversal pattern. If RSI falls below 70 after being overbought and struggles to move above 70 again, it suggests the shift in momentum from bullish to bearish.
- RSI 50: RSI 50 indicates balance between buyers and sellers. Here neither buyers nor sellers are dominating, the momentum is neutral. This is usually seen in a sideways or range-bound market.
- RSI 30: RSI 30 is a critical level to identify bearish momentum and potential bullish reversal. If the RSI is below 30, it means that the selling side momentum is very strong and a stock has stretched in downward direction temporarily. During this condition traders look for a bullish reversal setup if confirmed by a bullish reversal pattern. If RSI rises above 30 after being oversold and struggles to move below 30 again, it suggests the shift in momentum from bearish to bullish.
Many professional traders also use a 60, 50, and 40 level instead of 70,50, and 30 to generate more signals. RSI reacts to 60 levels more frequently than 70, giving traders more trading opportunities.
How does Changing the RSI Period Impact the Sensitivity of the Signals?
Changing the period of RSI directly affects its sensitivity of indicator towards price. If the period of RSI is reduced below 14, it considers less previous candle data in the calculation and will react fast towards price change (more sensitive), while if you increase the period above 14, it will consider more previous candle data in calculation and will react slower to the price change (less sensitive).
- RSI Period for Short-Term: Shorter RSI periods like 5-9 are commonly used by short-term trades like scalpers or intraday traders. A shorter period increases the sensitivity of RSI and generates fast signals.
| Effect | Explanation |
| Responds faster to recent price changes | Only the last 5–9 bars determine average gains/losses, so a single strong move has a larger impact. |
| Reaches extremes more often | RSI hits >80 or <20 more frequently; it looks more volatile and unstable. |
| More overbought/oversold signals | You get more buy/sell triggers, but also more false signals |
| Better for short-term trading | Suits day trading, scalping, or very short swing setups where you want early entries |
- RSI Period for Long-Term: Longer RSI periods like 20-25 are commonly used by long-term trades like swing traders, positional traders, or investors. A long period increases the sensitivity of RSI and generates slow and reliable signal signals.
| Effect | Explanation |
| Slower to react | Average includes more bars, so recent moves are diluted by older data. |
| Smoother, more stable line | RSI stays closer to the middle (around 50) and rarely leaves the 30–70 range. |
| Fewer extreme readings | Overbought/oversold signals are less frequent but often more reliable in strong trends. |
| Better for longer timeframes | Preferred on higher timeframes (daily, weekly) to reduce noise and false signals |
If you use very short periods like 2–4, it can make RSI almost binary, bouncing near 0 or 100 constantly.
How to Plot RSI on Chart?
You can plot RSI on a chart in three simple steps. These steps are briefly discussed below.
- Select a Charting Platform: Select any charting platform like Strike Money, Tradingview, Investopedia or any preferred broker.
- Select Stocks or indices: Select the stock or index you want to analyse and launch its chart.
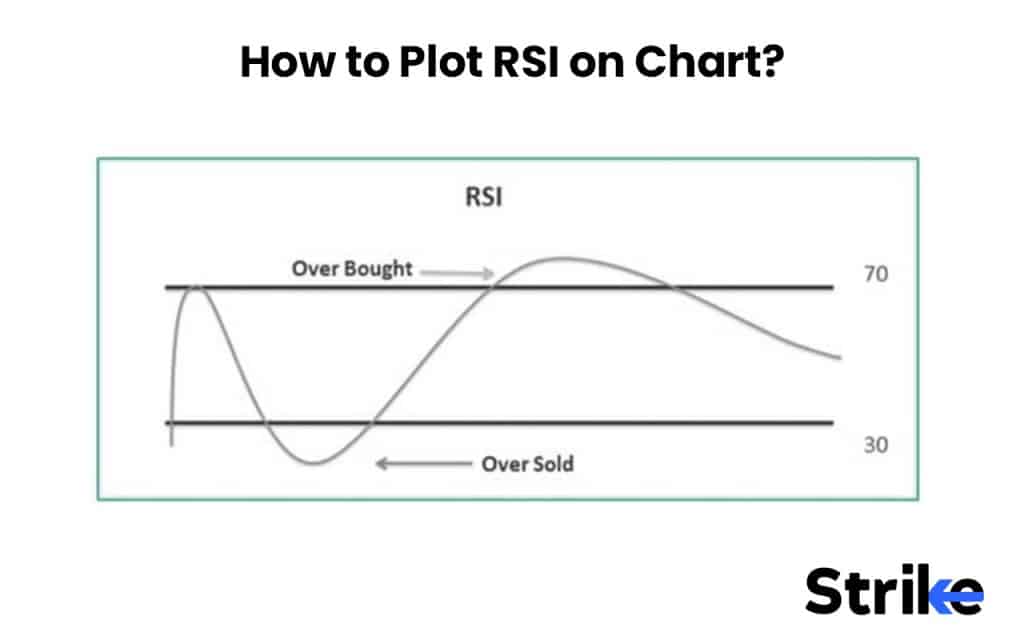
- Apply RSI: Go to the indicator section on the top of the chart and search for the RSI indicator and apply it on the chart. The RSI indicator will get plotted below the price chart.
You can also change the RSI settings based on your preference by opening the indicator settings.
How to Read RSI Indicator?
There are five main ways to read RSI indicators which includes reading RSI direction, RSI levels, RSI slope, RSI trendline, RSI 50-line and RSI divergence.
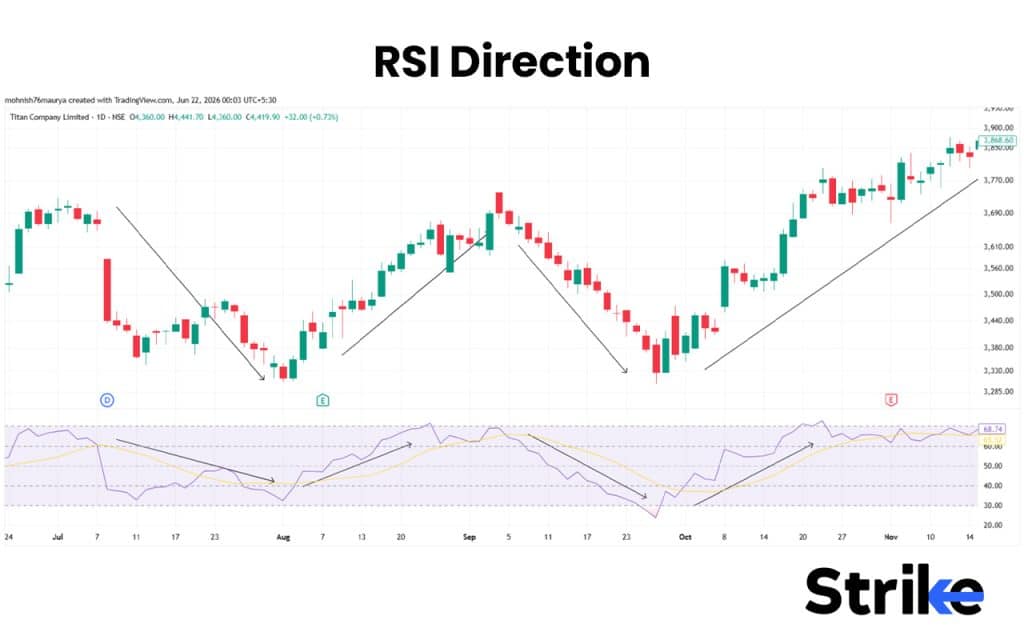
- RSI Direction: RSI directly indicates the momentum of the stock. If you see RSI moving in an upward direction, it indicates that buying pressure is increasing and bulls are gaining control. When RSI moving downward indicates increasing selling pressure and control of bears. Hence, you can use RSI direction to gauge the momentum behind a price move.
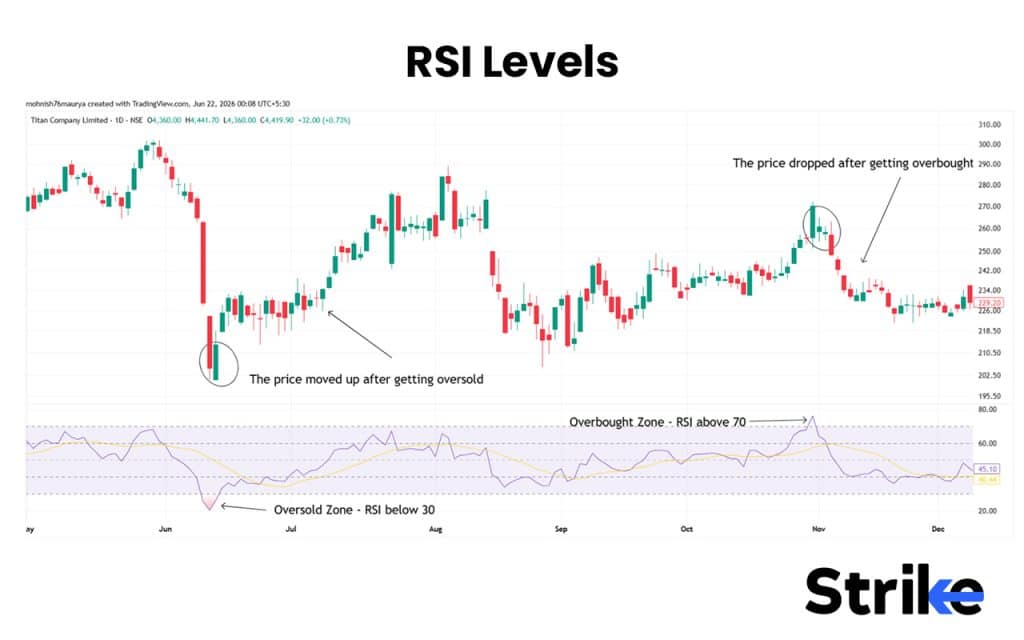
- RSI Levels: RSI levels like 70, 50, and 30 help traders identify potential overbought / oversold conditions, and to identify the overall momentum and trend direction of a stock. Traditionally, an RSI above 70 suggests strong buying momentum and the asset may be overbought, while an RSI below 30 suggests strong selling pressure and possible oversold conditions. These levels can help traders spot potential reversal or pullback opportunities.
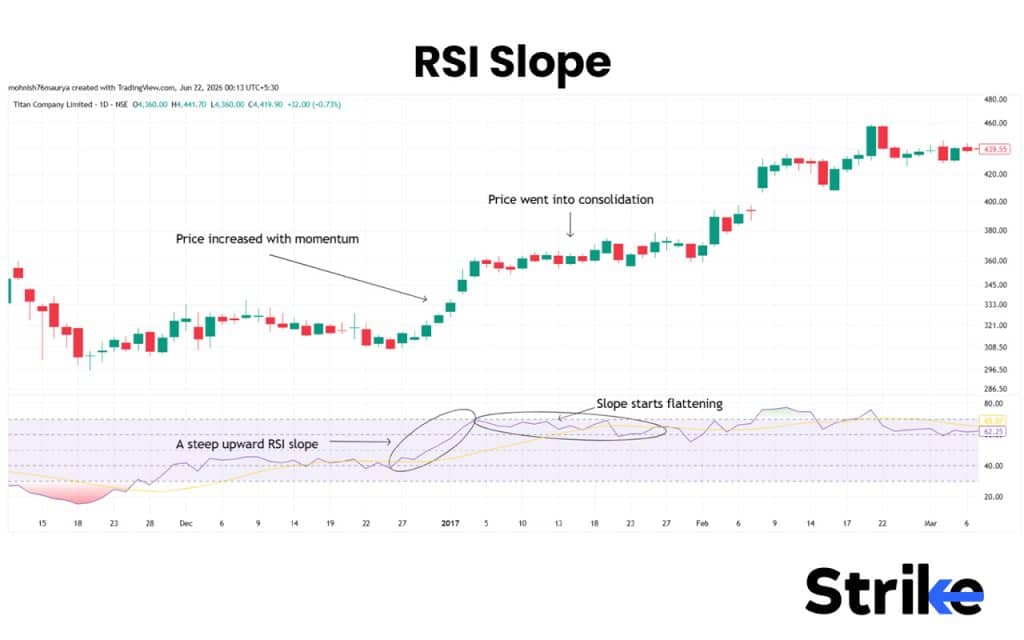
- RSI Slope: A steep upward RSI slope indicates strong buying momentum, while a steep downward slope indicates strong selling momentum. If the slope starts flattening, it often suggests that momentum is weakening and a consolidation or reversal may come.
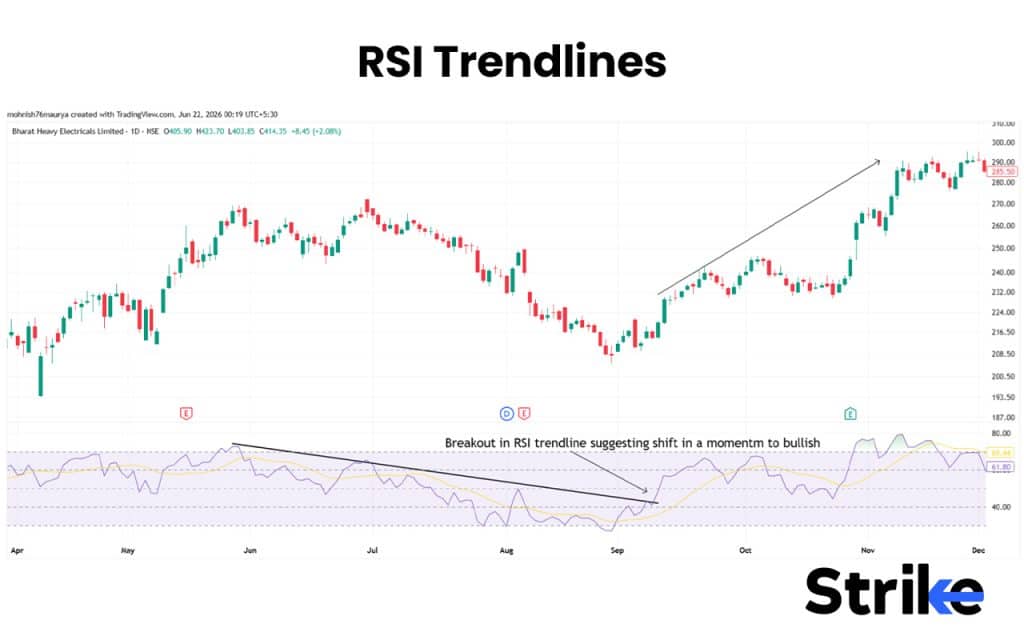
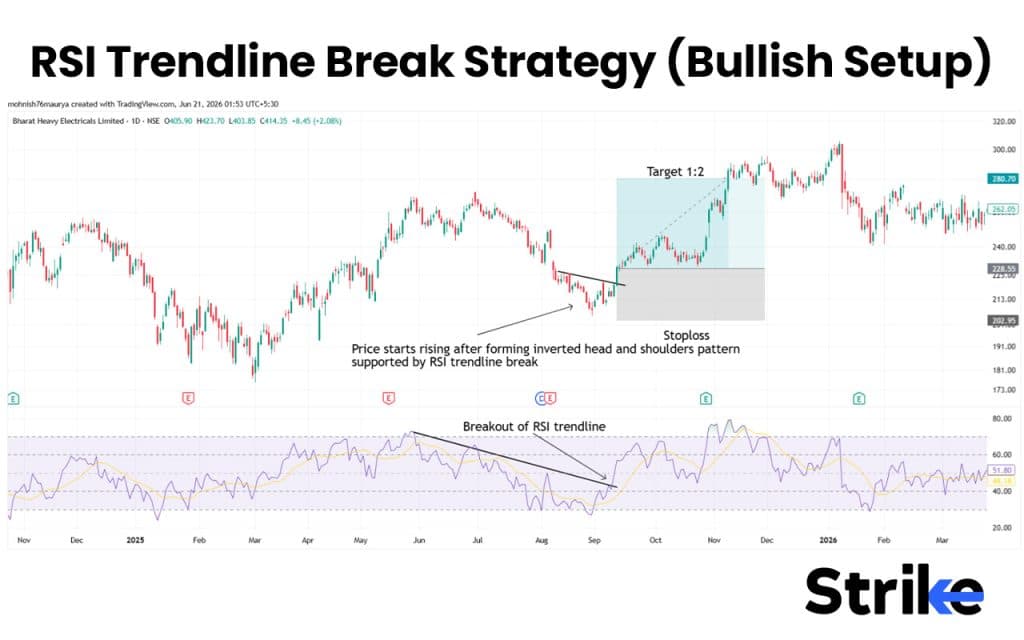
- RSI Trendlines: Trendlines can be drawn directly on the RSI indicator just like on a price chart to identify momentum trends and potential breakouts. An RSI trendline break often occurs before a similar breakout or breakdown appears on the price chart, making it a useful early warning signal for momentum shifts.
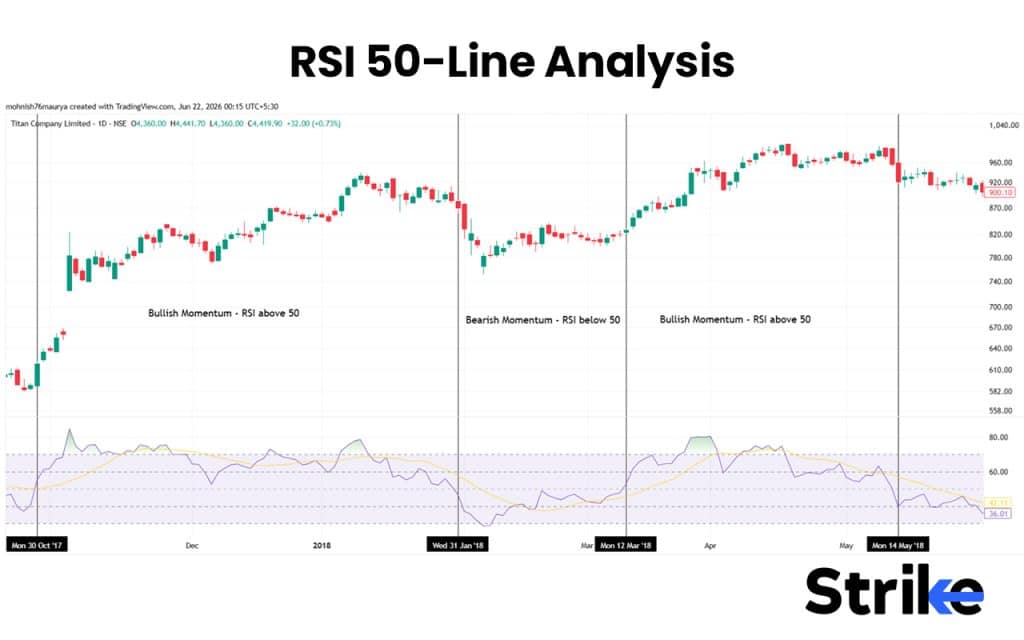
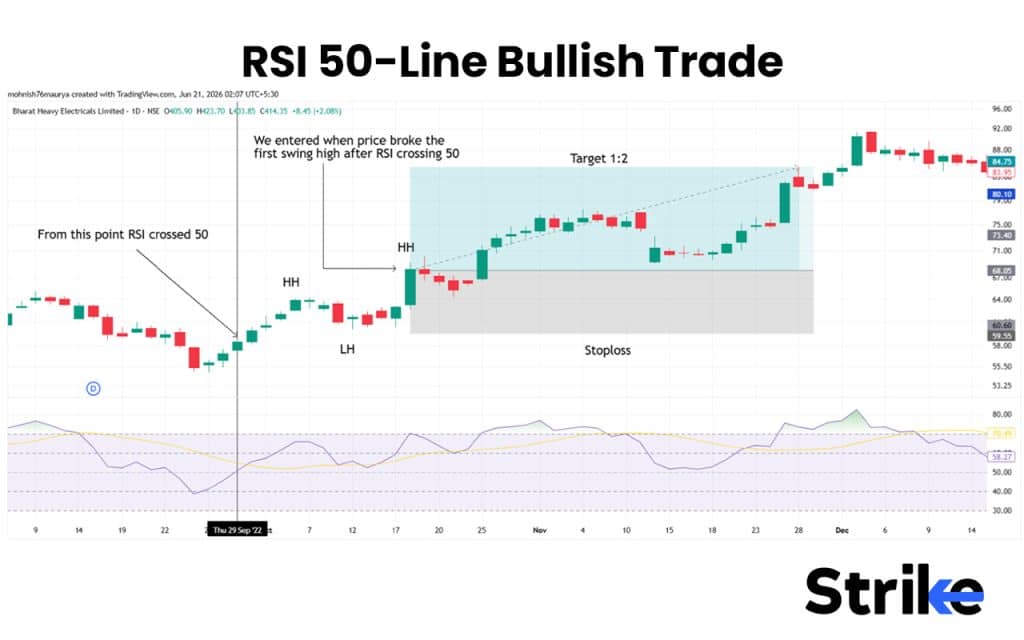
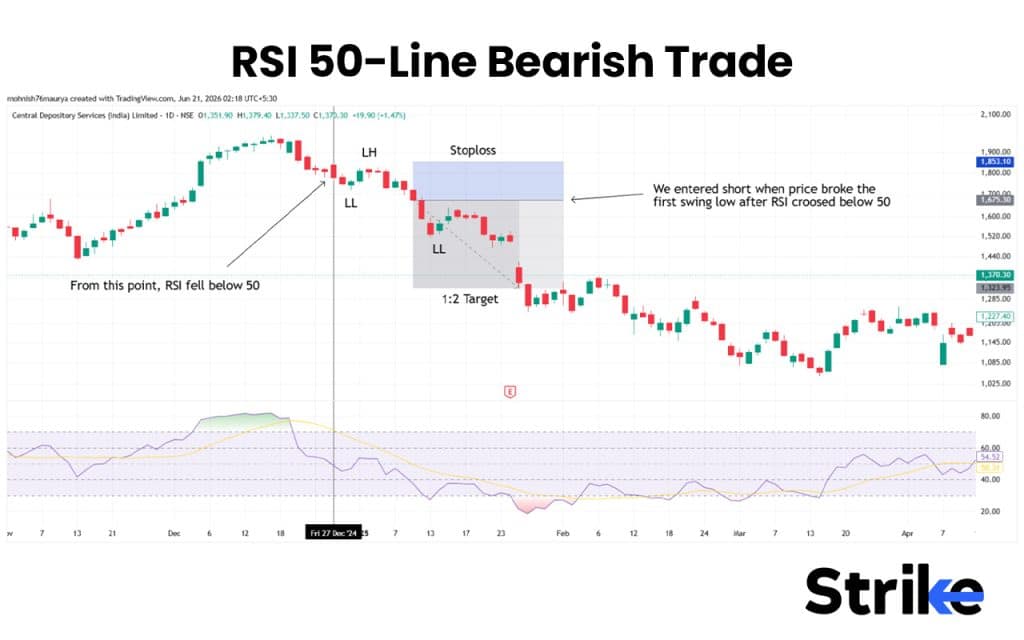
- RSI 50-Line Analysis: It acts as a momentum driver. RSI above 50 means the momentum is currently bullish, while RSI below 50 means the momentum is currently bearish. Many traders use the RSI 50 line to identify overall trends.
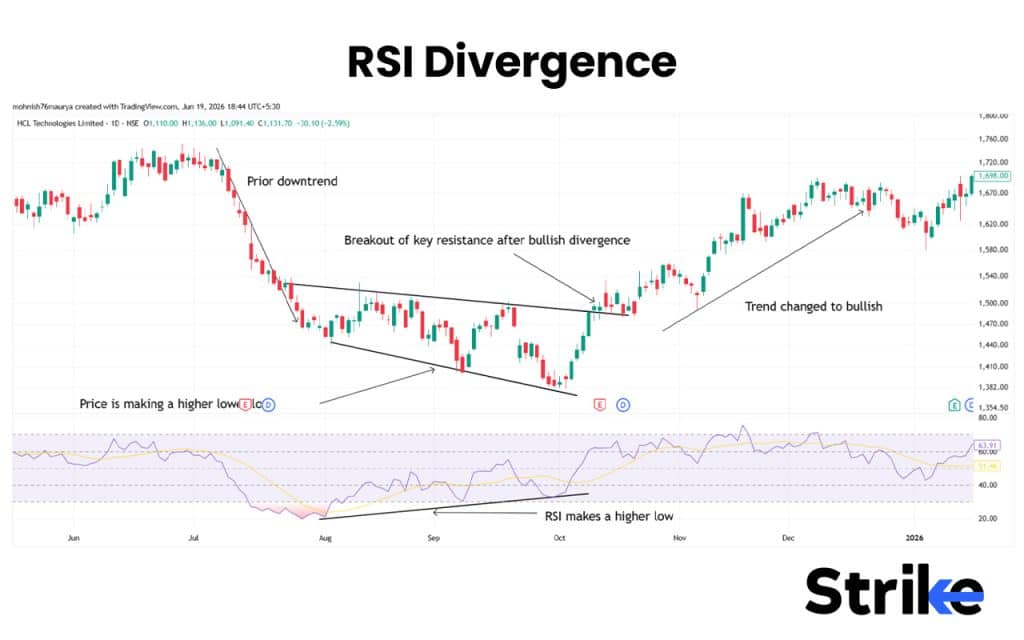
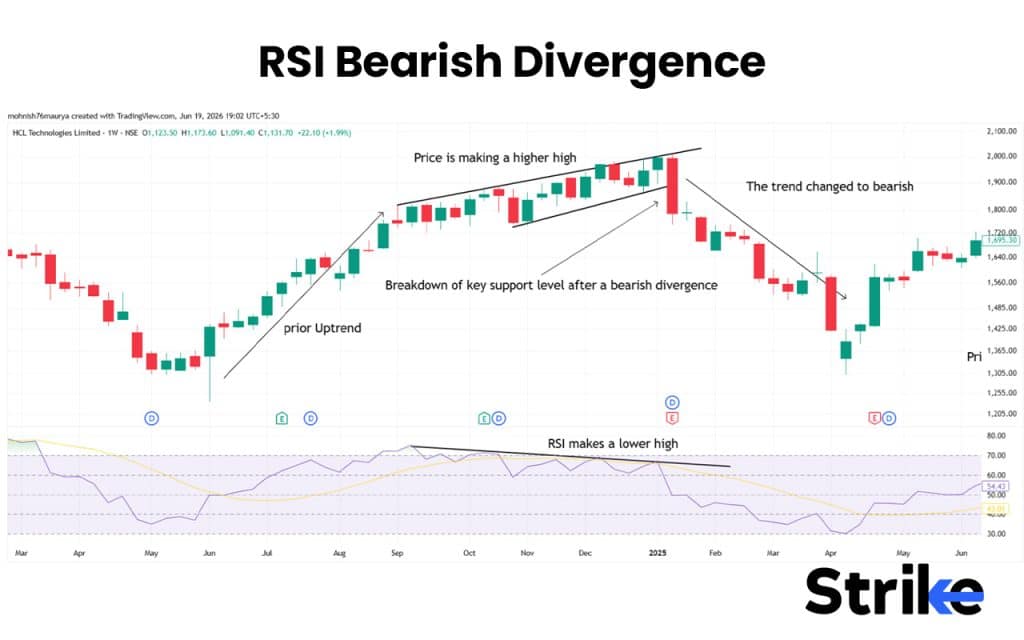
- RSI Divergence: Divergence occurs when RSI and asset price both move in opposite directions. A bullish divergence occurs when price makes lower low but RSI makes a higher low. This means selling momentum is weakening and a bullish reversal may occur. Similarly, Bearish Divergence occurs when price makes a higher high but RSI makes a lower high. This suggests buying momentum is weakening and a bearish reversal may occur.
The most effective way to read RSI is not by focusing on a single signal but by combining RSI levels, direction, slope, the 50-line, divergences, and trendlines. The more RSI signals align with price action and market structure, the more reliable the trading setup becomes.
Which RSI Settings Works Best for Intraday,Swing, & Longterm
RSI setting can be changed depending on whether you want to do intraday, swing, or long-term. The best RSI settings for each type of trading is mentioned below in the table.
| Trading Style | Recommended RSI Setting | Why It Works |
| Scalping | RSI 5 or RSI 7 | More sensitive to short-term price movements and generates frequent signals. |
| Intraday Trading | RSI 7 to RSI 9 | Reacts quickly to momentum changes and helps identify short-term overbought and oversold conditions. |
| Swing Trading | RSI 14 (Standard Setting) | Balances sensitivity and reliability, making it suitable for capturing multi-day price swings. |
| Positional Trading | RSI 14 to RSI 21 | Filters out market noise and focuses on medium-term trend momentum. |
| Long-Term Investing | RSI 21 to RSI 30 | Produces fewer but more reliable signals by focusing on major momentum shifts. |
Make sure to backtest RSI settings on the stocks and timeframe you trade. Different stocks have different volatility characteristics, and an RSI setting that works well for one stock or market may not perform equally well on another.
6 RSI Trading Strategies We Use at Strike with High Win Rate
We at Strike use six different RSI strategies for different market conditions like trend reversals, momentum shifts, and trend continuation setups. Each of these strategy is briefly discussed below.
1. RSI Divergences
We use RSI divergence strategy to trade reversals. RSI divergence is a phenomenon where price and RSI move in opposite directions, suggesting that the momentum behind the current trend is weakening and the current trend may reverse.
- Bearish Divergence: If price is making a higher high, but RSI makes a lower high, it suggests a bearish divergence which means that the current uptrend is weakening and price may reverse to bearish.
- Bullish Divergence: If price is making a lower low, but RSI makes a higher low, it suggests a bullish divergence which means that the current downtrend is weakening and price may reverse to bullish.
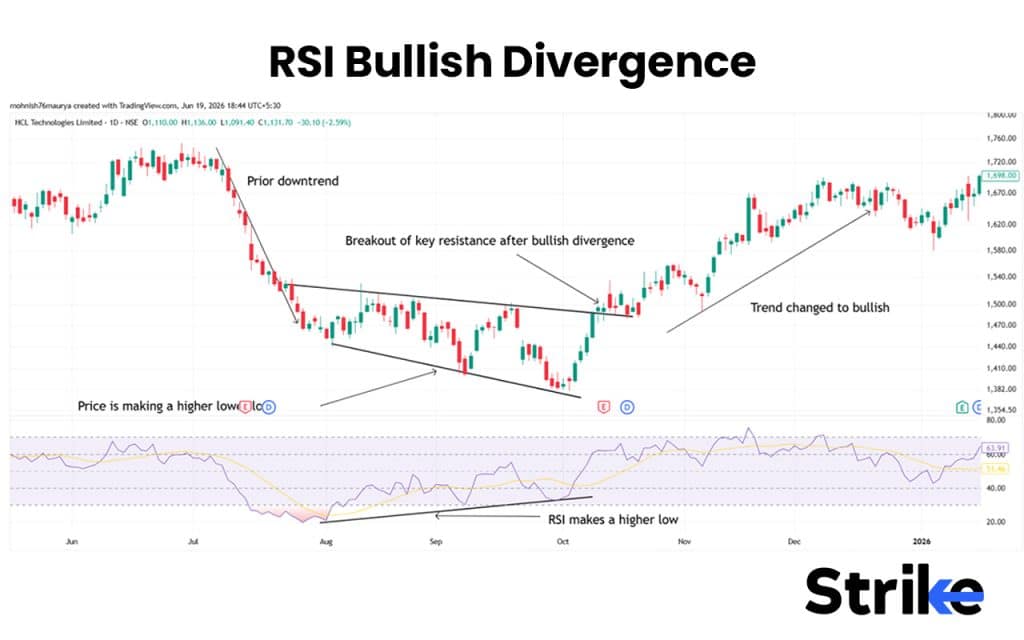
Notice that I have used the word “may reverse” which means you cant just enter reversal trade just because it is forming divergence. A price should confirm the reversal by breaking a key support or resistance level or by forming a reversal candle pattern.
A divergence pattern formed during overbought and oversold condition with price at level 1 of fibonacci extension, usually gives a strong reversal trade.
2. RSI 50-Line Strategy
I feel RSI 50-line strategy is the most underrated trading strategy, because traders mainly focus on RSI 70 and 30 levels. However RSI 50 is also a critical level because it acts as a momentum boundary. Also, entering trade near RSI 50 allows you to ride the entire momentum till overbought (RSI 70) and oversold Zones (RSI 30).
- Bullish Trade: When the RSI is above 50 it means average gains have been outpacing average losses, so momentum is net bullish. In such conditions we look for a higher low formation to enter a long trade.
- Bearish Trade: When the RSI is below 50 it means average gains have been underperforming average losses, so momentum is net bearish. In such conditions we usually look for lower high formation to enter a short position.
I will share one bonus point here, if the higher timeframe RSI is bullish ( above 50 or 60) and lower timeframe crosses above RSI 50 from below, it provides the best 50-line strategy setup. Similarly it applies to the downside as well. You can also combine this strategy with moving averages like 20 and 50 periods.
3. RSI Trendline Break Strategy
Many traders are not aware of this concept of drawing trendlines directly on RSI instead of charts. Break of this trendline helps spot an early shift in momentum before price visibly does.
Bullish Setup: Draw a downward trendline on RSI by connecting lower highs and wait for its breakout. Once RSI breaks the trendline it signals a rise in momentum, where we usually look for a long trade.
Bearish Setup: Draw an upward trendline on RSI by connecting higher lows and wait for its breakout. Once RSI breaks the trendline it signals a rise in momentum, where we usually look for a short trade.
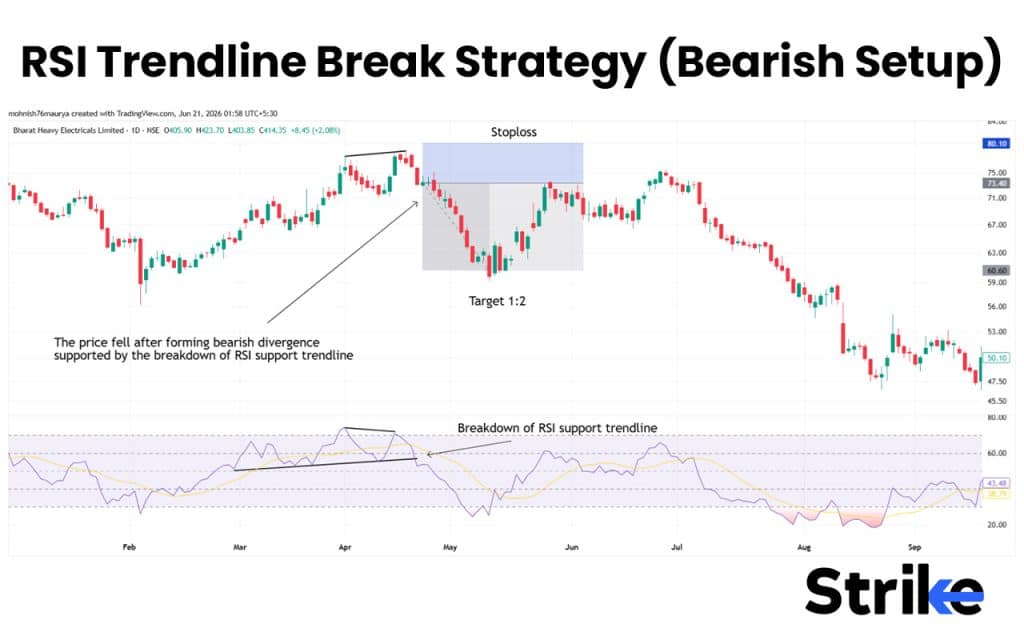
However, we do not enter on RSI break alone, we confirm the break by analyzing the price chart.
4. RSI with Support and Resistance
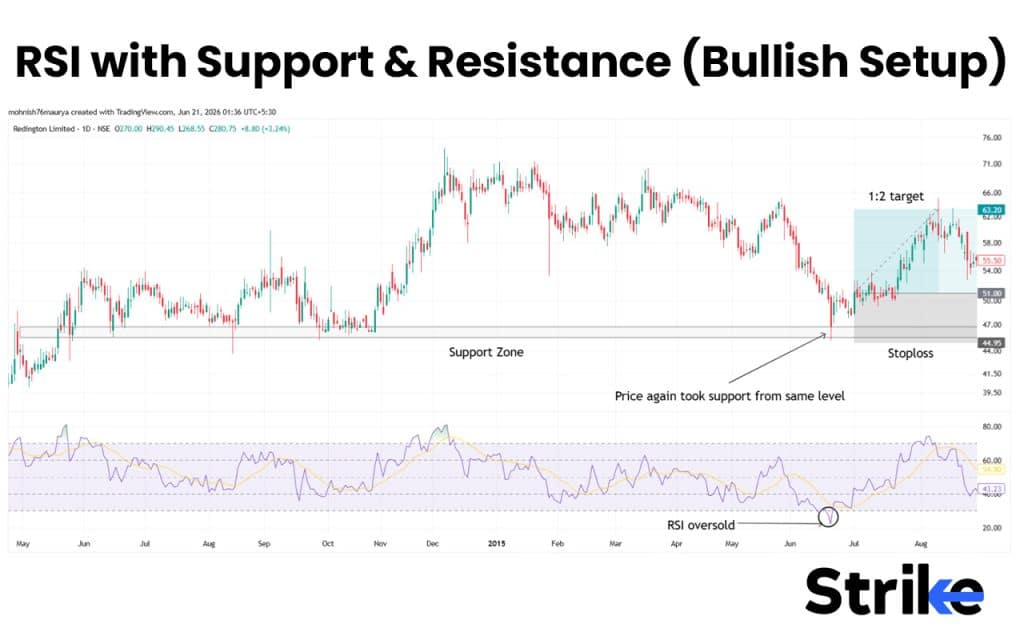
RSI signals at key levels are more meaningful rather than signals in the middle of nowhere. RSI signalling oversold near support or signalling overbought near resistance carries high reliability.
- Bullish Setup: When price reaches a key support level and RSI goes oversold (below 30) a long trade can be planned after a bullish reversal candle or pattern.
- Bearish Setup: When price reaches a key resistance level and RSI goes overbought (above 70) a short trade can be planned after a bearish reversal candle or pattern.
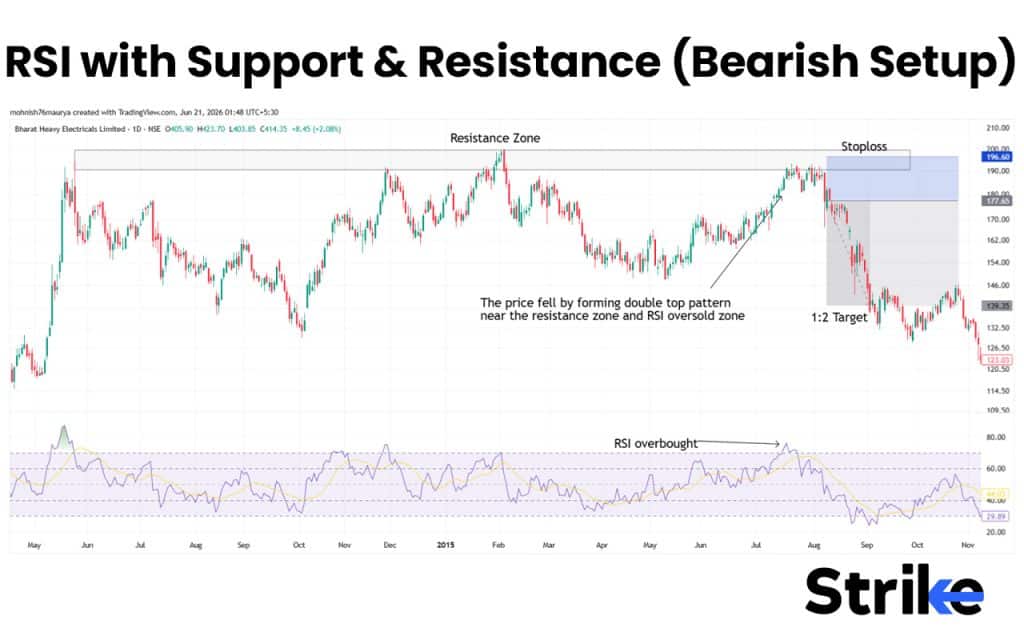
A wedge pattern near support or resistance with RSI divergence gives best reversal setups.
5. RSI with Moving Averages
This is the most effective setup to trade RSI because it involves confluence of trend direction as well along with momentum. We typically use only 50 and 200 period moving averages along with RSI because the 50-period provides the best short term trend direction and the 200-period provides the best long-term trend direction.
- Bullish Trade: We usually identify the trend first using 50 or 200 period EMA and then wait for RSI to drop below 30 or 40. If the price is trading above 50 or 200 EMA, the trend is up and we look to buy stock at a discount price in this uptrend when the RSI is below 30 or 40 and forms a reversal pattern.
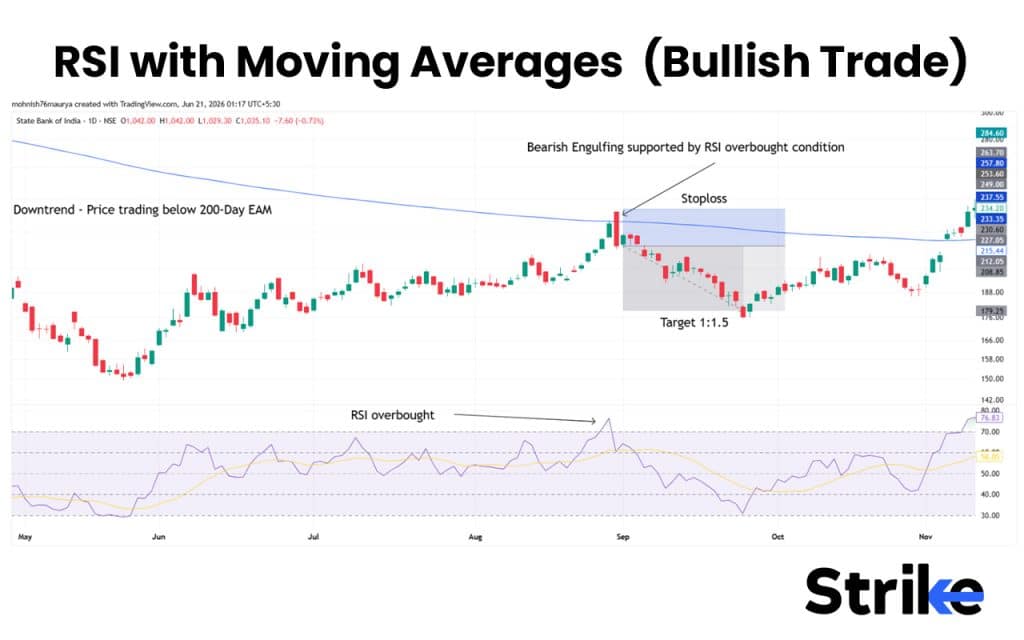
- Bullish Trade: Similarly, we identify the trend first using a 50 or 200 period EMA and then wait for RSI to rise above below 60 or 70. If the price is trading below 50 or 200 EMA, the trend is down and we look to sell or short the stock at a premium price in this downtrend when the RSI is above 60 or 70 and forms a reversal pattern.
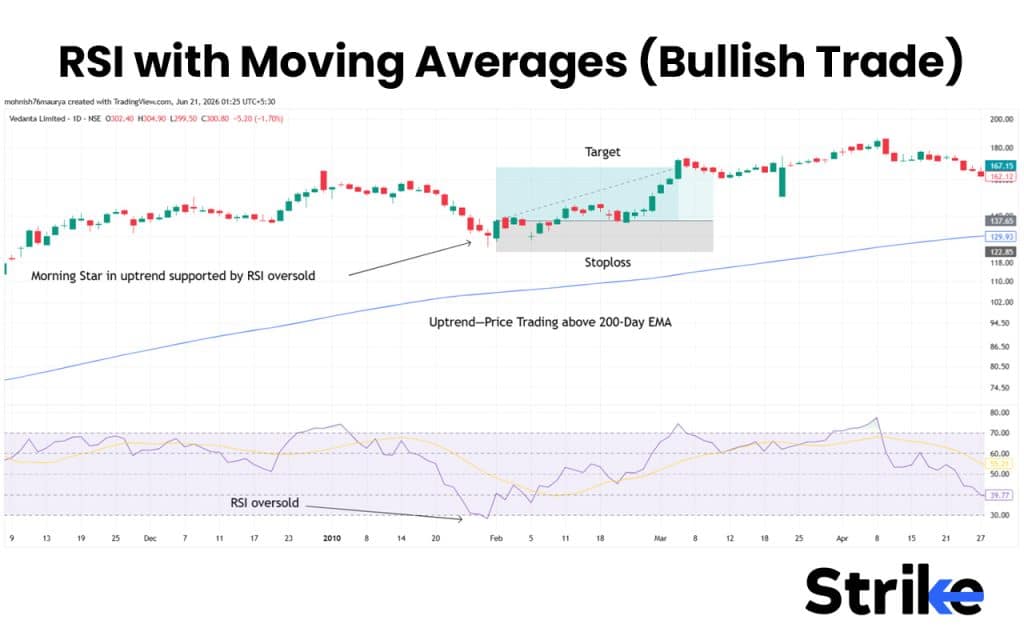
If you have noticed, I have mentioned RSI level 40 and 60 along with 30 and 70, this is because in a strong downtrend or uptrend, RSI usually don’t fall below 30 or rise above 70 very often. What I have also observed is during a strong trending market, RSI 50 alone becomes a very important level. In a strong uptrend RSI 50 provides support to price, while in a strong downtrend, RSI 50 provides resistance to price.
6. RSI Crossback Strategy
This is the simplest reversal trading strategy with RSI where we plan to buy or sell when RSI crosses back inside the normal range.
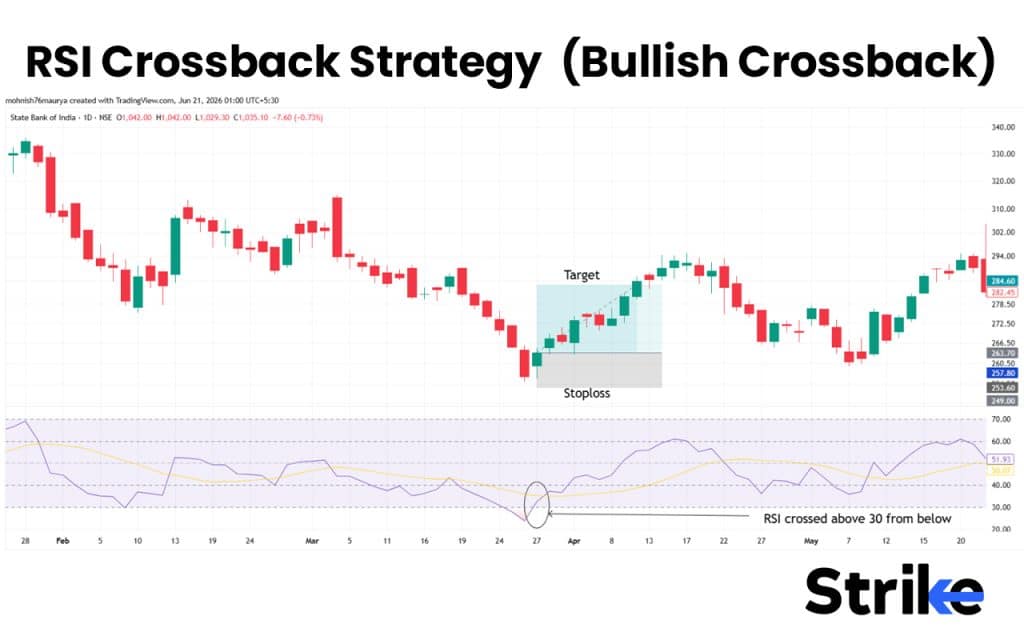
- Bullish Crossback: When RSI falls below 30 and again rises back above 30, closing inside the normal range of RSI, it suggests selling pressure is weakening and buyers are returning. We usually buy on candle close and place stoploss below candle low or swing low.
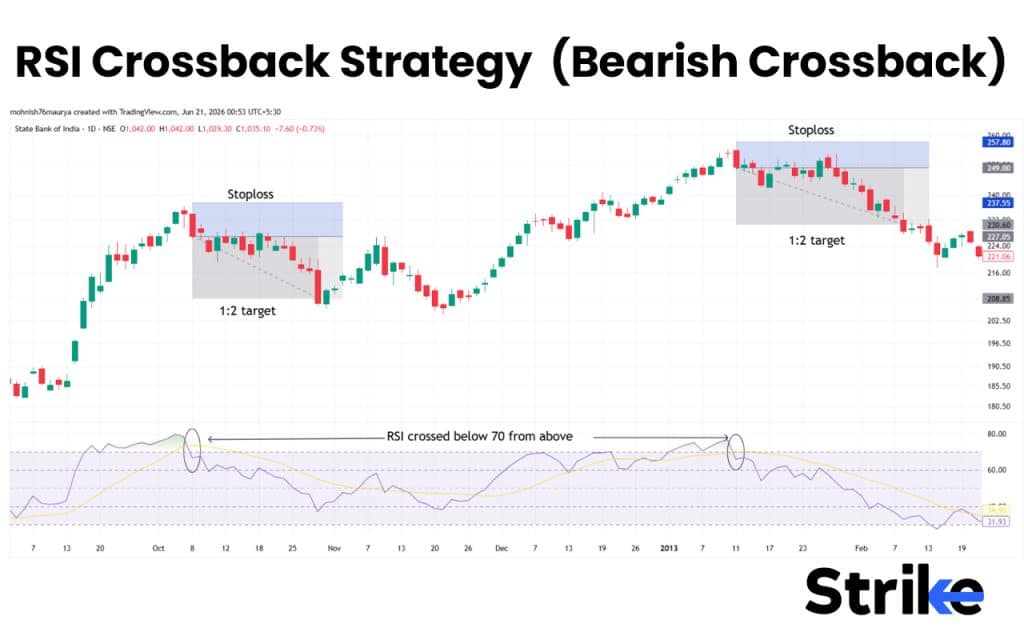
- Bearish Crossback: When RSI rises above 70 and again falls back below 70, closing inside the normal range of RSI, it suggests buying pressure is weakening and sellers are returning. We usually sell on candle close and place stoploss above candle high or swing high.
This strategy works best in the sideways market. In trending market RSI crossbacks are mostly short-term correction
Most strong trends experience temporary pullbacks. RSI helps identify when those pullbacks may be ending and the trend is ready to resume.
What is Cutler’s RSI?
Cutler’s RSI is a variation of J. Welles Wilder Jr.’s original RSI (Relative Strength Index), developed by Andrew Cutler in the early 1980s. It uses a Simple Moving Average (SMA) instead of Wilder’s smoothed moving average to calculate average gains and losses.
This difference in moving average, cutlers RSI tends to react faster to price changes, reach overbought and oversold levels more frequently, generate more trading signals, be slightly more sensitive but potentially noisier. They both behave the same 0-100 scale, same 70/30 overbought/oversold zones, same basic formula structure.
Thomas Cutler created “Cutler’s RSI” to overcome “Data Length Dependency” which means Wilder’s original RSI values depended on how much historical price data is used in the calculation.
Why Do Some Traders Lose Money Using RSI?
Many traders lose money with RSI not because the indicator is bad, but because they misunderstand what RSI is actually telling them.
RSI is a momentum indicator, not a buy or sell signal by itself. There are six mistakes traders commonly make, specially beginners which are briefly discussed below.
- Buying Because RSI is Below 30: Just because RSI is below 30, many trades specially beginners enter a long position consider it as an oversold condition, but as we have discussed earlier, RSI below 30 does not mean immediate buy. If the trend is strongly bearish, RSI can stay below 30 for a long period of time. Hence, only enter a trade once price forms a bullish reversal pattern.
- Selling Because RSI is Above 70: RSI above 70 does not always mean a reversal. In a strong trending market a RSI can remain above 70 for a long period of time. Therefore, enter a short trade only when you see an overbought condition supported by a bearish reversal candlestick pattern.
- Ignoring the Trend: There are different methods to trade using RSI, but many traders just blindly apply the same rules everywhere without any trend context, and end up misinterpreting the RSI signal. For instance, RSI overbought and oversold works best in sideways market trends, while RSI as a support and resistance works best in trending markets.
- Using RSI Alone: RSI alone does not give any buy and sell signal, it just tells you the rising and weakening of momentum. Combine RSI signal with price action, support/resistance, and trend analysis.
- Ignoring RSI Divergences: Many traders only focus on RSI levels like 70, 30, or 50 and miss the most valuable information that comes from divergence. RSI divergence provides early signs of weakening of trend.
- Ignoring Risk Management: Even a perfect RSI signal can fail, hence it is important to manage the risk while trading RSI.
Most traders lose money with RSI because they use it as a standalone buy/sell signal, ignore the broader trend, and fail to wait for confirmation. RSI is best used as a momentum confirmation tool alongside price action, support and resistance, trend analysis, and proper risk management, not as a magic indicator that predicts reversals.
How Accurate is RSI Signal?
RSI alone does not have any X% of accuracy, because RSI is just a momentum indicator and therefore the accuracy depends entirely on how it is interpreted and used along with the price action. The accuracy of RSI depends on the market, timeframe, and trading strategy used. According to a backtest by Liberated Stock Trader, RSI signals on lower timeframes such as 1-minute and 5-minute charts showed relatively low success rates of around 20%–23%. However, RSI performed better on the 1-hour timeframe, where some configurations achieved success rates of up to 65%.
Additional strategy backtests from Quantified Strategies found that combining RSI with other indicators can significantly improve results. For example, RSI combined with EMA filters achieved a higher win rate than using EMA alone, while RSI combined with VIX filters produced success rates above 80% in certain market conditions.
Can RSI Give False Signals?
Yes, RSI can give false signals because no indicator is 100% accurate. RSI measures momentum not future price direction, which means it can suggest the buying and selling pressure but it cannot guarantee the price move.
I have observed six major scenarios where RSI gives false signals. These scenarios are briefly discussed below.
- During Strong Uptrends: In a strong uptrend RSI can give you a perfect bearish reversal trade and price will start to fall, but after a very small fall price again starts to move in upward direction. In this case, the overbought signal becomes a false sell signal.
- During Strong Downtrends: In a strong downtrend RSI can give you a perfect bullish reversal trade and price will start to rise, but after a very small rise price again starts to move in downward direction. In this case, the oversold signal becomes a false sell signal.
- When RSI Divergence Fails: RSI divergence is mainly used to identify trend reversal, but it is not guaranteed that trend will reverse. Sometimes stock takes a pause before continuing the trend where RSI might signal a divergence, but this divergence fails when price continues its trend without reversing.
- During Major Events: Any major events like earning surprises, interest decisions, economic data, or a geopolitical event can cause stock to move extremely overbought or oversold and then continue moving strongly in the same direction.
- When Using Very Short RSI Periods: Shorter period RSI reacts very fast to a price change and fluctuates very fast. Even a small move in price makes RSI overbought and oversold, creating more false signals.
RSI does not fail because it is inaccurate; it fails when traders misinterpret momentum as a guaranteed reversal signal. The best way to avoid false RSI signals is to use it as a confirmation tool rather than a standalone trading system.
Is RSI Reliable during High-impact News Events or Earnings Reports?
No, RSI is not reliable during high-impact news because it is a lagging momentum indicator, which means it gets calculated based on historical price data. The high impact event, earnings announcement, central bank decision, or economic report are future events which RSI can’t measure.
Hence, such major news causes prices to move sharply due to new information instead of normal buying and selling momentum. In such situations, RSI often produces readings that can be misleading.
Our Backtesting Result with RSI
We, at Strike Money, backtested a simple RSI reversal strategy to determine whether RSI crossing back above 30 or below 70 creates a profitable trading setup.
Backtest Setup
| Backtest Parameter | Details |
| Market | NSE-listed large and mid-cap stocks |
| Timeframe | Daily chart |
| Long Entry | RSI crosses above 30 after being below 30 |
| Short Entry | RSI crosses below 70 after being above 70 |
| Stop-Loss | Previous candle low (buy) / high (sell) |
| Target 1 | 1:1.5 Risk-Reward |
| Target 2 | 1:2 Risk-Reward |
| Confirmation Used | RSI crossover only |
| Total Trades Tested | 200 |
Backtest Logic
The strategy followed four fixed rules:
- Wait for RSI to move into an extreme zone (below 30 or above 70).
- Enter when RSI crosses back above 30 or below 70.
- Place stop-loss at the previous candle high/low.
- Exit at either 1:1.5 or 1:2 risk-reward target.
Backtest Result Summary
| Metric | 1:1.5 RR | 1:2 RR |
| Total Trades | 200 | 200 |
| Winning Trades | 118 | 93 |
| Losing Trades | 82 | 107 |
| Win Rate | 59% | 46.5% |
| Average Return per Trade | Higher | Lower |
| Best Result | Better Consistency | Larger Winners |
The RSI strategy performed better with a 1:1.5 risk-reward target than a 1:2 target. While the 1:2 target produced larger winning trades, many setups failed before reaching the extended target, resulting in a lower win rate.
Key Findings
- RSI cross above 30 worked better than buying simply because RSI was below 30.
- RSI cross below 70 worked better than selling simply because RSI was above 70.
- The 1:1.5 risk-reward target produced a higher win rate and more consistent results.
- Strong trending markets generated the highest number of false RSI signals.
- Combining RSI with price action and support/resistance improved performance significantly.
Which Stock Screener You Should Use for RSI Buy/Sell Signals?
There are a bunch of different softwares like Strike Money, Chartink, Screener that helps you to filter out or screen the stocks based on different RSI values. However, I found Strike Money platform best to screen stocks for RSI buy/sell signals because it allows you to scan signals among different indices, stocks within indices, FnO stocks, your personal watchlist and all the stocks.
What Indicator should I Pair with RSI?
There are four best indicators that you can pair with RSI to improve the signal reliability. The indicators are moving averages, volume, MACD, and bollinger bands.
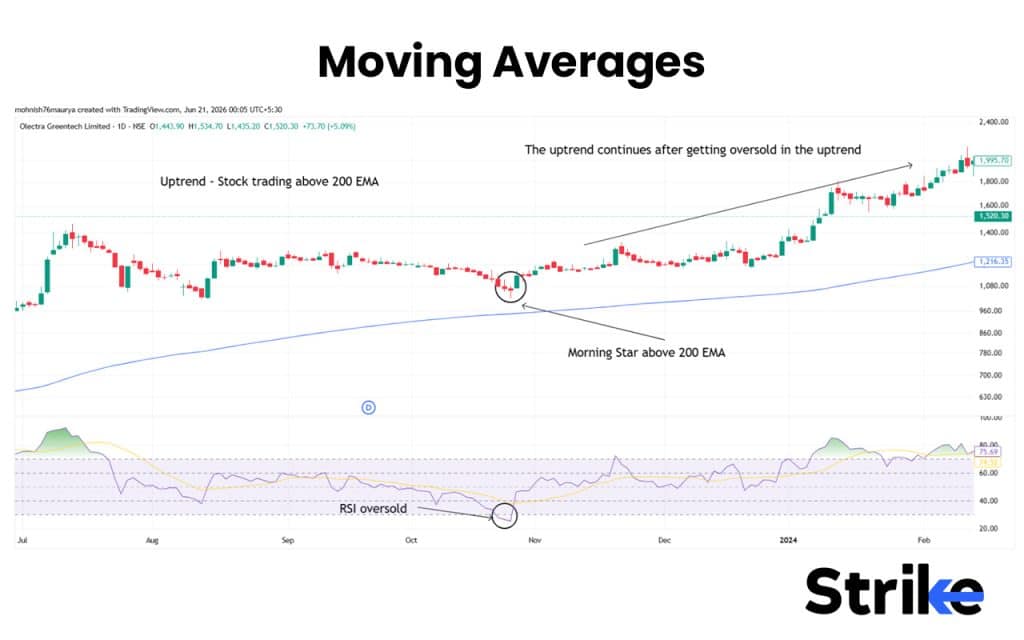
- Moving Averages: Moving average will help you to identify the trend of the market so that you can avoid trading against the trend and trade in the direction of trend. A trend is considered to be bullish if the price is trading above the moving average. Similarly, a trend is considered to be bearish when the price trades below moving average. In an uptrend look for buying opportunity if price gets oversold, and in downtrend look for a selling opportunity if price gets overbought.
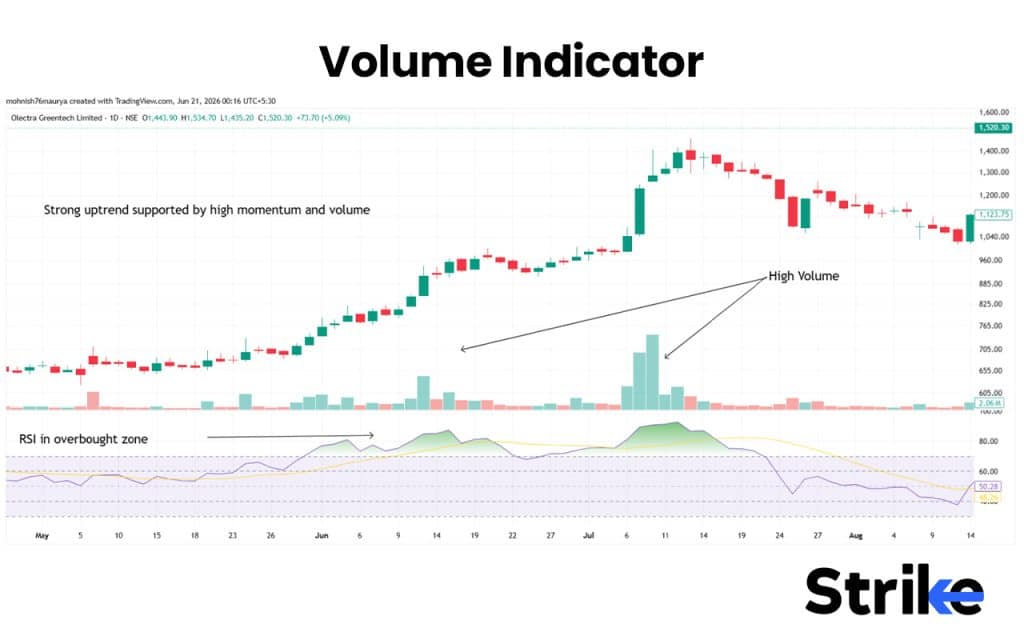
- Volume Indicator: Volume indicator helps to validate the momentum is supported by strong participants or not. A price move on RSI showing overbought and oversold combined with a volume spike carries a lot more weight than the same RSI reading on thin, quiet volume, since volume confirms genuine participation rather than a low-liquidity wiggle.
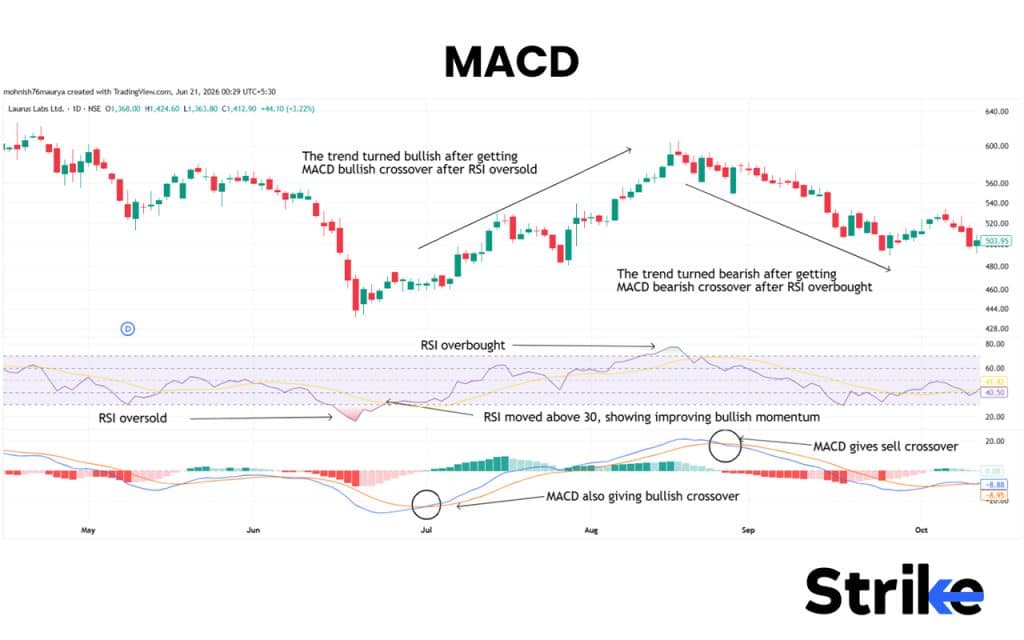
- MACD: Moving Averages Convergence and Divergence (MACD) is also a momentum indicator but it works by giving bullish and bearish crossovers. When both the indicators agree at the same point, it increases the signal reliability. For instance, if RSI is gaining bullish momentum from an oversold zone and MACD also gives bullish crossover, the signal becomes strong.
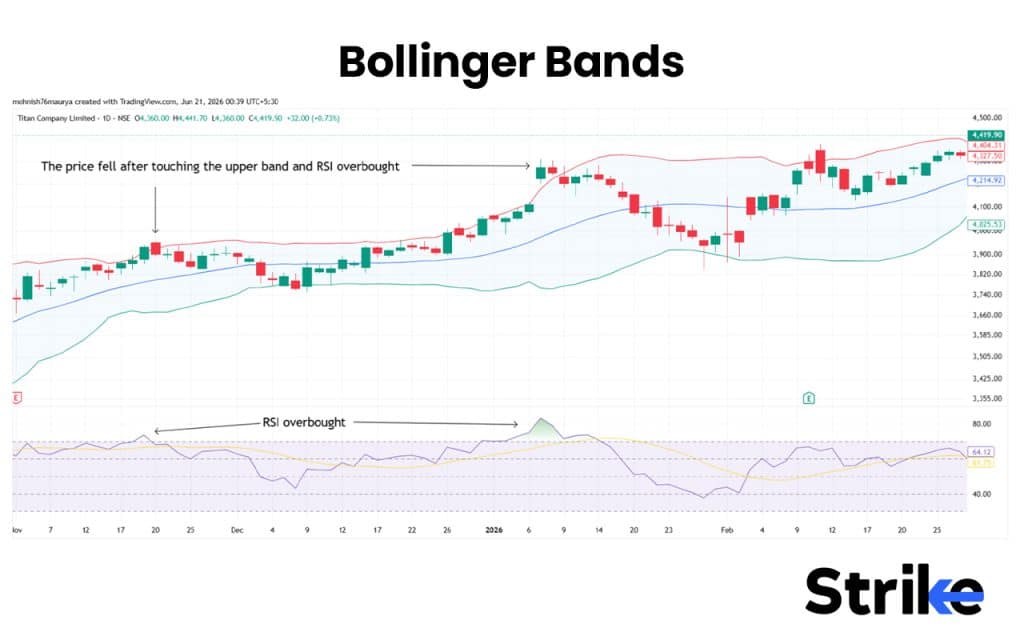
- Bollinger Bands: If price touches the lower band of bollinger bands along with RSI below 30, it suggests a potential bottom formation and a bullish trend reversal. Similarly, if price touches the upper band of bollinger band along with RSI overbought, it suggests a potential top formation and bearish trend reversal. It is important to confirm these signals through a reversal pattern.
These indicators will tell you the reason behind the change in the momentum of RSI and can give you better clarity to make decisions.
Is RSI a Leading or Lagging Indicator?
Primary RSI is considered as a leading indicator, but it also has some characteristics of lagging indicator. RSI is considered a leading indicator because it signals a potential trend reversal before it happens, in the form of divergence or change in polarity. Whereas, it also has some lagging maturity, because RSI calculates its value from historical price data, which is a core consideration when studying Leading vs Lagging Indicators. So, traders using RSI for crossover or waiting for confirmation signals may find RSI serves as a lagging indicator within the spectrum of Leading vs Lagging Indicators.
Can RSI and MACD be used together?
Yes, a RSI and MACD can be used together and it’s one of the more popular combinations in technical analysis, because both the indicators measure momentum in different ways, which means their agreement tends to mean more than either one alone. RSI tells you the momentum of the market, whether it is bullish or bearish, while MACD tells you whether the trend is gaining or losing momentum.
There are four major ways a trades combine RSI and MACD for trading which are briefly discussed below.
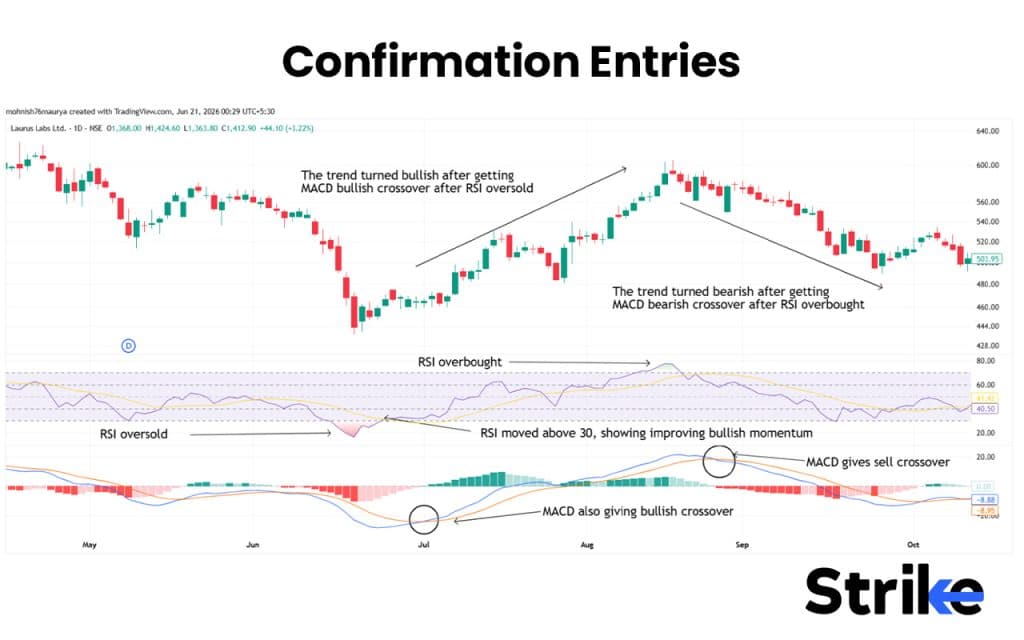
Confirmation Entries: Enter a trade only when both indicators agree. For example, RSI below 30 with a bullish MACD crossover strengthens a buy signal, while RSI above 70 with a bearish MACD crossover strengthens a sell signal.
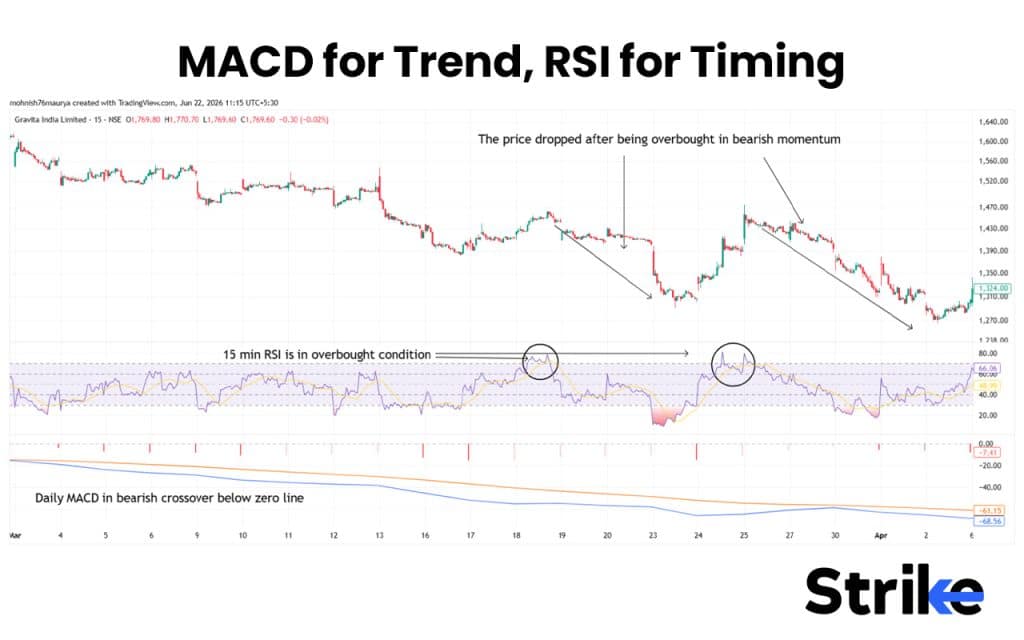
MACD for Trend, RSI for Timing: Use MACD above the zero line to confirm an uptrend and take only RSI oversold buy signals. Use MACD below zero to confirm a downtrend and take only RSI overbought sell signals.
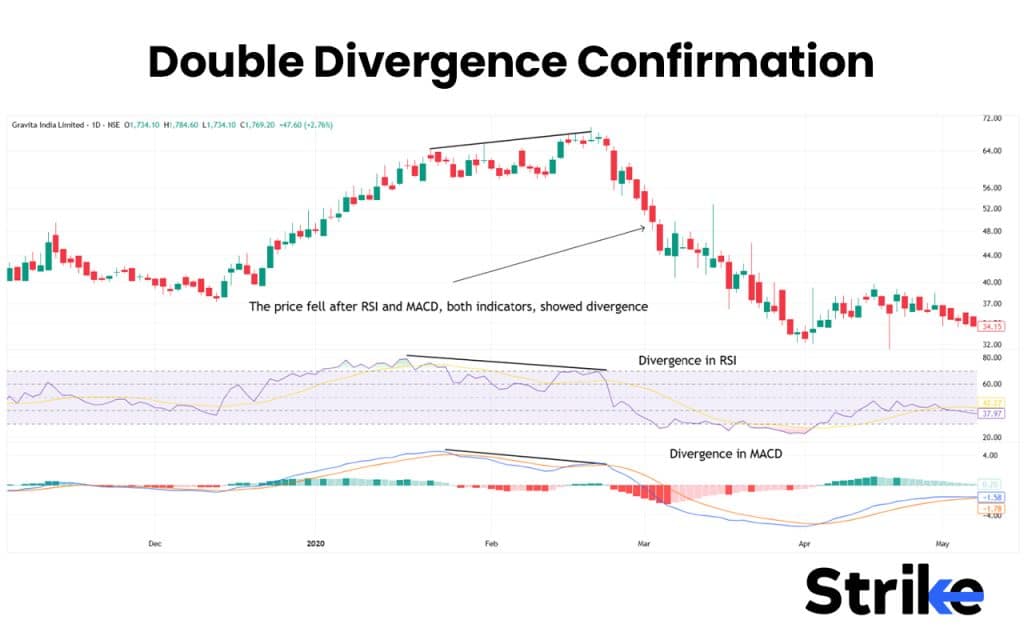
Double Divergence Confirmation: When the divergence is confirmed by both indicators is generally more reliable than divergence on either indicator alone.
A 2022 arXiv study by Pat Tong Chio tested MACD strategies on Dow Jones, Nasdaq, and S&P 500 stocks and found standalone MACD had a win rate under 50%, but combining it with RSI improved the win rate. The actual numbers: MACD+RSI produced win rates of 84%, 86%, and 78% across the three indices, with a better Sharpe ratio than other indicator combinations tested.
Is Stochastic better than RSI?
Neither of them are objectively better because they both calculate momentum in different ways and perform differently in different market conditions. The key difference between RSI and Stochastic is discussed below in the table.
Stochastic works better to identify short-term reversals, range-bound or sideways markets, finding precise entry and exit points, and faster signals due to higher sensitivity. Whereas, RSI works better for trend-following strategies, measuring trend strength, identifying bullish and bearish momentum, and avoiding excessive noise.
Stochastic frequent trading signals lead to more false signals, especially in volatile conditions. To reduce such false signals, many traders use this indicator in combination, where RSI tells the strength of the trend and stochastic tells when to enter.
Conclusion: Does RSI Enable You with More Benefits, Less Limitations?
Yes, RSI does provide more benefits than limitations because of its versatile use. It can be used differently in different market conditions. Whether the market is trending or sideways, traders can use RSI accordingly. This helps traders measure momentum, identify potential reversals, and improve trade timings. Also, RSI works best when combined with price action and other technical indicators.
However, RSI is not a guaranteed tool. It does have a limitation, which are briefly discussed below in the table.
| Benefits | Limitations |
| Measures momentum effectively | Can give false signals |
| Identifies overbought and oversold conditions | May stay overbought or oversold for long periods |
| Detects bullish and bearish divergences | Less reliable when used alone |
| Works across multiple timeframes and markets | Requires confirmation from other tools |
RSI is one of the most reliable technical indicators when used with proper market context and risk management.

 5 mins