
All Analytical Tools
Explore different Analytical tools
Explore All Features
Professional-grade tools built to analyze market movements and trading opportunities in real time
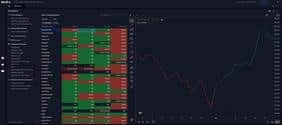

Advanced Scanners
Filter stocks using price, volume, technical indicators, and patterns. Returns setups that match defined conditions without manual chart checks.
Explore Advanced scanners →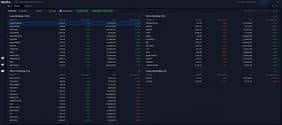

Futures & Options
Access open interest, volume, and long-short data across indices and stocks. Helps read position buildup and derivative activity.
Explore Futures & Options →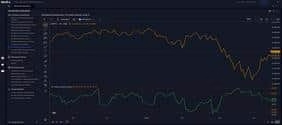

Sentiment Indicators
Analyse market positioning using breadth data, derivatives activity, and momentum signals across stocks and indices.
Explore Sentiment Indicators →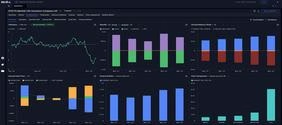

Stocks & Indices
View price trends, financial data, and technical indicators together. Compare performance across timeframes and track index movement.
Explore Stocks & Indices →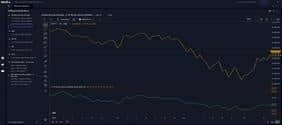

Diffusion Indicators
Measure percentage of stocks aligned with trend or momentum signals. Shows whether market moves have broad participation.
Explore Diffusion Indicators →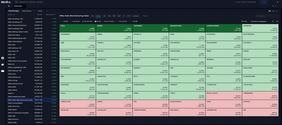

Interactive Heatmaps
Visualise sector and stock movement using percentage change and market cap weight. Highlights where gains or declines are concentrated.
Explore Interactive Heatmaps →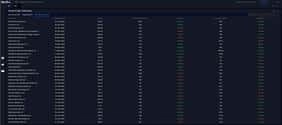

IPO Tracker
Track upcoming and active IPOs with issue dates, price bands, lot sizes, and subscription data across investor categories.
Explore IPO Tracker →

Bulletin Board
View news, announcements, corporate actions, and deal activity together. Helps link market events with price movement.
Explore Bulletin Board →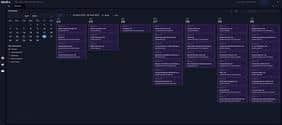

Market Calendar
Track earnings, IPOs, and economic events by date. Useful for planning trades around scheduled market triggers.
Explore Market Calendar →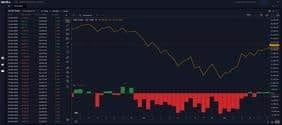

FII DII Data
Track institutional buying and selling across cash and derivatives segments. Shows changes in exposure by FIIs and DIIs.
Explore FII DII Data →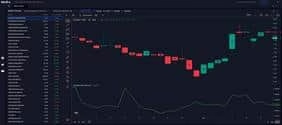

Ratio Charts
Compare stocks or sectors using price ratios. Helps identify relative strength and shifts in outperformance over time.
Explore Ratio Charts →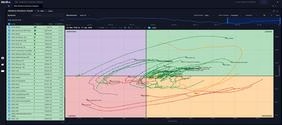

RRG
Plots relative strength and momentum against each other; shows clockwise rotation between leading, weakening, lagging, and improving quadrants.
Explore RRG →Frequently Asked Questions
Strike Money is a powerful stock analysis tool designed to provide investors with real-time market insights, advanced charting capabilities, and data-driven recommendations. It helps traders make informed decisions by offering technical indicators, trend analysis, and data-driven stock predictions. Whether you’re a beginner or an experienced investor, Strike Money simplifies the analysis process by presenting complex financial data in an easy-to-understand format.
Strike Money offers a freemium model, meaning users can access basic stock analysis features without any cost, while premium features require a subscription. The free version typically includes essential tools such as real-time stock prices, fundamental data, and basic charting options. However, advanced functionalities like custom indicators, in-depth financial analysis, and exclusive screeners are often reserved for paid subscribers.
A stock analysis tool is a digital platform that helps investors evaluate stocks using financial data, technical indicators, and market trends. These tools provide insights into stock performance, helping traders and investors make informed decisions. Stock analysis tools typically include features like price charts, earnings reports, fundamental ratios, and stock screeners to filter potential investment opportunities.
Stock analysis tools enable investors to make data-driven decisions by providing comprehensive market insights and analytical features. Instead of manually sifting through financial statements and stock charts, these tools automate the process and present key metrics in a structured format. This allows traders to identify potential investments, assess risks, and track market trends efficiently.
Selecting the right stock analysis tool depends on your trading style, budget, and feature requirements. For fundamental investors, platforms offering detailed financial reports, earnings analysis, and valuation metrics are ideal. Technical traders, on the other hand, should look for tools with advanced charting, technical indicators, and AI-driven trend predictions.
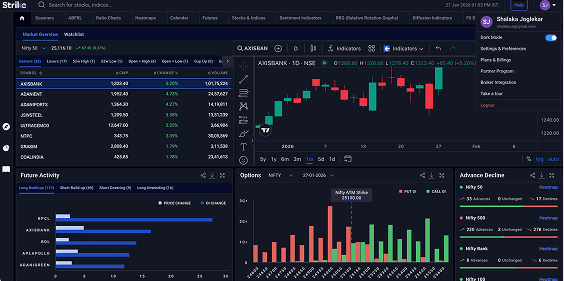
When it comes to selecting the best stock analysis website, Strike Money stands out as an innovative, all-in-one platform designed for both beginner and experienced investors. Unlike traditional stock research websites that overwhelm users with excessive data, Strike Money simplifies the process by providing data-driven insights, real-time market analysis, and easy-to-use financial tools. With its intuitive dashboard, traders can access technical indicators, fundamental stock analysis, and predictive models to stay ahead of market trends.
What Our Traders Say

Mr. Ayush
5.0
Working Professional


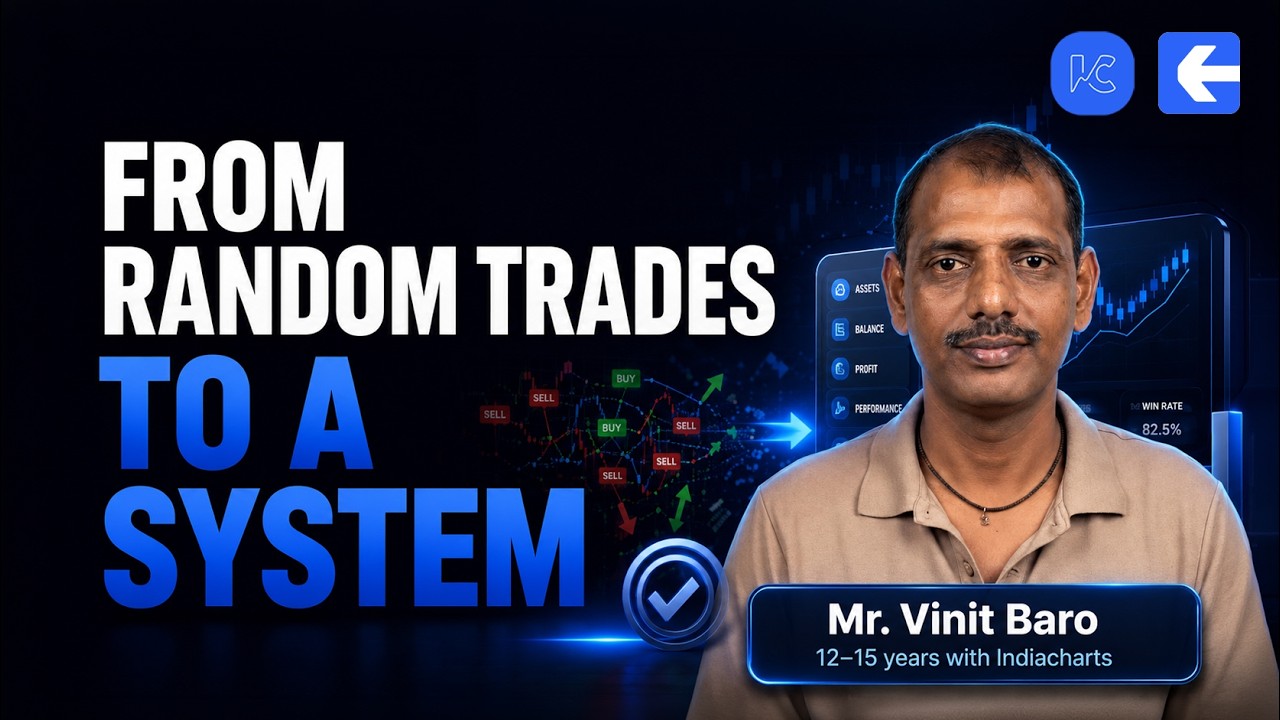
Vinit Baro
5.0
Working Professional

Nitin Prajapati
5.0
Working Professional


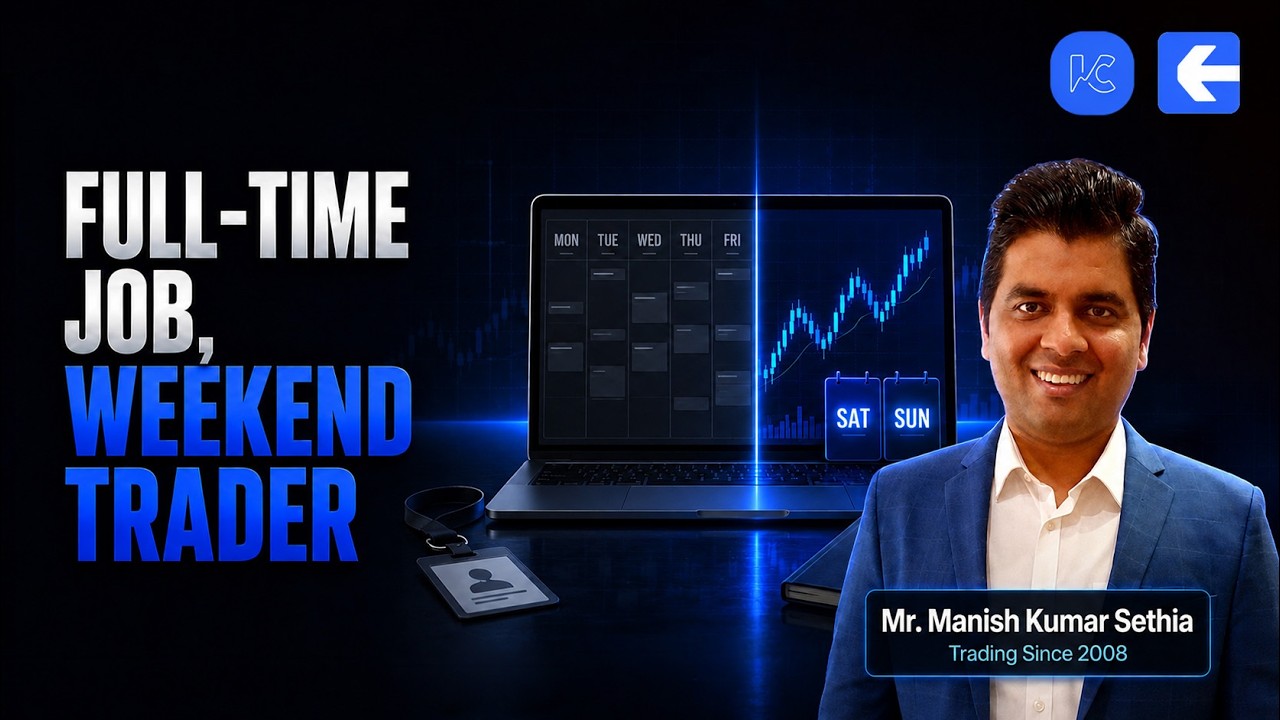
Manish Setia
5.0
Investor
Why Traders Love Our Scanners

Save Hours of Manual Research
Instead of manually analyzing hundreds of stocks, let our scanners do the heavy lifting. Focus your time on making trading decisions, not finding opportunities.

Never Miss High-Probability Setups
Real-time alerts ensure you're notified the moment a stock matches your criteria. Be among the first to act on breakouts and momentum shifts.

Trade Your Edge, Your Way
Whether you're a momentum trader, value investor, or technical analyst, customize scans to match your exact trading methodology.

Validated and Proven Strategies
Our pre-built scans are designed by professional traders with decades of experience. Test and refine with historical backtesting.
Strike
PROFESSIONAL TRADING PLATFORM
Join thousands of traders worldwide
Join 50K+ traders receiving our exclusive newsletter with market analysis, trading strategies, and actionable insights.

Expert insights on market trends and opportunities
Proven techniques from professional traders
Comprehensive beginner to advanced trading guide
Be the first to read our latest articles
"Strike's newsletter completely transformed my trading approach. The insights are invaluable!"
— Amit Sharma, Active Trader50K+
Active Traders
$2.5B+
Trading Volume
150+
Markets Covered
24/7
Support Available