The Moving Average Convergence Divergence indicator is a momentum oscillator primarily used to trade trends. The Moving Average Convergence Divergence is used to understand the momentum and its directional strength by calculating the difference between two time period intervals, which are a collection of historical time series.
Here is a detailed video analysis on MACD indicator.
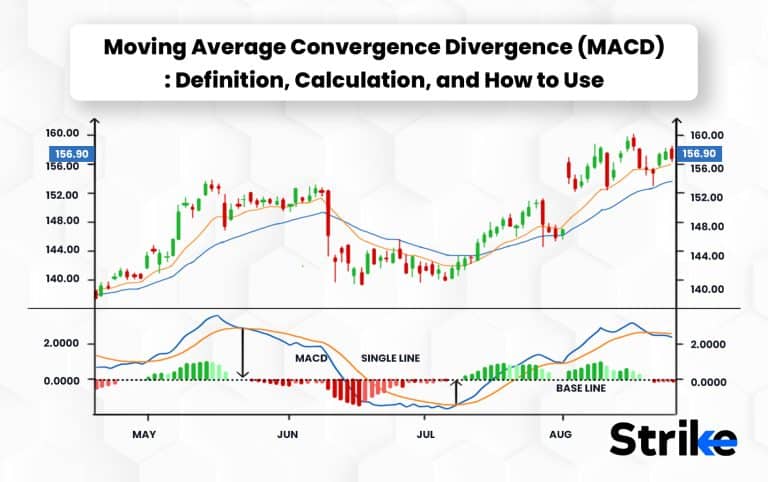
The Moving Average Convergence Divergence is made up of three general components, the MACD line, which is the difference between two moving averages (A moving average (MA) is a stock indicator commonly used in technical analysis.), a signal line which is a moving average of the MACD line and a histogram. The calculation involves deducting the mid-term moving average from the short-term moving averages.
The histogram in The Moving Average Convergence Divergence is a horizontal oscillator divided into two parts by a baseline or zero line. It is a visual cheat sheet that shows when the MACD line is above or below the signal line.
When the Moving Average Convergence Divergence line (the faster moving average) is above the signal line, the bars in the histogram are above the zero line, which is a bullish signal.
When the Moving Average Convergence Divergence line is below the signal line, the histogram bars are below the zero line, which is generally bearish.
Avoid taking any positions when the trend weakens and price fluctuates in a range between support and resistance levels, the Moving Average Convergence Divergence line will cross the signal line frequently in a back-and-forth manner. The Moving Average Convergence Divergence indicator measures the convergence and divergence of two moving averages. The mid-term moving average is subtracted from the short-term moving averages to determine the correct value.
: Definition, Calculation, and How to Use 141")
What is Moving Average Convergence Divergence (MACD)?
The Moving Average Convergence Divergence oscillator (MACD) is one of the simplest and most effective momentum indicators available. As its name depicts, the MACD is all about the convergence and divergence of the two moving averages.
Convergence happens when the moving averages move towards each other and the Divergence happens when the moving averages move away from each other.
The MACD line moves above and below the zero line, which is also known as the centerline. Zero line is an essential area where the index or stock is likely trading sideways or has no trend.
: Definition, Calculation, and How to Use 142")
The MACD indicator is made up of three components
- The MACD line, which measures the distance between two moving averages
- The signal line, which identifies changes in price momentum and acts as a trigger for buy and sell signals
- The histogram, which represents the difference between the MACD and the signal line
When determining the MACD, only two lines are taken for calculation, the MACD line and the signal line.
The Moving Average Convergence Divergence line is created by subtracting the 26-period moving average from the 12-period moving average.
The signal line is the 9-period moving average of the MACD. The Moving Average Convergence Divergence is then shown as a histogram, a graphical representation of the distance between the two lines.
The MACD goes through the signal line from below means traders will use it as a buy signal and if it goes through the signal line from above, traders will use it as a sell signal. The Moving Average Convergence Divergence indicator is so widely used because it is both easy to understand and highly reliable. The Moving Average Convergence Divergence not only determines whether a trend is up or down, but also shows strong buy and sell signals. The Moving Average Convergence Divergence indicator is popular because it provides an up-to-date representation of what is happening in the market.
: Definition, Calculation, and How to Use 143")
The graph given above is a classical example of the Moving Average Convergence Divergence(12,26,9). It is a daily chart of BANKNIFTY.
What is MACD Divergence?
When Moving Average Convergence Divergence makes highs or lows that exceed the corresponding highs and lows on the price, it is called the divergence.
A bullish divergence appears when the Moving Average Convergence Divergence creates two rising lows that correspond with two falling lows on the price. This is a valid bullish signal when the long-term trend is still positive.
When Moving Average Convergence Divergence creates a series of two falling highs that correspond with two rising highs on the price, a bearish divergence will be formed. A bearish divergence that appears during a long-term bearish trend is considered confirmation that the trend is not changing.
: Definition, Calculation, and How to Use 144")
Moving Average Convergence Divergence is when the price moves in one direction and the Moving Average Convergence Divergence moves in the opposite direction. Given below is an example of The Moving Average Convergence Divergence of the stock of NIFTY INDEX.
What are MACD Crossovers?
The Moving Average Convergence Divergence has two lines (the MACD line and the Signal line), as well as the zero line. The crossing over of these causes many crossover trends in the Moving Average Convergence Divergence this phenomena is called MACD Crossover. The Moving Average Convergence Divergence crossovers are commonly used trend indicators but are not good momentum indicators.
: Definition, Calculation, and How to Use 145")
When the “MACD Line” moves up and crosses over the “Signal Line,” it signals a bullish crossover and when the “MACD Line” declines and moves below the “Signal Line,” it signals a bearish crossover. Crossovers can endure a few days or a few weeks Depending on the power of the move.
The graph given below of XMR (Monero) is an example of Moving Average Convergence Divergence singleline Crossover.
Centerline crossover patterns are similar to signal line crossover patterns except that they involve only the Moving Average Convergence and Divergence line and its relationship to the zero/centre line.
How does Moving Average Convergence Divergence (MACD) work in Technical Analysis?
The Moving Average Convergence Divergence is widely used by all sorts of traders for its simplicity and flexibility. The Moving Average Convergence Divergence is used as a trend or momentum indicator and signal opportunities to enter and exit positions. The Moving Average Convergence Divergence triggers technical signals when the MACD line crosses above the signal line (to buy) or falls below it (to sell).
(MACD) Moving Average Convergence Divergence is calculated by subtracting the 26-period Exponential Moving Average (EMA) from the 12-period EMA. The Moving Average Convergence Divergence indicator is special because it brings together momentum and trend in one indicator. This unique blend of trend and momentum is applied to daily to monthly charts. (MACD) The Moving Average Convergence Divergence helps to analyze the market momentum and trends to minimize losses.
: Definition, Calculation, and How to Use 146")
Moving Average Convergence Divergence is based on two exponential moving averages of closing price with different period lengths. MACD measures how close or far the two moving averages are and what is the tendency in their distance – whether they are coming close to each other (convergence) or moving further away from one another (divergence). MACD is popularly used by traders because it signals the strength of a trend and the turning point of a trend.
How does the length of the MACD period affect its effectiveness in Technical Analysis?
The Moving Average Convergence Divergence (MACD) indicator is a commonly used technical analysis tool that helps to analyze the relationship between two exponential moving averages (EMAs) and identifies changes in their momentum. The effectiveness of the MACD is influenced by the length of the periods used in its calculation.
Shorter periods such as 12 and 26 in the Moving Average Convergence Divergence calculation will react more quickly to recent price movements and will provide more frequent signals, but these signals are less reliable.
Longer periods like 50 or 200 in the MACD calculation will produce a smoother line that captures longer-term trends, but will be slower to react to changes in the market.
Shorter periods will be more suitable for shorter-term traders who want to capture smaller price movements, while longer periods will be more suited for longer-term traders who want to capture bigger trends. Longer periods produce fewer signals, but they will be more reliable and have fewer false signals compared to shorter periods.
What is the purpose of MACD?
The Moving Average Convergence Divergence is a trend-following momentum indicator that measures the relationship between two moving averages of a security’s price. The investors use the Moving Average Convergence Divergence to identify when bullish or bearish momentum of a stock is high to identify entry and exit points for trades.
The ultimate purpose of the MACD is to provide insights into the momentum and direction of a particular asset’s price movement. The MACD is a straightforward indicator that is easy to understand and implement in technical analysis. The versatile nature of the Moving Average Convergence Divergence can help the indicator to be used across different timeframes and for various financial instruments, including stocks, commodities, currencies, and cryptocurrencies.
How to calculate MACD?
The Moving Average Convergence Divergence is calculated by subtracting the 26-period (7.5%) Exponential Moving Average from the 12-period (15%) moving average. Here are step-by-step instructions for calculating the Moving Average Convergence Divergence (MACD) indicator.
1. First, calculate the 26-period exponential moving average (EMA) of the closing price.
2. Next, calculate the 12-period EMA of the closing price.
3. Then, subtract the 12-period EMA from the 26-period EMA to obtain the MACD line. This represents the difference between the short-term and long-term moving averages.
4. After that, calculate the 9-period EMA of the MACD line itself. This yields the Signal line.
5. Finally, subtract the Signal line from the MACD line to generate the MACD histogram. The histogram shows the difference between the MACD line and its Signal line.
6. If the MACD line is above the Signal line, the histogram will be positive. If the MACD line is below the Signal line, the histogram will be negative.
7. The crossover of the MACD line and Signal line can provide trade signals. A crossover below the zero line can indicate a downtrend, while a crossover above can signal an uptrend.
Compute the longer and shorter EMAs, subtract to get the MACD line, take the EMA of that MACD line to get the Signal line, then take the difference between the MACD and Signal lines to get the MACD histogram. This shows momentum.
Though this remains a mathematical and theoretical subject. All the systems in today’s era of capital markets provide automatically generated MACD’s for the choice of script.
What does MACD 12, 26, 9 mean?
The 12 from the Moving Average Convergence Divergence represents a moving average of the previous 12 bars.
The 26 represents a moving average of the previous 26 bars.
The 9 represents a moving average of the difference between the two moving averages 12 and 26 above.
The 12 and 26 day EMAs are used to construct the MACD lines. MACD is calculated as the difference between the values of these two EMAs.
A signal line is the 9 day EMA of the MACD. MACD = EMA (Price, 12 period) – EMA (Price, 26 period). The 12-period Exponential Moving Average represents the shorter-term trend, the 26-period Exponential Moving Average represents the longer-term trend, and the 9-period EMA represents the signal line.
The 12, 26, and 9 values for MACD’s arguments are the most commonly used, but traders can adjust these values based on their preferences and trading strategies. They are thus the default setting of the indicator when it is applied on any script’s chart.
How to use MACD in Trading?
MACD has three parameters that are used to generate a view on the direction of the script.
The first parameter is the MACD LINE; this line is calculated by subtracting the value of 26 EMA to 12 EMA. The MACD line keeps oscillating between the zero line of the indicator. When the values of both the EMA’s become the same at the particular candle closing, the value of the MACD becomes 0. When 12 EMA is above 26 EMA, the value of MACD is positive and vice versa for the negative MACD. The second parameter is the SIGNAL LINE; this line is achieved when we apply 9 EMA to the MACD line itself.
The third parameter is the MACD HISTOGRAM; histogram is obtained by the subtraction of MACD SIGNAL line from MACD Line. It represents the separation between the MACD line and the MACD signal line. Histogram also keeps oscillating between the zero line of the indicator.
When this histogram is below the zero line, it shows that the MACD is below the MACD signal line. The color of the histogram bars depends upon the rising or falling histogram.
If the value of histogram is lower than the previous bar, the color will be represented in red. Vice versa for the green coloured histograms.
: Definition, Calculation, and How to Use 147")
This is the chart of any script; in this case. BankNifty looks like when a MACD indicator is applied on the chart.
The boxes represent the potential crossover that is generating potential trading opportunities in the script.
Let’s dive into the understanding of the functionalities below. Strike.money is one of the scanners that provide a list of stocks that are showing the MACD line crossing above or below the MACD signal line. This way, the trader’s time for selecting stocks is reduced drastically and thus they will be able to analyze the list of stocks as per other criteria before executing the trade. The image uploaded below scans the list of stocks in which the MACD line crosses over the MACD signal line.
There are 4 ways in short how traders use the MACD indicator in trading.
1. When the MACD line crosses over with the MACD signal line.
The MACD line crosses above the MACD signal line gives a bullish sign.
The MACD line crosses below the MACD signal line gives a bearish sign.
: Definition, Calculation, and How to Use 148")
The stocks are sorted based on the current live market MACD and MACD Signal line buy crossover. The black box signals the potential buy crossover.
The drop down menu offers the list of stocks that are generating sell crossover on the MACD indicator.
2. When the MACD line intersects or crosses over or below the Zero Line.
If the MACD line crosses above the 0 line, it gives a bullish sign.
If the MACD line crosses below the 0 line, it gives a bearish sign.
3. When the MACD Histogram crosses over or below the Zero Line.
If the MACD histogram crosses above the 0 line, it gives a bullish sign.
If the MACD histogram crosses below the 0 line, it gives a bearish sign.
4. When the Divergence with the Price scenario is observed.
If the divergence happens between the MACD line and the price.
If the divergence happens between the MACD Histogram and the price.
What are different ways to use MACD to identify potential buy and sell signals?
The Moving Average Convergence Divergence (MACD) is a popular technical analysis indicator used in trading to identify potential buy and sell signals. Below are four different ways to use it.
- Signal Line Crossovers
It generates a bullish signal indicating a potential buy opportunity when the MACD line crosses above the signal line also it generates a bearish signal indicating a potential sell opportunity when the MACD line crosses below the signal line.
Investors wait for the crossover to occur and then enter a trade in the direction of the crossover.
- Centerline Crossovers
It generates a bullish signal indicating a potential buy opportunity when the MACD line crosses above the centerline (zero line) from below similarly it generates a bearish signal indicating a potential sell opportunity when the MACD line crosses below the centerline from above.
The centerline Crossovers method focuses on the MACD line’s position relative to the centerline to determine the trading bias.
: Definition, Calculation, and How to Use 149")
- Divergence
It suggests a potential bullish reversal and a possible buy signal when the price makes a lower low, but the MACD indicator makes a higher low and It suggests a potential bearish reversal and a possible sell signal when the price makes a higher high, but the MACD indicator makes a lower high. Divergences provide early signals of a potential trend reversal.
: Definition, Calculation, and How to Use 150")
Strike.money is one of the scanners that provide a list of stocks that are showing the Divergences in the oscillator indicator; in this case, MACD. This way, the trader’s time for selecting stocks is reduced drastically and thus they will be able to analyze the list of stocks as per other criteria before executing the trade. The image uploaded above scans the list of stocks in which the Positive and Negative Divergences are sorted and displayed under the divergence scanner of the strike.money.
- Zero Line Rejection
It indicates a potential buy signal as it suggests a rejection of the bearish momentum when the MACD line briefly dips below the zero line and then quickly bounces back above it and it indicates a potential sell signal as it suggests a rejection of the bullish momentum when the MACD line briefly moves above the zero line and then quickly falls back below it.
Combine Moving Average Convergence Divergence signals with other technical analysis tools and indicators to confirm potential buy and sell signals before making trading decisions. Also consider factors such as market sentiments, market conditions, psychology of market participants, trend analysis, and risk management strategies to enhance your trading approach.
How do traders use the MACD histogram to identify trends?
Investors use the Moving Average Convergence Divergence (MACD) histogram as a tool to identify trends and potential trading opportunities in financial markets. The histogram’s bars plotted from the Moving Average Convergence Divergence provide visual ideas about the strength and direction of the trend.
- Positive Histogram
It indicates that the MACD line is above the signal line when the histogram bars are above the zero line, suggesting bullish momentum. Higher the bar in the histogram stronger the trend is.
- Negative Histogram
It indicates that the MACD line is below the signal line when the histogram bars are below the zero line, suggesting bearish momentum. Similar to positive bars, the height of the negative bars represents the strength of the trend.
- Zero Line Crossover
When the histogram crosses above the zero line, it suggests a potential bullish trend reversal, indicating a shift from bearish to bullish momentum similarly when the histogram crosses below the zero line, it suggests a potential bearish trend reversal.
: Definition, Calculation, and How to Use 151")
- Divergence
Investors also observe for divergences between the price chart and the MACD histogram. When the price is making higher highs while the MACD histogram is making lower highs, it indicates weakening trend or trend reversal.
: Definition, Calculation, and How to Use 152")
- Convergence
When the histogram bars are narrowing and approaching the zero line, it indicates a potential convergence, this suggests a potential trend reversal.
: Definition, Calculation, and How to Use 153")
Moving Average Convergence Divergence is an important tool among many used by traders to identify trends. Traders often combine it with other technical indicators, such as moving averages, support and resistance levels, and volume analysis to get better results or predictions of the market.
How does MACD perform in a Bullish Market?
When the Moving Average Convergence Divergence (MACD) line crosses from below to above the signal line, the indicator is considered bullish. The further below the zero line the stronger the signal for the trend of a bullish market. In a bullish market, where prices are rising, the MACD can provide traders with useful signals and predictions. when the MACD line crosses above the signal line. In a bullish market, this bullish crossover can indicate a potential buying opportunity known as the Bullish Signal Line Crossovers.
In a bullish market, the MACD histogram is generally above the zero line and consists of positive bars. The height and width of the positive bars can provide information about the strength of the upward momentum. If the MACD line remains above the signal line and the histogram consistently shows positive bars, it indicates that the bullish momentum is intact. Divergences can still occur and provide valuable insights. Traders should pay attention to any potential bearish divergences between the price chart and the MACD histogram.
: Definition, Calculation, and How to Use 154")
How does MACD perform in a Bearish Market?
When the Moving Average Convergence Divergence line crosses from above to below the signal line, the indicator is considered bearish. The further above the zero line the stronger the signal for the trend of a Bearish Market. In a bearish market, where prices are generally declining, the MACD can provide traders with useful signals and predictions. One of the primary signals generated by the MACD is when the MACD line crosses below the signal line. In a bearish market, this bearish crossover can indicate a potential selling opportunity, this is known as the Bearish Signal Line Crossovers.
The MACD histogram is generally below the zero line and consists of negative bars that indicate a Bearish Market. The height and width of the negative bars can provide information about the strength of the downward momentum. Larger the bar the stronger the trend is. If the MACD line remains below the signal line and the histogram consistently shows negative bars, it indicates that the bearish momentum is intact. Divergences can still occur; traders should pay attention to any potential bullish divergences between the price chart and the MACD histogram.
What is the best trading strategy for MACD?
The best trading strategy for Moving Average Convergence Divergence is subjective and thus it depends on the style of trading, psychology of market participants and ofcourse the present market conditions.
MACD signals do provide robust signals but they can be sufficient only during trending markets. MACD works better on Daily and Higher time frames. Thus, Scalpers and Day traders are sometimes trapped in trappy and volatile situations.
If the MACD histogram crosses the moving average upwards, it signals a long opportunity. If the MACD histogram crosses the moving average downwards, it signals a short opportunity.
When the Moving Average Convergence Divergence crosses from below the zero line, it is considered a bullish signal. If it crosses from above the zero line, it is considered a bearish signal by traders.
When to use Moving Average Convergence Divergence (MACD)?
The MACD is most useful when there is a trend underway that you want to trade in the direction of. When prices are trending higher, watch for the MACD line to crossover above the signal line and turn positive. This suggests upside momentum is building and provides a buy signal to trade the uptrend. Conversely, when prices are in a downtrend, a crossover below the signal line and MACD turning negative hints downside momentum is accelerating. This crossover can trigger a sell signal.
Additionally, the widening or narrowing of the MACD histogram provides clues on momentum. If upside momentum is increasing, the histogram will expand. When downside momentum slows, histogram bars shrink. So MACD helps identify and confirm the dominant trend direction and time entries based on momentum. During range-bound non-trending markets, MACD has less value and may whipsaw on false signals. MACD is best applied when trading with the momentum of established trends.
How can MACD be utilised with other Indicators to improve trading performance?
One effective approach is to combine MACD with trend-following indicators like moving averages to trade in the direction of the overall trend. For example, traders may look to only take MACD buy signals if the price is above the 50-day moving average, showing an established uptrend. Using the indicators together increases the confluences and edge of a probability about the bet.
Momentum oscillators like the RSI can also help confirm overbought or oversold conditions. If the RSI is above 70, traders may wait for it to drop before acting on a MACD buy signal. This helps avoid buying right at exhausted highs.
Additionally, watch for MACD and Bollinger Band squeeze set-ups, when the MACD histogram contracts as Bollinger Bands tighten. These conditions often precede sharp volatility expansion. Combining the indicators provides advanced warning.
What are the advantages of MACD?
The Moving Average Convergence Divergence (MACD) indicator is widely used by traders due to its diverse opportunities it generates and effectiveness in signaling momentum and trend changes. Here are 6 key advantages of using the MACD.
1. Identifies Trend Changes: MACD crossovers alert traders to changes from bullish to bearish market momentum and back again. This helps identify trend reversals early.
2. Confirms Price Action: MACD divergence from price action can confirm or contradict signals from candlestick patterns or support/resistance. The combination validates signals.
3. Measures Momentum: The widening and narrowing MACD histogram reflects strengthening and weakening upside/downside momentum respectively. This shows acceleration or exhaustion.
4. Diverse functions: Multiple indications within the single indicator.
Besides these main advantages, the MACD can be applied on all the types of capital markets.
With its straightforward setup, intuitive signals, and flexibility across assets and time frames, MACD is one of the most popular and useful indicators for traders in technical analysis.
What are the disadvantages of MACD?
While the Moving Average Convergence Divergence indicator is widely used and has proven to be very helpful in technical analysis, it also has certain disadvantages. Here are five drawbacks to consider.
1. Lagging Indicator: The MACD is based on moving averages, which are lagging indicators. Signals occur after the start of a trend, missing early entries.
2. False Signals: MACD can give false signals in choppy or ranging markets, leading to losing trades if acted on prematurely. More confirmation may be needed.
3. Overbought/Oversold Levels: MACD does not identify overbought or oversold levels in a range like RSI or Stochastics. Other indicators are needed for this.
4. Signal Line Crossovers: The MACD line and signal line will inevitably cross back and forth multiple times, making timing entries difficult. Not every crossover results in a sustained trend.
5. Subjective Interpretation: Settings like the MACD periods can be tweaked, affecting signals. Traders may interpret MACD histograms or crossovers differently. Confirmation reduces subjectivity.
While MACD is a very useful indicator, traders should be aware of these disadvantages. Using MACD together with other indicators helps overcome some limitations and improves analysis.
Does a crossover between the MACD line and signal line indicate a potential buy or sell signal?
Yes, crossovers between the MACD line and signal line may work as a tool to generate potential trade signals. When the MACD line crosses above the signal line, it reflects potential upside momentum and the sustainment of the trend. Vice versa, if the MACD line crosses below the signal line, it reflects potential downside momentum and the start of it. It could suggest to exit an existing long potential or entering a short position.
Is the MACD indicator more effective in trending markets than in ranging markets?
Yes, The Moving Average Convergence Divergence indicator is generally considered more effective in trending markets compared to ranging markets. In trending markets, where prices are consistently moving in an uptrend or downtrend, the MACD can provide proper signals. In an uptrend, the MACD line stays above the signal line, signaling bullish momentum.
Can MACD be used to predict market trends?
Yes, MACD can be applied on the price chart to identify potential momentum shifts. It also generates false signals though, but when combined with other indicators, it may act as a useful tool to take trades in trendy markets.
Is MACD based on Moving Averages?
Yes, MACD is based on moving averages. It subtracts the 26-period exponential moving average (EMA) from the 12-period EMA to create the MACD line. A 9-period EMA of the MACD line forms the signal line.
What is the difference between MACD and RSI?
MACD and RSI are both momentum indicators but have different ways of measuring and identifying momentum. They provide different information that can be complementary in analysis. MACD is a trend-following indicator while RSI is a momentum oscillator indicator.
MACD uses moving averages and convergences/divergences to identify shifts in momentum. RSI uses a single line bounded by upper and lower levels.
MACD plots the relationship between two EMAs. RSI plots the current price relative to recent price highs and lows. MACD is better for identifying trend direction while RSI helps determine overbought/oversold levels. Traders often use them together for analysis.
MACD and RSI are both momentum oscillators used by traders extensively in their analysis but they differ in method of measuring and identifying momentum. MACD is a trend following oscillator white RSI is a momentum oscillator indicator. RSI consists of a single line that has an overbought and oversold levels whereas MACD uses moving averages and convergences or divergences to identify potential trend reversals. RSI reflects the current price relative to the recent highs and lows whereas MACD reflects the difference and relationship between the EMAs. Traders use them in combination to have a better understanding of the current state of the markets.
What is the difference between MACD and Moving Averages?
The Moving Average Convergence Divergence and Moving Averages are both technical analysis tools used to analyze price trends, but they are calculated differently and their purpose is also different. The four key differences are listed below.
- Purpose
The Moving Average Convergence Divergence focuses on the relationship between two moving averages and their convergence or divergence. Meanwhile Moving Averages are used to smooth out price data and identify the average price over a specific period.
- Calculation
The MACD is calculated by subtracting the longer-term exponential moving average (EMA) from the shorter-term EMA. Moving averages are calculated by taking the average of the closing prices over a specific period.
- Focus
The Moving Averages focuses on the convergence and divergence of two moving averages, highlighting changes in momentum and potential trend reversals. Moving averages provide a smoothed line that helps identify the direction and strength of a trend.
- Interpretation
Crossovers and divergences between the MACD line and the signal line are often used as buy or sell signals. In moving averages traders look for the interaction between price and moving averages. When price crosses above a moving average, it can signal a potential uptrend, while a cross below a moving average suggest a potential downtrend
Both the MACD and Moving Averages are tools for analyzing trends, the MACD specifically focuses on the relationship between two moving averages. Moving averages, on the other hand, provide a smoothed line to identify the direction and strength of the trend and generate correct Signals regarding trend Reversal.


 Previous Article


![15 Investing.com Alternatives [Free+Paid] You Should Use in 2026](https://www.strike.money/wp-content/uploads/2026/04/Investing.com-Alternatives.jpg "15 Investing.com Alternatives [Free+Paid] You Should Use in 2026 172")
![15 TradeStation Alternatives [Free+Paid] You Should Use in 2026](https://www.strike.money/wp-content/uploads/2026/04/TradeStation-Alternatives.jpg "15 TradeStation Alternatives [Free+Paid] You Should Use in 2026 173")
![15 Chartink Alternatives [Free+Paid] You Should Use in 2026](https://www.strike.money/wp-content/uploads/2026/04/Chartlink-Alternatives.jpg "15 Chartink Alternatives [Free+Paid] You Should Use in 2026 174")
: Overview, 10 Types of Indicators, Settings for Different Markets 176")

 : Definition, Formula, calculation, Uses, Advantages Vs limitations 178")


No Comments Yet.