Ladder Option Strategy involves creating multiple strike price levels resembling a ladder’s rungs to achieve specific risk-reward profiles. Ladder Option Strategy combines three options at different strike prices to capitalize on directional price movements while limiting risk.
Originating in the 1980s among professional floor traders, this strategy gained popularity in India after the introduction of options trading on NSE in 2001.
What is a Ladder?
Ladder Option Strategy creates a sequence of option positions at incrementally spaced strike prices resembling a ladder. Ladder Option Strategy combines three options with different strike prices to achieve specific directional exposure while managing risk.
The strategy typically involves buying one option and selling two others at progressively higher (or lower) strike prices, creating multiple profit zones and break-even points.
Fundamentally, a ladder represents a modified version of a vertical spread with an additional short option leg added to generate income or reduce cost. Traders implement ladders to express sophisticated market views that standard strategies cannot accommodate. The arrangement of strikes creates unique risk-reward profiles suitable for specific market expectations.
Trading ladders requires understanding the relationship between price movement, time decay, and implied volatility. Strike selection proves critical, as the distance between strikes determines both potential profit and maximum risk. Professional traders often establish ladders when expecting modest directional moves without significant volatility expansion.
How Does a Ladder Work?
Ladder Option Strategy combines three option contracts at different strike prices to create a structured risk-reward profile. Ladder Option Strategy functions by establishing price levels where profit potential changes dramatically, allowing traders to benefit from specific price movements while limiting losses elsewhere.
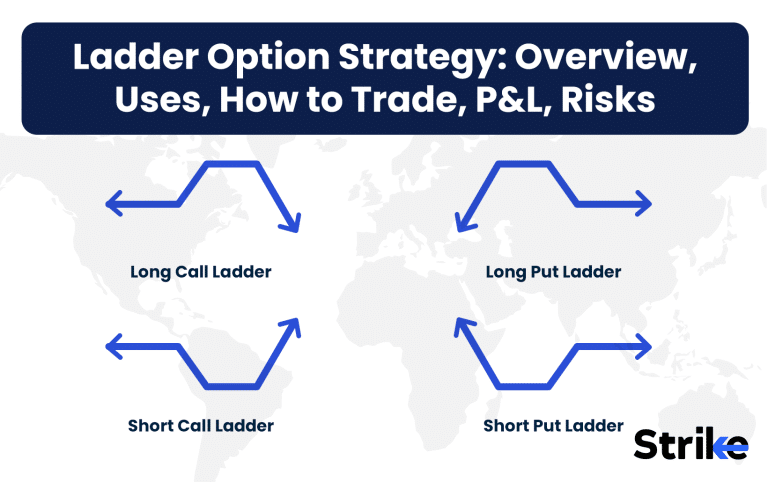
There are four types of ladder – bull call ladder, bear call ladder, bear put ladder and bull put ladder.
Bull Call Ladder
Bull Call Ladder strategy capitalizes on moderately bullish market movements while generating income through additional short calls. This strategy combines one purchased ATM call with two short calls at progressively higher strikes, creating a unique risk-reward profile. Traders establish the position by buying one ATM call, selling one OTM call, and selling another call at an even higher strike.

Consider an example using Kotak Mahindra Bank trading at ₹1,560. Purchase a ₹1,560 call for ₹42, sell a ₹1,600 call for ₹22, and sell a ₹1,640 call for ₹9. This results in a net debit of ₹11 (₹42-₹22-₹9). Maximum profit reaches ₹29 (₹1,600-₹1,560-₹11) if Kotak closes at ₹1,600 at expiration. Above ₹1,600, profits decline until reaching the upper breakeven at ₹1,629. Beyond this point, losses increase without limit due to the naked short call.
The Bull Call Ladder offers an affordable initial cost with significant profit potential if the stock rises moderately. Maximum loss equals the initial debit (₹11 in this example) if the stock remains below the lowest strike. The strategy becomes profitable when the stock rises above ₹1,571 (lowest strike plus net debit).
Traders often implement this strategy on stocks like IndusInd Bank or Bajaj Finance following a period of consolidation. The optimal scenario occurs when the underlying asset rises gradually toward the middle strike without surpassing the highest strike before expiration.
Bear Call Ladder
Bear Call Ladder strategy profits from moderately bearish market conditions while providing unlimited upside potential if prices drop significantly. This strategy involves selling one ATM call, buying one OTM call, and buying another call at an even higher strike price. Traders initiate the position with a net debit, creating a risk-defined bearish position with unique characteristics.

Examine an implementation using SBI currently trading at ₹680. Sell a ₹680 call for ₹25, buy a ₹700 call for ₹15, and buy a ₹720 call for ₹8. This creates a net debit of ₹2 (₹15+₹8-₹25). Maximum profit equals ₹18 (difference between first two strikes minus net debit) if SBI closes exactly at ₹700 at expiration. The position makes money between ₹682 (ATM strike plus net debit) and ₹720, with maximum loss limited to ₹2 if SBI remains below ₹680.
The strategy provides protection against the naked short call risk through the purchased OTM calls. Unlike a simple bear call spread, the second long call creates potential for additional profits if the underlying drops substantially below the ATM strike.
This makes the Bear Call Ladder particularly effective during periods of expected volatility or uncertainty.
Derivative traders frequently deploy this strategy on stocks like Tata Motors or Adani Ports following strong rallies that appear overextended. The position benefits from time decay when the underlying remains between the lower strikes.
Multiple profit zones make this strategy attractive for traders with a specific price outlook within a defined range.
Bear Put Ladder
Bear Put Ladder maximizes returns during moderate price declines while reducing the cost of establishing a bearish position. This strategy combines one purchased ATM put with two short puts at progressively lower strikes, creating a position that profits from downside movement without requiring significant bearish momentum. Implementation involves buying one ATM put, selling one OTM put, and selling another put at an even lower strike.

Implement this strategy on L&T Infotech trading at ₹5,800. Buy a ₹5,800 put for ₹180, sell a ₹5,700 put for ₹120, and sell a ₹5,600 put for ₹70. This creates a net credit of ₹10 (₹120+₹70-₹180). Maximum profit reaches ₹110 (difference between first two strikes plus net credit) if L&T Infotech closes exactly at ₹5,700 at expiration. The strategy remains profitable between ₹5,590 and ₹5,810, with maximum loss occurring if the stock drops below ₹5,600.
The Bear Put Ladder offers attractive risk-reward characteristics for traders expecting a modest decline. Unlike a simple bear put spread, this strategy provides potential net credit entry while maintaining significant profit potential.
The risk concentrates at prices below the lowest strike, where losses can mount rapidly due to the naked short put.
Traders commonly use this strategy on pharmaceutical stocks like Sun Pharma or Aurobindo Pharma ahead of expected regulatory decisions. The position benefits from gradual price deterioration toward the middle strike price.
Careful selection of strike prices proves essential to balancing profit potential against maximum risk exposure.
Bull Put Ladder
Bull Put Ladder generates immediate income while maintaining significant profit potential during bullish market movements. This strategy combines one short ATM put with two long puts at progressively lower strikes, creating a position that benefits from upward price movement while providing downside protection. Implementation involves selling one ATM put, buying one OTM put, and buying another put at an even lower strike.

Apply this strategy to Infosys trading at ₹1,480. Sell a ₹1,480 put for ₹35, buy a ₹1,460 put for ₹25, and buy a ₹1,440 put for ₹15. This establishes a net credit of ₹5 (₹35-₹25-₹15). Maximum profit equals this ₹5 credit, realized if Infosys closes above ₹1,480 at expiration.
The position maintains profitability until Infosys reaches ₹1,465 (ATM strike minus net credit). Maximum loss occurs around the middle strike (₹1,460), limited to ₹15 (difference between first two strikes minus net credit).
The strategy provides unlimited profit potential below the lowest strike, distinguishing it from traditional bull put spreads. This creates an interesting payoff structure where extreme downside moves actually become profitable due to the additional long put.
The position works well for traders anticipating either mild strength or significant weakness, but wanting protection against moderate declines.
The position benefits from time decay when the underlying remains above the short strike. The dual profit zones make this strategy particularly suitable for volatile markets where direction appears uncertain but range bound movement seems unlikely.
Why Use a Ladder Strategy?
Ladder strategies offer asymmetric risk-reward profiles unattainable through standard option spreads or single-leg positions. Traders employ ladders to capitalize on specific price movements while controlling risk exposure through strategic placement of multiple option legs. The structure creates unique profit zones that align precisely with anticipated market behavior.
Ladders provide flexibility across various market conditions, functioning effectively during trending, range bound, or breakout scenarios depending on specific configuration.
Proper implementation generates income through premium collection while maintaining defined risk parameters. Certain ladder variations benefit significantly from implied volatility spikes, particularly those incorporating long option legs at extreme strikes.
Strategic advantages include reduced cost basis compared to simple vertical spreads, enhanced income generation capabilities, and customizable risk profiles.
Ladders particularly suit sophisticated retail traders seeking advanced alternatives to basic option strategies. The structure accommodates both offensive and defensive market approaches through appropriate strike selection.
Market professionals favor ladders during transitional market phases when directional conviction exists but uncertainty surrounds magnitude.
The combination of long and short legs creates natural protection against adverse movements while maintaining significant profit potential in favorable scenarios.
When to Use a Ladder?
Ladder strategies perform optimally during periods of moderate directional bias rather than extreme trending environments. Traders implement ladders following substantial price movements when expecting consolidation or continued trend at a slower pace.

The strategy performs exceptionally well when price action shows steady momentum without violent swings.
Market conditions preceding major scheduled events present ideal ladder opportunities. Earnings announcements, economic data releases, and monetary policy decisions create environments where partial volatility pricing makes ladder structures particularly valuable.
Medium implied volatility environments provide the optimal backdrop for ladder strategies. Excessively low volatility limits premium collection potential, while extremely high volatility makes short option legs prohibitively risky.
The sweet spot occurs when implied volatility registers in the 40-60th percentile of its historical range for the underlying asset.
Technical patterns including flag formations, shallow pullbacks, and consolidation zones signal appropriate ladder entry points. Stocks like Asian Paints or Mindspace REIT display characteristics particularly suited for ladder implementations during such patterns.
Sectors undergoing gradual sectoral rotation also provide fertile ground for ladder strategies.
Examination of options chain data reveals optimal ladder opportunities when skew appears moderate and term structure appears normal. Indian indices frequently present ideal ladder conditions during mid-contract cycles approximately 15-25 days before expiration.
This timeframe balances premium collection with favorable time decay characteristics across all legs.
How Option Greeks Affect Ladder?
Delta relationships fundamentally drive ladder strategy performance through asymmetric exposure across multiple strike prices. Each ladder leg contributes distinct delta characteristics, creating net directional exposure that changes dynamically as price moves between strikes.
Bull ladders maintain positive net delta while bear ladders exhibit negative net delta, both fluctuating significantly at transition points.
Theta works favorably in credit ladder variations, generating consistent positive returns as time passes without adverse price movement.
Calendar-adjusted ladders exploit time decay differentials between near and far-dated expiries. Traders structure ladders to maximize theta collection during periods of market indecision, particularly in popular names like Reliance Industries or ICICI Bank.
Vega exposure usually registers negative in traditional ladder configurations due to multiple short option legs. Rising implied volatility therefore typically hurts ladder positions, making entry timing crucial relative to volatility cycles.
Gamma presents significant challenges in ladder management, creating amplified sensitivity to price changes near critical strike levels. Large gamma exposure occurs particularly around middle strikes where position dynamics shift dramatically. Ladders become vulnerable to whipsaw price action when gamma exposure concentrates at specific price points.
Effective ladder management requires continuous monitoring of evolving greek exposures. Position adjustments become necessary when delta or vega exposures exceed predetermined thresholds.
How Implied Volatility Affects Ladder?
Implied volatility conditions critically influence ladder strategy performance at every stage from entry to exit. Lower implied volatility environments provide ideal entry points for net credit ladder variations by reducing the cost of purchased options while maintaining a decent premium on sold legs.
Strategic implementation in low-volatility stocks like Nestle India or TCS enhances probability of successful outcomes.
Rising implied volatility following ladder entry typically hurts overall position value due to the predominance of short option legs in most configurations.
Volatility expansion damages credit ladders particularly severely, potentially erasing anticipated profits before directional movement materializes.
High implied volatility environments create hazardous conditions for writing OTM legs due to elevated tail risk. Premium collection appears attractive but carries disproportionate risk of significant losses. Options on midcap banking stocks like Federal Bank or RBL Bank demonstrate this risk profile during volatile market periods.
Implied volatility crush after scheduled events benefits debit ladder structures substantially. Purchasing options before events at lower implied volatility levels while selling options with elevated volatility premiums creates advantageous position dynamics.
Volatility skew between strikes affects ladder pricing dramatically, requiring careful analysis of relative option values before entry. Positive skew environments favor bearish ladder variations while negative skew conditions enhance bullish ladder profitability. Effective traders continuously monitor skew changes to identify opportune adjustment points throughout the position lifecycle.
How to Trade using Ladder?
To trade using a ladder strategy, you first need to decide the market direction. In this example, we are looking at a mildly bullish view, which makes NTPC a suitable candidate for a Bull Call Ladder strategy.
We select NTPC with the current monthly expiry in mind. The strike prices are chosen around the spot price, with one At-The-Money (ATM) call bought and two Out-Of-The-Money (OTM) calls sold at equal intervals, creating an equidistant ladder.

This structure is known as a Bull Call Ladder or a Broken Wing Call Butterfly. The position benefits from mild bullish movement, and since expiry is just 10 days away, the price needs to remain within a specific range to stay profitable. Volatility can rise, but the position won’t face much risk unless a strong one-sided move occurs.

If NTPC starts to move sharply upward, the position may need adjustments. In the deployed trade, one call option at the ₹345 strike is bought for ₹6.00, and calls at ₹355 and ₹365 are sold for ₹2.50 and ₹1.20 respectively.
The total net premium paid is ₹2.30 per unit, which translates to ₹3,450 for a lot size of 1500. This is the maximum loss in the trade. The maximum profit is achieved if NTPC expires at ₹355, the first short call strike.
At expiry, if the spot is ₹355, the ₹345 call would be worth ₹10 while both the ₹355 and ₹365 calls expire worthless. The net payoff would be ₹10 minus the ₹2.30 premium, or ₹7.70 per unit, resulting in a total profit of ₹11,550.

The lower breakeven point is calculated as the strike of the long call plus the net debit, which is ₹345 + ₹2.30 = ₹347.30, rounded to ₹347.5. Since this is an equidistant ladder, we use a standard formula for the upper breakeven.
The highest strike in this trade is ₹365, and the maximum profit per unit is ₹7.70. Therefore, the upper breakeven is ₹365 + ₹7.70 = ₹372.70.
If the ladder had unequal spacing between the strike prices, we would use a general formula. This formula is: Upper Breakeven = S2 + [ ( S1 – L) – Net Debit ], where L is the strike of the long call, S1 is the strike of the first short call, and S2 is the strike of the second short call.
What is the Maximum Profit & Loss, Breakeven on a Ladder?
Ladder strategies exhibit distinct profit-loss characteristics defined by specific mathematical relationships between strikes and premiums.
Maximum profit in bull call ladders occurs when price settles precisely at the middle strike at expiration, calculating as the difference between lower strikes minus net debit (or plus net credit). Bear put ladders follow similar principles with maximum profit at middle strike equal to difference between upper strikes minus net debit.
Maximum loss varies significantly between ladder variations. Credit ladders typically limit losses to net debit paid, occurring when price remains below lowest strike (bull structures) or above highest strike (bear structures). Debit ladders feature more complex loss profiles with worst outcomes occurring at middle strikes or beyond furthest sold strikes.
Breakeven points appear at multiple price levels in ladder structures. Primary breakeven occurs at lowest strike plus net debit for bull call ladders or highest strike minus net debit for bear put ladders. Secondary break even points emerge beyond sold option strikes, calculating through formulas incorporating all strike differences and net position cost.
What are the Risks of Ladder?
Ladder strategies harbor significant risks despite their sophisticated structure and apparent advantages.
Limited but complex risk profiles create deceptive impressions of safety while masking substantial exposure under certain conditions. Unexpected price movements near short option strikes generate disproportionate losses relative to surrounding price levels.
Concentrated risk zones develop particularly around middle strikes where payoff characteristics change dramatically. Price settlement in these zones frequently results in maximum possible losses.
Rising implied volatility damages most ladder variations substantially, particularly credit-oriented structures with multiple short option legs. Volatility expansion before directional movement materializes erodes theoretical edge, potentially creating losses despite correct directional forecasts.
Adjustment complexity represents a significant operational risk unique to multi-leg strategies like ladders. Making proper adjustments requires sophisticated understanding of options mechanics and precise execution capabilities. Retail traders often struggle with timely adjustments due to platform limitations or knowledge gaps.
Transaction costs impact ladder profitability substantially through multiple commission charges and wider bid-ask spreads across multiple legs. Slippage during entry and exit further erodes profitability, particularly in less liquid underlying assets.
Early assignment risk exists for short option legs in American-style options, creating unexpected complications and potential hedge imbalances. While less common in Indian markets where index options follow European exercise, stock options remain vulnerable to early exercise, particularly when significant corporate actions occur.
Is Ladder Strategy Profitable?
Yes, ladder strategies demonstrate profitability when implemented with proper market timing and precise execution..
The strategy generates consistent returns when implemented on index options following breakouts from established ranges. traders achieve success through disciplined position sizing and strategic exits rather than holding until expiration.
Is Ladder Bullish or Bearish?
Ladder strategies assume bullish or bearish characteristics depending on specific configuration, with no inherent directional bias. Bull call ladders and bull put ladders express bullish market views through positive net delta exposure. Bear call ladders and bear put ladders establish bearish positioning through negative delta profiles.
Directional characteristics change dynamically as price moves between strikes, creating unique hybrid exposures. Advanced variations combine elements from multiple ladder types to create more nuanced directional positioning.
What are Alternatives to Ladder Strategy?
The main alternatives to Ladder Strategy are Vertical Spreads, Butterflies, Condors, Ratio Spreads, Backspreads, etc.
| Strategy | Risk Profile | Max Profit | Max Loss | Best Market Condition | Complexity |
| Vertical Spreads | Defined | Limited | Limited | Directional (Mild to Moderate) | Low |
| Butterflies | Defined | Limited | Limited | Range Bound | Medium |
| Condors | Defined | Limited | Limited | Range Bound (Wider Range) | Medium-High |
| Ratio Spreads | Unlimited | Limited | Unlimited | Directional with Volatility View | Medium |
| Backspreads | Limited | Unlimited | Limited | Expecting Large Moves | High |
Vertical spreads provide simpler execution for directional views on volatile names like IndusInd Bank. Condors work effectively on index options during consolidation phases, while backspreads prove valuable during potential market inflection points where significant movement appears likely.


 Previous Article


![15 Investing.com Alternatives [Free+Paid] You Should Use in 2026](https://www.strike.money/wp-content/uploads/2026/04/Investing.com-Alternatives.jpg "15 Investing.com Alternatives [Free+Paid] You Should Use in 2026 36")
![15 TradeStation Alternatives [Free+Paid] You Should Use in 2026](https://www.strike.money/wp-content/uploads/2026/04/TradeStation-Alternatives.jpg "15 TradeStation Alternatives [Free+Paid] You Should Use in 2026 37")
![15 Chartink Alternatives [Free+Paid] You Should Use in 2026](https://www.strike.money/wp-content/uploads/2026/04/Chartlink-Alternatives.jpg "15 Chartink Alternatives [Free+Paid] You Should Use in 2026 38")
: Overview, 10 Types of Indicators, Settings for Different Markets 39")


 : Definition, Formula, calculation, Uses, Advantages Vs limitations 42")


: How We Used This 70/30 Indicator in 6 High Win-rate Strategies 45")


No Comments Yet.