


 Editor
  Updated on 7 October 2025
Hikkake pattern is a candlestick setup that exposes false breakouts and traps traders on the wrong side of the move. Hikkake pattern works in both bullish and bearish markets by luring participants into premature entries before reversing sharply.
Hikkake pattern is formed through an inside bar followed by a false breakout and a reversal back into the range. The pattern reflects crowd psychology, fear, and forced exits, often leading to sharp momentum.
What is a Hikkake pattern?
A Hikkake pattern is a short-term price trap in candlestick charts that signals either continuation or reversal. Hikkake pattern occurs when traders act on a false breakout, only for prices to move in the opposite direction.

The word “Hikkake” comes from Japanese, meaning “trick” or “hook.” It was introduced by Daniel L. Chesler, CMT, in the early 2000s. This pattern gained attention for exposing false breakouts that often deceive retail traders.
A Hikkake appears when a small consolidation breaks out in one direction, attracting traders into new positions. Soon after, prices reverse sharply and trigger stop losses. This reversal builds momentum in the opposite direction.
The pattern works on both bullish and bearish setups. A bullish Hikkake starts with a false breakdown below support, followed by a rebound higher. A bearish Hikkake begins with a false breakout above resistance, followed by a sharp drop.
How does Hikkake pattern Candlestick Pattern Formed?
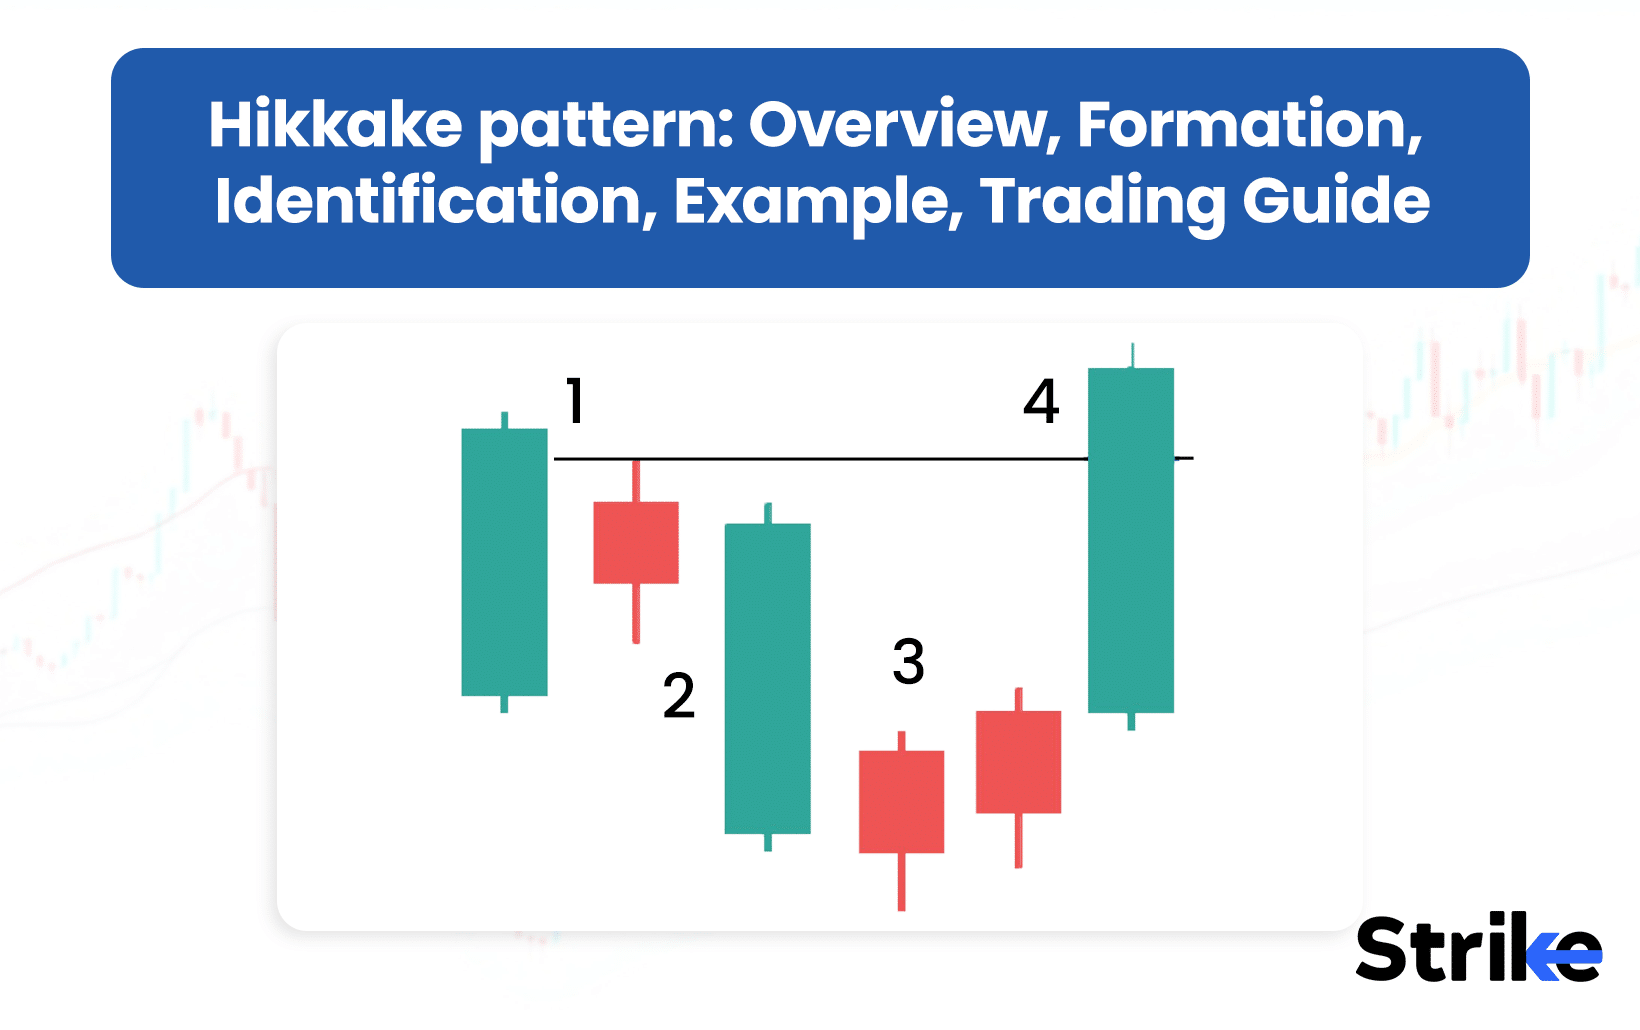
A Hikkake pattern forms when a false breakout traps traders and reverses price in the opposite direction. The setup starts with a small inside bar formation followed by a breakout.
The initial breakout looks genuine, triggering traders to enter trades. However, the breakout soon fails, and prices move against the breakout direction. This traps traders who entered early, forcing them to exit at a loss.
The psychology behind this is based on crowd behavior. When many traders react to the breakout, it creates short-term momentum. But once institutional traders push the price the other way, stop losses get triggered. This accelerates the reversal.
In a bullish Hikkake pattern, the market is in a downtrend but enters a phase of consolidation. During this stage, prices break below support levels, which lures sellers into short positions. However, the move quickly reverses upward, trapping those shorts. As a result, buyers step in with strength and push the trend higher.

In a bearish Hikkake pattern, the setup occurs within an existing uptrend that pauses into consolidation. Prices then break above resistance, attracting new buyers. Shortly afterward, the breakout fails and prices collapse, trapping those long positions. This failure strengthens sellers, who regain control and drive the trend lower.

The trapped side exits quickly, adding fuel to the move. This crowd effect creates sharp momentum and explains why Hikkake works.
Thus, the pattern is not only about candles but also trader psychology. It reflects fear, greed, and forced exits, all condensed into a few bars.
When do Hikkake pattern Candlestick Patterns occur?
Hikkake patterns occur during periods of consolidation, false breakouts, and short-term traps. They typically appear after a trend pause or at major support and resistance levels.
The pattern is most effective when markets are range-bound. A false breakout in such ranges often signals a strong move in the opposite direction. In trending markets, Hikkake patterns emerge as traps when traders anticipate breakouts that fail.
Timeframes matter in spotting Hikkake setups. Studies show they are common on daily and 4-hour charts. Shorter timeframes like 15-minute or 1-hour also display them, but reliability is lower due to noise. On higher timeframes like weekly charts, the pattern is rarer but more powerful.
Market context is crucial. A bullish Hikkake is stronger near oversold zones, while a bearish Hikkake is more reliable near overbought areas. Traders also track volume spikes to validate the setup.
Statistics from technical research suggest Hikkake patterns occur in about 8–10% of chart consolidations. Their success rate improves when aligned with trend direction.
For example, in Indian equities, Hikkake setups are often seen around quarterly result days or event-driven volatility. The market traps one side of traders before moving strongly the other way.
How to Identify a Hikkake pattern
The first step to identify a Hikkake pattern is to look for a consolidation phase with inside bars. Consolidation occurs when price movement shrinks after a trending move and multiple candles form within the range of a larger candle. This narrowing of range shows indecision between buyers and sellers.

Inside bars are the main clue. The high and low of the inside candle remain within the high and low of the previous candle. When this happens for one or two sessions, it sets the stage for a possible Hikkake setup. Traders monitor such sequences closely, because they signal pressure is building for a breakout. There are three Important aspects of consolidation.
- Tight Range: Price holds within the previous bar’s high and low.
- Low Volatility: Daily movement shrinks compared to earlier sessions.
- Pause in Trend: The market slows after an uptrend or downtrend.
This phase is crucial because without consolidation there is no Hikkake setup. The inside bar structure defines the “trap zone” where traders expect either a breakout or reversal. Correct recognition of this first step avoids confusion with random fluctuations.
Patience is critical here. Traders who rush to label any small candle as consolidation risk misidentifying the pattern. To reduce error, confirmation with multiple inside bars and supporting technical indicators such as ATR for volatility helps validate the setup.
In short, consolidation with clear inside bars is the foundation of a Hikkake pattern. Observing this stage correctly allows a trader to move confidently to the next step—spotting the false breakout.
Then identify a Hikkake pattern is to spot a false breakout from the consolidation zone. After inside bars form, price attempts to break out in one direction. This breakout looks convincing at first, but it quickly fails.
There are two types:
- Bullish Hikkake: Price breaks below support during a downtrend, luring sellers.
- Bearish Hikkake: Price breaks above resistance during an uptrend, attracting buyers.
The breakout often triggers stop-loss orders and draws new positions from traders expecting continuation. This is the “trap” part of the pattern. Those who enter at this stage are caught wrong-footed when price reverses. There are three key points for spotting a false breakout.
- Clear Breach: Price moves beyond consolidation range.
- No Follow-Through: Momentum fails after the breakout.
- Quick Reversal: Price re-enters the range within one to three sessions.
Traders must be careful to distinguish between real breakouts and false ones. Volume often provides a clue. If the breakout occurs on low or declining volume, the chance of failure rises. If the reversal back inside the range is sharp, it confirms that the initial breakout was false.
This step matters because without a failed breakout, the Hikkake does not exist. The trap creates the opportunity for a strong reversal move. Identifying this false breakout correctly sets up the final confirmation step where traders look for price moving decisively in the opposite direction.
What Does a Hikkake pattern Pattern Indicate?
A Hikkake pattern indicates a false breakout trap followed by a continuation or reversal move. It reflects how markets punish premature entries and reward patience.
For bullish Hikkake setups, the signal is that sellers are trapped. Price rebounds higher, showing buying pressure. For bearish Hikkake setups, buyers are trapped. Price collapses, showing selling pressure.
The main indication is market manipulation or smart money action. Institutional traders often use false breakouts to collect liquidity before moving price in their favor. The next movement after a Hikkake often shows sharp directional bias. Research indicates that price tends to move at least 1.5–2 times the range of the inside bar following confirmation.
It also indicates momentum shifts. A bullish Hikkake suggests strength entering the market, while a bearish Hikkake points to weakness. Another key signal is trader psychology. The pattern reveals that those trapped will rush to exit, fueling volatility. This panic exit adds further energy to the confirmed move.
Example of Hikkake pattern
A real-world example of a Hikkake pattern is seen in Infosys during January 2021. The stock displayed a bearish trap after a breakout attempt.

On January 13, 2021, Infosys formed an inside bar after a rally. The next session broke above the range, luring buyers into fresh long positions. The breakout appeared strong, supported by moderate volume.
However, on January 15, the stock reversed sharply. It closed back within the prior bar’s range and dropped further in the next two sessions. This reversal triggered stop losses for trapped buyers, fueling a downward move of nearly 6% in a week.
This bearish Hikkake showed classic features: an inside bar, a breakout, and then a failure. The move was supported by high selling volume, which confirmed institutional pressure.
In contrast, bullish Hikkake setups are seen when support breaks down falsely. For instance, Nifty Pharma in April 2022 displayed a false breakdown, only to rebound 8% in the following days.
These examples prove how powerful Hikkake setups are when combined with volume confirmation. Traders who waited for confirmation avoided false entries and profited from the trapped side’s panic.
How Reliable are Hikkake pattern Candlestick Patterns?
Hikkake patterns are moderately reliable with accuracy rates of 55–60%. Their reliability improves when combined with other indicators and trend context.
Research by Daniel Chesler, who introduced the pattern, found that average success rates improved significantly with volume confirmation. For bullish Hikkake setups, the probability of upward continuation is higher if the RSI shows oversold conditions.
On daily charts, the reliability improves compared to intraday charts. Studies on US equities showed bullish Hikkake patterns achieved about 62% success in trending markets. Bearish setups worked well in 58% of cases.
However, reliability drops in choppy sideways markets. Here, multiple false breakouts occur, creating noise. Traders use filters like moving averages or MACD to reduce whipsaws.
A 2020 research paper analyzing Japanese equities highlighted that combining Hikkake with Bollinger Bands improved predictive accuracy by almost 12%. This shows the importance of confirmation.
Thus, the Hikkake pattern is not foolproof but provides an edge when applied correctly. Traders who wait for confirmation and combine indicators achieve higher win rates.
How to Trade Using the Hikkake pattern
The Hikkake pattern is traded by first spotting the false breakout and then entering in the opposite direction of the initial move. Traders wait for the inside bar setup, followed by a breakout that appears convincing but fails within one to three sessions. Once price reverses back inside the consolidation range, the trade opportunity opens.
The entry point is straightforward. For a bullish Hikkake, the breakout occurs below support, but the reversal takes price higher. Traders place a buy order once the candle closes back within the range. For a bearish Hikkake, the breakout happens above resistance, but price quickly turns down. A sell order is placed once the reversal candle confirms the trap.
Stops are placed beyond the extreme of the false breakout candle. This protects against the risk of the breakout actually continuing instead of failing. Targets are usually set at the next support or resistance level, or using risk–reward ratios like 1:2. Traders also confirm signals with indicators such as RSI or moving averages to reduce false entries.
A good example appeared in State Bank of India (SBI) during February 2023.

The stock was consolidating around ₹520 after a prior decline. Price broke below support near ₹515, triggering short positions. Within two sessions, the move reversed sharply, and SBI closed back above ₹525, trapping the shorts. Traders who entered long around ₹526 with a stop-loss below ₹512 captured a rally that extended above ₹560 in the following weeks.
This setup showed the effectiveness of the bullish Hikkake when confirmed with strong volume and price action.
How to Combine Hikkake pattern with other Technical Indicators?
A Hikkake pattern is best traded when combined with volume, RSI, moving averages, and support-resistance levels. These filters increase reliability.
| Indicator | Condition | Interpretation / Trading Insight |
| Volume | Strong reversal volume during Hikkake | Confirms institutional activity; high buying volume in bullish setups signals strength. |
| RSI | Oversold in bullish setup; Overbought in bearish setup | Oversold RSI increases bullish success; overbought RSI reinforces bearish conviction. |
| Moving Averages | Setup aligns with major averages (50-day, 200-day) | A bullish Hikkake above the 200-day average has higher odds of continuation. |
| Support & Resistance | Pattern forms near key support or resistance | A bearish Hikkake at resistance or bullish Hikkake at support adds weight to the signal. |
Backtests show that combining the Hikkake pattern with RSI and moving averages improves accuracy by 8–10%. Incorporating volume filters adds another 5% reliability, while aligning trades with key support and resistance levels further enhances performance. These combinations create more robust and well-rounded strategies.
What are the Pros vs Cons of Using Hikkake pattern?
The Hikkake pattern offers clear advantages but also some limitations. Traders must weigh both before using it.
| Pros | Cons |
| Easy to identify with basic candlestick knowledge – The setup uses simple components like inside bars, breakouts, and reversals, making it straightforward to spot. | Moderate reliability (55–60%) – The pattern delivers mid-level success rates and is less reliable compared to stronger signals such as engulfing or star formations. |
| Works in both bullish and bearish markets – It applies in uptrends and downtrends, offering flexibility for traders across conditions. | False signals in sideways markets – Range-bound conditions produce frequent whipsaws, creating multiple false Hikkake setups. |
| Captures crowd psychology and traps – It reveals how traders are misled by false breakouts, allowing disciplined traders to profit from reversals. | Requires confirmation for accuracy – Without support from indicators like RSI, MACD, or volume, the risk of failure increases significantly. |
| Provides clear stop-loss levels – The extreme of the false breakout candle offers a natural, easy-to-define stop-loss placement. | Limited standalone predictive power – On its own, the Hikkake is not strong enough to forecast continuation or reversal reliably. |
| Suitable across multiple timeframes – It works on intraday, daily, and weekly charts, making it useful for both short-term and swing trading. | Works best with additional indicators – Its effectiveness improves only when combined with moving averages, trend filters, or support/resistance zones. |
| Sharp risk-reward setups possible – With entries near reversal points and defined stops, traders achieve favorable reward-to-risk ratios. | Low frequency on higher timeframes – On weekly or monthly charts, it appears rarely, limiting its use for long-term investors. |
Pros include simplicity and versatility. The setup uses only a few candles and works in any market. Traders like it for its ability to reveal traps.
Cons include moderate accuracy and dependency on confirmation. Without volume or trend filters, signals produce losses. The pattern also appears less often on higher timeframes.
Therefore, while the Hikkake pattern is powerful, it works best when integrated with broader technical strategies rather than used alone.


 Previous Article


![85 Common Stock Market Terminologies for Dummies [Updated List for 2025]](https://www.strike.money/wp-content/uploads/2025/04/Popular-Stock-Market-Terms-for-Beginners-Banner.png "85 Common Stock Market Terminologies for Dummies [Updated List for 2025] 28")


No Comments Yet.