


The Relative Strength Index (RSI) is a technical indicator used for determining overbought and oversold conditions for valuable assets. The RSI determines the potential selling and buying positions for investors by evaluating the average gains and losses of assets over a specific period of time (generally, this time is 14 days).
The gains for a particular asset are calculated by taking the difference between the current price and the previous price when the current price of the asset is higher than the previous price. The losses are calculated similarly just by taking the difference between the current price and the previous price when the current price is lower than the previous price. The average gains and losses are then used to calculate the Relative Strength of the assets, which is plugged into the formula to calculate the RSI.
J. Welles Wilder Jr. created the Relative Strength Index (RSI) in 1978. The Average True Range (ATR) and the Parabolic Stop and Reverse were both developed by mechanical expert Wilder, who later became a real estate investor and trader (SAR).
The RSI was created by Wilder as a momentum oscillator to aid investors and traders in determining when a commodity was overbought or oversold. The RSI was designed to be used in conjunction with other technical analysis tools like trend lines and moving averages.
The RSI was initially computed over a period of 14 days, but over time, analysts and traders have experimented with various time frames to determine the best period length for various assets. Some traders use shorter periods such as 9 or 10 days, while others use longer periods such as 21 or 30 days.
What is the Relative Strength Index?
The Relative Strength Index (RSI) is a tool that helps traders and investors identify whether a particular asset, such as a stock, is overbought or oversold. The RSI produces a score between 0 and 100 based on the movement of the asset’s price over a predetermined amount of time.
In the below video, we will learn about RSI in details.
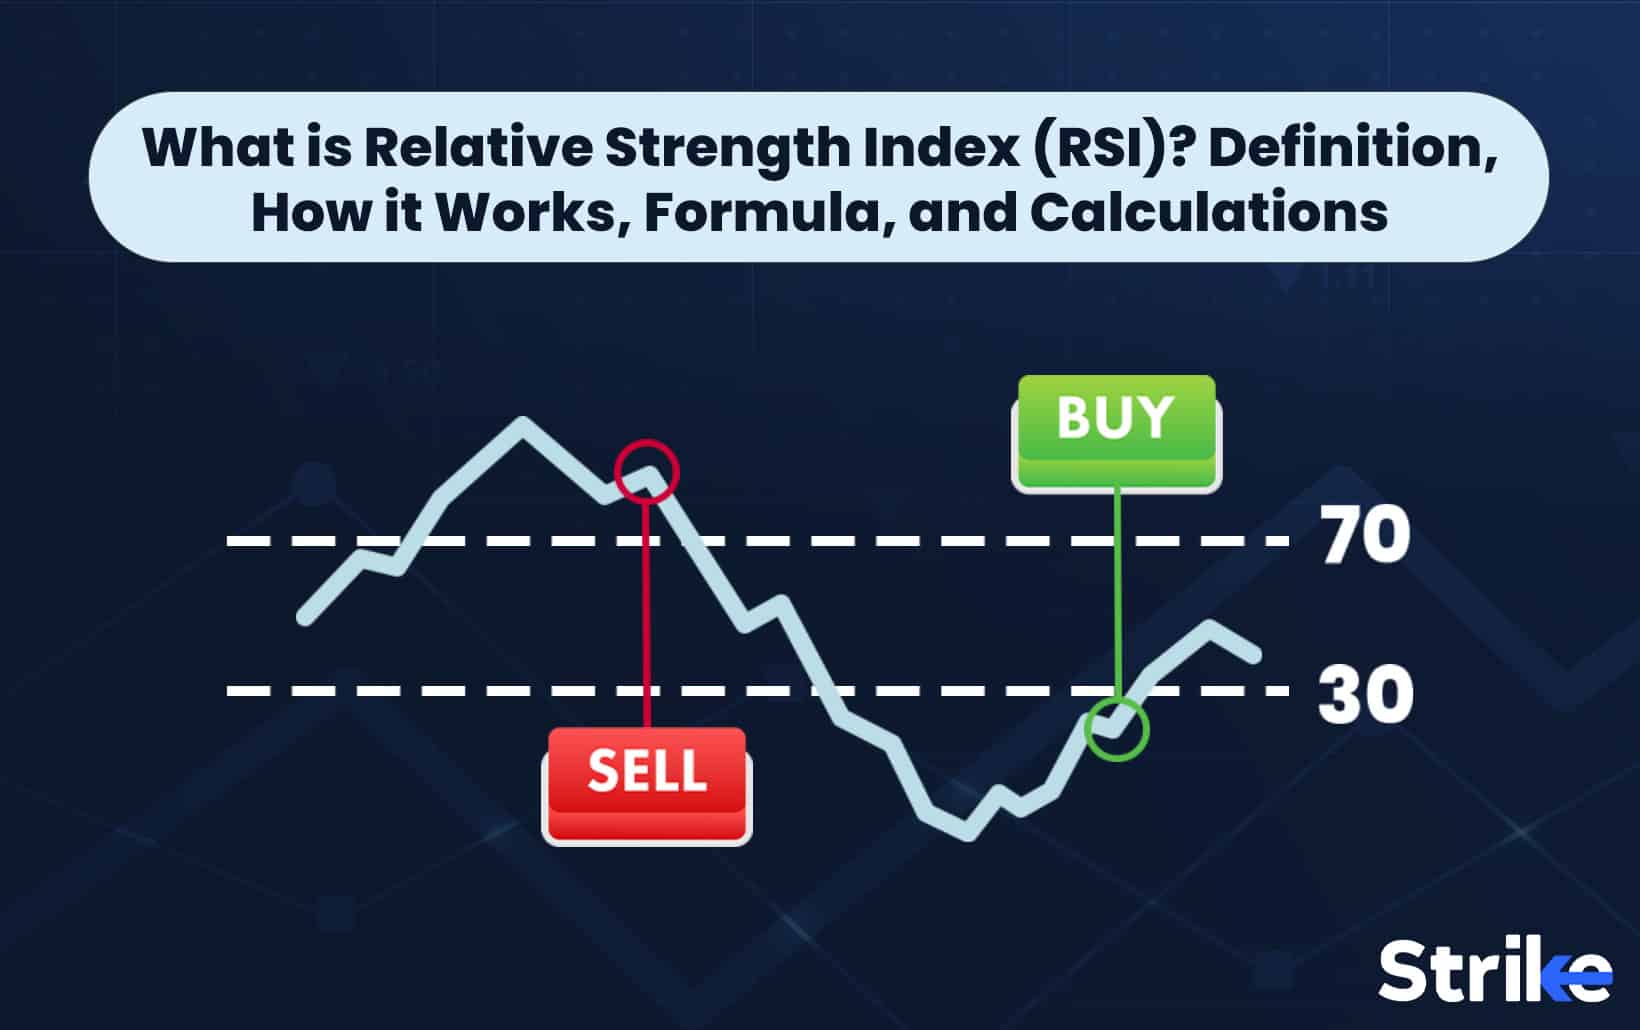
While a score below 30 indicates that an asset is oversold and due for a price rebound, a score above 70 indicates that the asset is overbought and due for a price correction. The RSI is a popular technical analysis tool that can be combined with other analysis techniques to support traders’ and investors’ decision-making.
The Relative Strength Index (RSI) is sometimes referred to as the “Relative Strength Indicator”. Both terms are commonly used to describe this technical analysis tool.
The RSI in the stock market is a technical analysis tool used to measure the strength of an asset’s price movement over a certain period of time. The RSI compares the magnitude of an asset’s recent gains to its recent losses and generates a score between 0 and 100. Traders and investors use the RSI to identify whether an asset is overbought or oversold, which can help them make more informed trading decisions.
? Definition, How it Works, Formula, and Calculations 51")
A score above 70 on the RSI suggests that an asset is overbought and due for a price correction, while a score below 30 suggests that an asset is oversold and due for a price rebound. The RSI is one of many technical analysis tools that can be used in conjunction with fundamental analysis to evaluate a company’s financial health and make investment decisions.
For example, suppose an investor is considering buying shares of TCS. Before making a decision, the investor decides to analyse the company’s stock price movements using the RSI. They observe that the RSI has recently reached a score of 80, which indicates that the stock is overbought and is due for a price correction. They see that the stock has been on a steady upward trend for the past few weeks, which suggests that the stock price is nearing its peak.
Based on this analysis, the investor might decide to hold off on buying TCS shares until the RSI score drops below 70 and the stock price shows signs of stabilising. They could instead decide to take a short position on the stock, anticipating that the price will drop in the near future. Whatever their decision, the RSI can be a valuable tool to help inform their investment strategy.
What is the History of Relative Strength Index?
The Relative Strength Index (RSI) was developed by J. Welles Wilder Jr. and first introduced in his book “New Concepts in Technical Trading Systems” in 1978. Wilder was an American mechanical engineer turned real estate developer, who became interested in trading and technical analysis in the 1960s. He developed several technical analysis indicators during his career, but the RSI remains one of his most well-known and widely used creations.
The RSI was developed as a momentum oscillator to measure the speed and change of price movements. The initial purpose of the RSI was to help traders identify overbought or oversold market conditions, which could be used as a signal for buying or selling a security. Wilder believed that an overbought market condition signalled that the price was due for a correction, while an oversold market condition signalled that the price was due for a rebound.
The RSI was developed based on the principle that the momentum of an asset’s price movements can be measured by comparing the magnitude of its recent gains to its recent losses. Wilder used a formula to calculate the RSI, which is based on the average gain and loss over a specific time period.
The Relative Strength Index (RSI) over time has gained popularity among traders and investors as a technical analysis tool to identify trends and potential reversals and assist in decision-making. The RSI has been adapted and modified to cater to the needs of various traders and financial assets. The RSI remains relevant and valuable for technical analysis in the current financial markets, despite being an old tool.
How does the Relative Strength Index indicator work?
The Relative Strength Index (RSI) is a technical analysis tool used to measure the magnitude of recent price changes in a security, as well as the speed at which these changes occur. It is a momentum oscillator that compares the average gains to the average losses of a security over a specified period, typically 14 days. The RSI score ranges from 0 to 100, with a score above 70 indicating an overbought market condition, and a score below 30 indicating an oversold market condition.
? Definition, How it Works, Formula, and Calculations 52")
The formula for calculating RSI involves several steps. First, the average gain and average loss for the specified time period are calculated by dividing the sum of gains and losses by the number of periods. Next, the relative strength (RS) is calculated by dividing the average gain by the average loss. The RSI is then calculated using the formula: RSI = 100 – (100 / (1 + RS)).
The RSI can be plotted on a chart as a single line that oscillates between 0 and 100. Refer to the picture below.
When the RSI line moves above 70, it indicates that the asset is overbought, meaning that the price of the asset have increased too rapidly and be due for a correction or a price decrease. Conversely, when the RSI line moves below 30, it indicates that the asset is oversold, meaning that the price of the asset have decreased too rapidly and due for a rebound or a price increase.
The Relative Strength Index (RSI) is a versatile technical analysis tool that can be used for a variety of purposes in trading and investing. Some of the main uses of RSI include:
- Identifying overbought and oversold conditions: When the RSI score is above 70, it indicates an overbought market condition, while a score below 30 indicates an oversold condition. Traders can use these levels as potential entry or exit points for buying or selling assets.
- Spotting trend reversals: When the RSI line diverges from the price trend, it can be an early indication of a trend reversal. This can be used to anticipate potential changes in market direction.
- Confirming price trends: When the RSI line follows the price trend, it can be used to confirm the strength of the trend. This can help traders make more informed decisions about whether to enter or exit trades.
- Identifying potential buy and sell signals: Traders can use RSI crossovers and divergences as potential buy and sell signals. For example, when the RSI line crosses above the 30 level, it can be a buy signal, while a cross below the 70 level can be a sell signal.
- Divergence analysis: RSI divergence can be used to detect changes in momentum that won’t get reflected in the price trend. This can help traders identify potential trend reversals or continuation patterns
The RSI is a versatile tool that can be used in combination with other technical analysis indicators to provide a more complete picture of market conditions and potential trading opportunities.
Why is RSI important?
The Relative Strength Index (RSI) is an important tool for traders and investors because it provides a reliable way to measure the strength of an asset’s price action. By using RSI, traders can identify when an asset is overbought or oversold and can help identify potential entry or exit points for buying or selling.
One of the primary uses of RSI is to identify overbought and oversold conditions. When an asset’s price moves too far in one direction, it is often due for a price correction in the opposite direction. RSI can help traders identify these conditions and take action accordingly.
RSI can help confirm price trends, which can be used to inform trading decisions. By looking for divergences between RSI and price action, traders can identify potential changes in momentum that is reflected in the price trend.
RSI is useful for spotting trend reversals. When RSI diverges from the price trend, it can indicate a potential reversal, which can be used to anticipate changes in market direction.
RSI provides buy and sell signals when it crosses over certain thresholds. This can help traders make informed decisions about when to enter or exit trades.
Finally, RSI divergence analysis is an important technique that traders can use to identify potential changes in momentum. When RSI diverges from the price trend, it can be a sign of a potential reversal or continuation pattern, which can help traders anticipate future price movements.
What is the Formula for Relative Strength indicator?
The Formula for the Relative Strength indicator uses a mathematical calculation to plot the RSI on a scale of 0 to 100. The RSI formula involves two main calculations. The first calculation is the average gain over a specific period of time, and the second calculation is the average loss over the same period of time.
? Definition, How it Works, Formula, and Calculations 53")
The RSI formula can be written as follows:
RSI = 100 – [100 / (1 + RS)]
Where RS = Average Gain / Average Loss
We need to determine the period of time over which we want to calculate the RSI. This period of time is typically 14 days, but it can be adjusted. Once we have determined the time period, we need to calculate the average gain and average loss over that period of time.
Let’s say we want to calculate the RSI for a stock over a 14-day period. Over that 14-day period, the stock had the following gains and losses:
Day 1: +2%
Day 2: +3%
Day 3: -1%
Day 4: -2%
Day 5: +4%
Day 6: +1%
Day 7: -3%
Day 8: -2%
Day 9: +2%
Day 10: +3%
Day 11: +1%
Day 12: -1%
Day 13: -2%
Day 14: +4%
To calculate the average gain, we would add up all of the gains over the 14-day period and divide by 14:
Average Gain = (2 + 3 + 4 + 1 + 2 + 3 + 1 + 4) / 14 = 2.21%
To calculate the average loss, we would add up all of the losses over the 14-day period and divide by 14:
Average Loss = (1 + 2 + 3 + 1 + 2) / 14 = 1.21%
Next, we can use these values to calculate the Relative Strength (RS):
RS = Average Gain / Average Loss = 2.21% / 1.21% = 1.82
Finally, we can plug the value of RS into the RSI formula to calculate the RSI:
RSI = 100 – [100 / (1 + RS)] = 100 – [100 / (1 + 1.82)] = 64.1
The RSI for the stock over the 14-day period is 64.1, in the above example. This indicates that the stock is neither overbought nor oversold and is trading in a fairly normal range. Traders can use this information to help identify potential entry or exit points for buying or selling the stock.
How to Calculate the Relative Strength Index indicator?
To calculate the Relative Strength Index (RSI) indicator, follow these steps:
- Choose a time period, typically 14 days.
- Calculate the average gain and average loss for the chosen time period.
- Calculate the Relative Strength (RS) by dividing the average gain by the average loss.
- Calculate the RSI using the following formula: RSI = 100 – (100 / (1 + RS))
To create an RSI chart, plot the RSI values on a graph with the x-axis representing time and the y-axis representing the RSI values. The RSI chart typically has two horizontal lines, one at the overbought level of 70 and one at the oversold level of 30. The RSI chart can be used to identify potential trend reversals, overbought and oversold conditions, and divergence between price and momentum. An example of an RSI chart can be seen below:
How to use the Relative Strength Index indicator in Technical Analysis?
The Relative Strength Index (RSI) indicator can be used in technical analysis to identify potential buy and sell signals. Here are the steps to use RSI in technical analysis:
- Determine the time period: The default time period is 14 days, but it can be adjusted based on the desired level of sensitivity.
- Identify the overbought and oversold levels: The overbought level is typically set at 70, and the oversold level is set at 30. These levels can be adjusted based on the stock or market being analysed.
- Look for divergences: A bullish divergence occurs when the price of the stock makes a lower low, but the RSI makes a higher low. This can be a signal that the stock is poised for a reversal. A bearish divergence occurs when the price of the stock makes a higher high, but the RSI makes a lower high. This can be a signal that the stock is overbought and due for a correction.
- Use the RSI to identify overbought and oversold conditions: When the RSI reaches the overbought level of 70, it can be a signal that the stock is overvalued and due for a correction. When the RSI reaches the oversold level of 30, it can be a signal that the stock is undervalued and due for a rebound.
- Look for buy and sell signals: When the RSI crosses above the oversold level of 30, it can be a signal to buy the stock. When the RSI crosses below the overbought level of 70, it can be a signal to sell the stock.
By using the RSI indicator in technical analysis, traders and investors can gain insights into potential trend reversals, overbought and oversold conditions, and divergences between price and momentum.
How to use RSI Indicator in Stock Market?
Here are the steps to use the RSI indicator in the stock market:
- Identify the stock you want to analyze and gather its historical price data.
- Choose a timeframe for your analysis, such as daily, weekly, or monthly.
- Plot the RSI indicator on the stock chart.
- Look for overbought and oversold conditions: RSI values above 70 indicate overbought conditions, while RSI values below 30 indicate oversold conditions.
- Use the RSI to identify potential trend reversals: bullish divergences occur when the RSI is making higher lows while the price is making lower lows, indicating potential bullish momentum; bearish divergences occur when the RSI is making lower highs while the price is making higher highs, indicating potential bearish momentum.
- Combine the RSI indicator with other technical indicators and analysis techniques for more accurate trading decisions.
The Relative Strength Index (RSI) is a widely used technical indicator that provides insights into market conditions and potential trend reversals. Its ability to measure the strength of price movements makes it a valuable tool for traders and investors in the stock market. By identifying overbought and oversold conditions, and using divergences to spot potential trend changes, the RSI can help traders make informed decisions about buying and selling stocks.
How to read Relative Strength Index indicator chart?
Reading the Relative Strength Index (RSI) indicator chart is a crucial skill for traders who want to incorporate this technical indicator into their trading strategies. The RSI chart typically ranges from 0 to 100 and is displayed as a line graph that oscillates between the two extremes. Traders should be aware of the following key points when reading the RSI chart:
- Overbought and oversold levels: The RSI chart has two horizontal lines drawn at the 70 and 30 levels. When the RSI line crosses above 70, it indicates that the stock is overbought, and a price correction is imminent. Conversely, when the RSI line crosses below 30, it suggests that the stock is oversold, and a price rebound is due.
- Divergences: When the RSI line diverges from the price chart, it signals a potential trend reversal. A bullish divergence occurs when the RSI line makes higher lows while the price chart makes lower lows, indicating that a bullish reversal is on the horizon. A bearish divergence occurs when the RSI line makes lower highs while the price chart makes higher highs, indicating that a bearish reversal is forthcoming.
- omentum and trend strength: The slope of the RSI line can provide insights into the momentum and strength of the stock’s trend.
By analysing these key features of the RSI chart, traders can gain a deeper understanding of market conditions and potential trend reversals.
What are the benefits of Relative Strength Index indicator?
The Relative Strength Index (RSI) indicator offers several benefits for traders and investors, including:
- Early warning signals: RSI can provide early warning signals of trend reversals, which can be used to make timely trading decisions.
- Overbought and oversold conditions: RSI is an excellent tool for identifying overbought and oversold conditions in the market. When the RSI reading goes above 70, it suggests that the market is overbought, and when it falls below 30, it suggests that the market is oversold.
- Divergence: RSI divergence occurs when the indicator moves in a different direction than the price, which can signal a possible trend reversal.
- Confirmation: The RSI indicator can be used to confirm other technical analysis tools, such as trend lines or moving averages.
- Flexibility: The RSI indicator can be customised to suit different trading styles and timeframes. Traders can adjust the period and the overbought/oversold levels to fit their preferences.
- Versatility: RSI can be used on different financial instruments, including stocks, forex, commodities, and cryptocurrencies.
Overall, the Relative Strength Index indicator can be a valuable tool for traders and investors looking to analyse market trends, identify potential reversals, and make informed trading decisions.
What are the limitations of Relative Strength Index indicator?
The Relative Strength Index (RSI) indicator, like any other technical indicator, has its limitations. Some of the limitations of RSI are:
- False Signals: RSI is prone to generate false signals during choppy or sideways markets. Traders enter or exit trades prematurely, leading to losses.
- Overbought/Oversold Signals: RSI readings above 70 are considered overbought, while readings below 30 are considered oversold. However, in strong trending markets, RSI can remain overbought or oversold for extended periods, leading to missed opportunities or losses.
- Time Frame Dependence: RSI readings can vary widely depending on the time frame used. Traders need to adjust their strategies for different time frames, leading to complexity.
- Limited Market Conditions: RSI is designed to work best in markets that are trending, not in markets that are choppy or range-bound. Therefore, traders need to be careful when using RSI in different market conditions.
- Lagging Indicator: RSI is a lagging indicator that provides information about past price movements. As a result, it not always be able to provide timely signals for traders to act on.
Despite these limitations, the RSI indicator remains a popular tool among traders for identifying potential trend reversals, overbought/oversold conditions, and bullish or bearish divergences.
What are examples of Relative Strength Index indicator?
The Relative Strength Index (RSI) is a widely used technical indicator that helps traders identify potential price trends in the stock market. It measures the magnitude of recent price changes to evaluate overbought or oversold conditions in the market. Here are some examples of the RSI indicator:
? Definition, How it Works, Formula, and Calculations 54")
- Bullish divergence: This occurs when the RSI indicator is moving upward while the price of the security is moving downward. It suggests a potential bullish trend reversal in the market.
- Bearish divergence: This is the opposite of bullish divergence, where the RSI is moving downward while the price of the security is moving upward. It suggests a potential bearish trend reversal in the market.
- Centerline crossover: When the RSI crosses the centerline from below, it indicates a potential bullish trend in the market, and when it crosses the centerline from above, it suggests a potential bearish trend in the market.
- Overbought and oversold conditions: The RSI is typically used to identify overbought and oversold conditions in the market. When the RSI is above 70, it suggests an overbought condition, and when it is below 30, it suggests an oversold condition.
- Failure swings: A failure swing occurs when the RSI fails to reach a new high or low and instead moves in the opposite direction. It suggests a potential trend reversal in the market.
Example of RSI Divergences
RSI divergences occur when the price action of an asset and the RSI indicator are moving in opposite directions. This can signal a potential trend reversal in the price action of the asset. There are two types of RSI divergences: bullish and bearish.
? Definition, How it Works, Formula, and Calculations 55")
A bullish RSI divergence occurs when the price action of an asset is making lower lows, but the RSI indicator is making higher lows. This indicates that although the price is trending down, the momentum is shifting and the price will soon reverse and start to trend up.
For example, let’s say that the price of a stock has been in a downtrend for the past month, making lower lows. However, during this same time period, the RSI indicator has been making higher lows. This is a bullish RSI divergence, and it could signal that the stock is due for a reversal and start to trend up in the near future.
A bearish RSI divergence occurs, on the other hand, when the price action of an asset is making higher highs, but the RSI indicator is making lower highs. This indicates that although the price is trending up, the momentum is shifting and the price soon reverse and start to trend down.
RSI divergences can be a useful tool for traders and investors to identify potential trend reversals and make informed trading decisions.
Example of RSI Ranges
RSI ranges are the specific levels on the RSI scale that indicate different market conditions. These levels are typically set at 30 and 70, but they can be adjusted based on the trader’s preferences or the security being analysed.
? Definition, How it Works, Formula, and Calculations 56")
Here are the three main RSI ranges:
- Oversold range: RSI values below 30 are typically considered oversold. This indicates that the security is undervalued and due for a price increase. Traders look for buying opportunities when the RSI falls below this level.
For example: when the RSI of a stock is 25, it is considered to be in the oversold range.
- Neutral range: RSI values between 30 and 70 are considered to be in the neutral range. This range indicates that the security is neither overbought nor oversold, and there is no clear directional bias. Traders wait for the RSI to move out of this range before making any trades.
For example: when the RSI of a stock is 50, it is considered to be in the neutral range.
- Overbought range: RSI values above 70 are typically considered overbought. This indicates that the security is overvalued and due for a price decrease. Traders look for selling opportunities when the RSI rises above this level.
For example: when the RSI of a stock is 80, it is considered to be in the overbought range.
Example of RSI Swing Rejections
RSI (Relative Strength Index) swing rejections occur when the RSI indicator reaches overbought or oversold levels and then reverses, creating a swing or pivot point. A swing rejection occurs when the price tries to break through a previous high or low but is rejected and pulled back by the swing point created by the RSI indicator.
? Definition, How it Works, Formula, and Calculations 57")
For example, suppose the RSI indicator for a stock reaches an overbought level of 70 and then starts to decline, creating a swing point, when the stock price attempts to break through a previous high but is rejected at the swing point created by the RSI indicator, this would be considered an RSI swing rejection.
RSI swing rejections can be used as a signal for traders to enter or exit positions, depending on the direction of the swing and other technical analysis factors. They can be used in conjunction with other technical indicators to confirm potential trend changes or reversals.
Example of Positive-Negative Reversals of RSI
The Positive-Negative Reversals of Relative Strength Index (RSI) is a technical analysis indicator that occurs when the RSI makes a higher high followed by a lower high or a lower low followed by a higher low. These reversals can be used to identify potential trend changes in the underlying asset.
For example, let’s say we have a stock that has been trending upwards for a while and its RSI is showing overbought conditions above 70. Suddenly, the RSI makes a higher high, say 80, and then falls below the previous high, say 75. This would be a positive-negative reversal and could indicate that the uptrend in the stock is weakening and a potential trend change is in the works.
On the other hand, suppose the stock has been trending downwards and its RSI is showing oversold conditions below 30, and the RSI makes a lower low, say 20, and then rises above the previous low, say 25, this would be a negative-positive reversal and could indicate that the downtrend in the stock is weakening and a potential trend change is in the works.
Traders often use Positive-Negative Reversals of RSI in conjunction with other technical analysis tools to confirm potential trend changes and make informed trading decisions.
What are the other Technical Indicators besides Relative Strength Index indicator?
There are many technical indicators that traders and investors use to analyse market trends and make trading decisions. Here are some commonly used technical indicators besides Relative Strength Index (RSI):
- Moving Average (MA): A moving average is a trend-following indicator that smooths out price data by calculating an average price over a period of time. It can help identify the direction of a trend and support/resistance levels.
- Bollinger Bands (BB): Bollinger Bands are a volatility indicator that uses a moving average and standard deviation to create upper and lower bands around price. The bands can help identify overbought and oversold conditions and potential trend reversals.
- MACD (Moving Average Convergence Divergence): MACD is a trend-following momentum indicator that measures the difference between two exponential moving averages. It can help identify trend changes and potential buy/sell signals.
- Fibonacci retracement: Fibonacci retracement is a technical analysis tool that uses horizontal lines to indicate areas of support or resistance at the key Fibonacci levels before the price continues in the original direction.
- Ichimoku Cloud: Ichimoku Cloud is a comprehensive indicator that provides multiple signals on the same chart. It uses moving averages, support/resistance levels, and cloud charts to identify potential trends, momentum, and entry/exit points.
- Stochastic oscillator: Stochastic oscillator is a momentum indicator that compares the closing price to the price range over a set period of time. It can help identify potential overbought and oversold conditions and trend reversals.
- Average Directional Index (ADX): ADX is a trend strength indicator that measures the strength of a trend regardless of its direction. It can help traders identify when a trend is strong or weak and potential changes in trend direction.
These are just a few examples of technical indicators, and traders often use a combination of indicators to gain a more comprehensive understanding of market trends and potential opportunities.
What is considered as Overbought and Oversold RSI?
The Relative Strength Index (RSI) is a popular technical analysis indicator that measures the strength and momentum of a security’s price movement. It oscillates between 0 and 100 and is calculated based on the average gains and losses of a security over a specified period of time.
The RSI is often used by traders and analysts to determine whether a security is overbought or oversold. Overbought and oversold conditions suggest that a security’s price has moved too far in one direction and is due for a correction.
RSI reading of 70 or higher is considered overbought, while a reading of 30 or lower is considered oversold. However, these levels are not fixed and can vary depending on the security being analysed and the time frame being used.
When the RSI reaches the overbought level of 70 or higher, it is considered a sign that the security is overvalued and is due for a price correction. Traders and analysts look for a bearish divergence or negative reversal pattern on the price chart to confirm this view. A bearish divergence occurs when the price of a security is making higher highs while the RSI is making lower highs, suggesting that the momentum of the price is slowing down.
On the other hand, when the RSI reaches the oversold level of 30 or lower, it is considered a sign that the security is undervalued and is due for a price bounce. Traders and analysts look for a bullish divergence or positive reversal pattern on the price chart to confirm this view. A bullish divergence occurs when the price of a security is making lower lows while the RSI is making higher lows, suggesting that the momentum of the price is picking up.
It is important to note that overbought and oversold conditions on the RSI do not necessarily mean that the price of a security will immediately reverse direction. Traders and analysts should use other technical indicators and fundamental analysis to confirm their views on a security’s price movement.
What is considered as good and bad RSI?
RSI oscillates between 0 and 100, with values above 70 considered overbought and values below 30 considered oversold. What is considered a “good” or “bad” RSI value depends on the context of the market and the particular trading strategy being used.
RSI reading above 70 indicates that an asset is overbought and is due for a correction or reversal. This could be considered a “bad” RSI value for traders who are looking to enter a long position in the asset. Conversely, an RSI reading below 30 indicates that an asset is oversold and is due for a rebound, which could be considered a “good” RSI value for traders looking to enter a long position.
When should you buy a stock using RSI?
The Relative Strength Index (RSI) is a technical analysis indicator used to measure the magnitude of recent price changes to evaluate overbought or oversold conditions in an asset. It ranges from 0 to 100 and is calculated using the average gain and loss over a specified period. When the RSI is above 70, it suggests that the asset is overbought, and when it’s below 30, it suggests that the asset is oversold.
Buying a stock using RSI depends on the investor’s strategy and risk tolerance. Generally, an investor can use RSI to buy a stock when it is oversold and the RSI reading is below 30, indicating that the stock is undervalued and could potentially rebound. However, it is essential to note that oversold conditions can persist for an extended period, and stock can continue to decline.
It’s important to use other technical indicators and fundamental analysis in combination with RSI to make informed decisions about buying or selling a stock. This includes examining the stock’s price-to-earnings ratio, earnings growth rate, dividend yield, and industry trends.
It’s important to note that no single technical indicator or strategy can predict stock prices with certainty. It is crucial to diversify your investment portfolio and have a long-term investment horizon to manage risk and maximise returns.
What timeframe should I use for RSI?
The timeframe that one should use for RSI (Relative Strength Index) will depend on his trading style. The most common RSI period used by traders is 14, which is the default setting on many trading platforms. This means that the RSI indicator will be calculated using the last 14 periods of price data. However, some traders prefer to use a shorter or longer time frame depending on their preferences.
It is important to consider the volatility of the asset that the trader is analysing. More volatile assets require a shorter timeframe to capture price movements, while less volatile assets require a longer timeframe to generate meaningful signals.
Is RSI accurate?
Yes, RSI generally considered to be accurate. RSI is a lagging indicator, which means it is based on past price movements and not provide accurate signals for future price movements. By the time RSI indicates an overbought or oversold condition, the market have already changed direction.
RSI is based on historical price data and does not take into account fundamental factors that can affect market conditions, such as changes in economic policy, geopolitical events, or company-specific news.
Is High RSI good?
Yes, When the RSI is high because the security has been on a strong uptrend and the price has been increasing steadily, then a high RSI reading indicate that the security is overbought and due for a correction. In this case a high RSI reading not be good for investors who are looking to buy the security.
But when the RSI is high because the security has just broken out of a long-term consolidation range or is in the early stages of an uptrend, then a high RSI reading is a good thing. In this case a high RSI reading suggest that the security is gaining momentum and that the uptrend continue for a while. In such a situation, a high RSI reading is considered good for investors who are already holding the security.
Should I invest when RSI is low?
No, while a low RSI reading can indicate that an asset is oversold and potentially due for a rebound, In this case it can be a good deal for investors who are looking to buy the security. Low RSI should not be the sole factor in making investment decisions. It’s important to consider other fundamental and technical factors, such as the company’s financial health, market trends, and news events that affect the asset’s price.
Is RSI better than MACD?
Yes, the RSI indicator is considered as a slightly better performing technical indicator as compared to MACD. This is primarily caused by the RSI Indicator’s lower rate of false trading signals compared to MACD. The effectiveness of the RSI and the MACD Indicator in the Australian market was examined in the Business Perspective research from 2014 on a variety of fronts. The overall profitability of trades made using signals from the MACD and RSI was one of the dimensions that this research concentrated on as the amount of money invested in each trade grew. This research discovered that RSI outperformed MACD as an indicator on this metric. This conclusion was primarily based on the observation that, in this research, over a given time period, the RSI Indicator provided fewer but more precise trading signals than the MACD.
What is the difference between RSI and MACD?
MACD (Moving Average Convergence Divergence) and RSI (Relative Strength Index) are both popular technical indicators used in stock trading, but they have different calculations and interpretations.
? Definition, How it Works, Formula, and Calculations 58")
The MACD indicator is calculated by subtracting the 26-period Exponential Moving Average (EMA) from the 12-period EMA. The resulting line is then plotted on top of a 9-period EMA, which acts as a signal line. The MACD oscillates above and below zero, indicating the relationship between the two moving averages. Traders use the MACD to identify changes in momentum, trend reversals, and divergences between price and the indicator.
The RSI indicator, on the other hand, measures the strength of a security’s price action by comparing upward movements to downward movements over a specified time period. The RSI is calculated by dividing the average gain of the price over a given period by the average loss over that same period. The resulting value is plotted on a scale of 0 to 100, with readings above 70 considered overbought and readings below 30 considered oversold. Traders use the RSI to identify potential trend reversals, as well as overbought and oversold conditions.
In summary, the MACD is primarily used to identify changes in momentum and trend reversals, while the RSI is primarily used to identify overbought and oversold conditions and potential trend reversals. Both indicators can be useful in analyzing market trends, but they provide different types of information and are used in different ways by traders.


 Previous Article


![85 Common Stock Market Terminologies for Dummies [Updated List for 2025]](https://www.strike.money/wp-content/uploads/2025/04/Popular-Stock-Market-Terms-for-Beginners-Banner.png "85 Common Stock Market Terminologies for Dummies [Updated List for 2026] 64")


No Comments Yet.