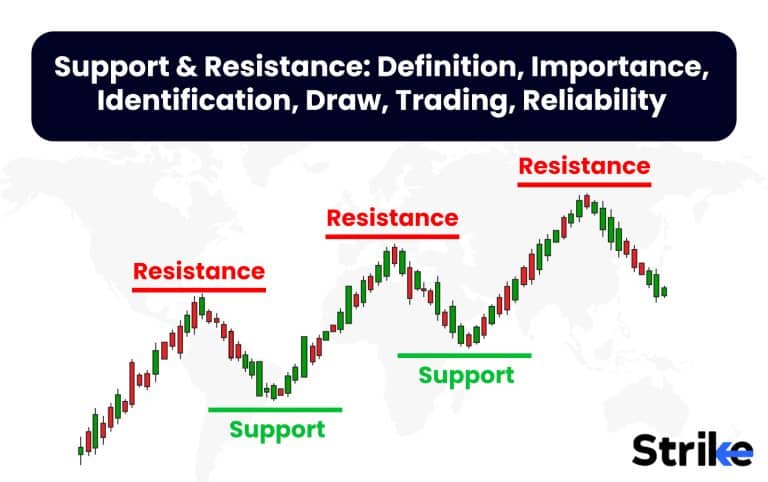
Support and resistance is a core technical analysis concept that is used widely by traders to understand market trends and potential reversals. Support and resistance are used to identify key price levels where the prevailing trend may find buying or selling pressure.
Support and resistance used in trading allows traders to anticipate potential price reversals or continuations by observing how the price interacts with identified support and resistance levels. This helps traders to plot potential trade entries and exits.
One advantage of using support and resistance is that they provide clear entry and exit points for traders, allowing them to manage risk more effectively. However, one limitation is that support and resistance levels are not always reliable and can sometimes result in false signals.
What is support?
Support refers to the price level at which demand is strong enough to prevent the stock price from falling further. Buyers tend to enter the scripts around these support levels as it is assumed that the script won’t fall below the selected support level. Support levels indicate where investors expect a stock’s price decline to stop and an upward reversal to occur. Traders and analysts draw these support levels by observing a variety of things. Analysts look at the left of the chart to identify key price points from where the script has bounced several times.
These key price points are identified by wick rejections, OHLC (Open, High, Low, Close) prices of daily, weekly or monthly candlesticks, or psychological numbers also tend to work as strong support price points. An example of how traders draw support levels is explained briefly in the chart uploaded below. Strong support levels act as a floor and halt a downward trend in a stock’s price. Recognizing key support areas is an important concept in the technical analysis of stock charts and trends.
Support levels are broken and these levels are converted into resistance levels as the buyers at the support level before the break shift their perspective and go short on these levels converting these support levels into resistance levels.

What is resistance?
Resistance refers to a price level at which there is sufficient supply of a stock to halt or reverse an uptrend. As the price of a stock rises to a resistance level, sellers tend to step in and sell the stock, creating a supply that prevents the price from rising further. Resistance levels indicate where investors see a stock as being overvalued or ceiling prices. They are typically determined by analyzing historical price charts, connecting a line through wick rejections or marking OHLC’s (Open, high, low, close) prices of daily, weekly and monthly candlesticks, identifying certain price levels where the stock has reversed back down from on multiple occasions.
The more times a resistance level holds, the stronger it is. Resistance gives traders and investors an indication of where they potentially sell or take profits on a stock if it rises up to that resistance zone. Breaking through resistance with high volume shows increased buying pressure that leads to new highs. An example of how traders draw resistance levels is explained briefly in the chart uploaded below.

Resistance levels are broken and these levels are converted into support levels as the sellers at the resistance level before the break shift their perspective and go long on these levels converting these resistance levels into support levels.
Why is it important to know support & resistance?
Understanding support and resistance levels is important for traders to identify potential reversal points, set entry and exit prices, place stop losses and profit targets, and detect trend changes early.
Support and resistance represent areas where the forces of supply and demand meet. At support levels, there is expected to be sufficient demand from buyers to prevent the price declining further. At resistance levels, there is expected to be adequate supply from sellers to prevent the price rising above that point.
By identifying key support and resistance zones on a chart, traders make educated predictions about potential price movements. For example, if the price approaches a significant support area, traders anticipate a bounce higher. Traders expect further upside to be limited around that area, if the price approaches a known resistance level.
Analysts draw support and resistance levels on all the time frames. The strength of a particular support or resistance level increases when they are drawn on higher time frames. For example, a monthly support level will be stronger than an intraday support level drawn on 5 min or 15 min time frame. Thus, traders plan their entries and exits based on the levels drawn on different time frames.
- Setting Entry and Exit Points
It creates potential trade entry opportunities, when the price tests support or resistance levels. Traders often look to enter long positions as the price bounces off support and enter short positions as the price falls back from hitting resistance. The long or short signals on respective support or resistance levels are considered stronger if relevant candlestick patterns are identified at these key price points.
In addition, support and resistance areas are used to define exit points for profitable trades. For instance, a trader closes out long trades around resistance areas where the trend reverses and closes out short trades around levels of support where the downtrend stalls. An example of how support and resistance levels are used to set entries and exit is showcased in the chart uploaded below.

- Stop Loss and Target Mapping
By using support and resistance zones, traders logically set stop loss orders below defined support and target prices near identified resistance levels. Stop losses below support protect capital in case the support breaks down. Profit targets near resistance allow traders to lock in gains as the uptrend hits potential hurdles. An example of how support and resistance levels are used to place a protective stop is showcased in the chart uploaded below:

- Trend Reversal Indication
The breaking of key support and resistance levels signals potential trend reversals. The breaking of a support for example indicates a potential shift in market sentiment, the buyers at the support level shift their positions into the selling side when the support level breaks. It often indicates a shift from an uptrend to a downtrend, if the price breaks below a major support zone. Conversely, if the price successfully penetrates above a significant resistance barrier, it typically signals a shift from a downtrend to an uptrend.
Paying attention to how the price reacts around support and resistance hence allows traders to prepare for potential trend reversals at an early stage. The ability to rapidly detect and act on trend reversals is a key aspect of trading success. An example of how support and resistance levels are used to identify trend reversals is explained in the chart uploaded below:

What is the psychology behind support & resistance?
The psychology behind support and resistance levels is that traders tend to buy near support levels, seeing them as good value, and sell near resistance levels, seeing them as areas where the price struggles to break higher.
Support levels represent prices where buyer demand tends to increase enough to stop or reverse a downtrend. As the price drops to a support area, market participants begin to assume the price of the asset is now underpriced as it has reached a price point where previously the price surged thus making long decisions. From a psychological perspective, support levels represent areas where traders expect the downside movement to pause or reverse based on a clustering of buyers willing to step in at those prices.
Traders often see support levels as opportunities to get long stocks at a good price. There is comfort in knowing that others are likely seeing the support level in the same way. This grouping of sentiment helps strengthen the conviction that the support will hold. It becomes somewhat of a self-fulfilling prophecy as traders pile in with buy orders, driving the price back up. Without this coordinated psychology around support, it would be difficult for individual buyers to have enough impact to reverse the downward momentum on their own.
The strength of the levels is increased when they are tested multiple times but eventually, if a support is tested numerous times, the capability of support holding buyers loses heat and eventually is converted into a resistance level after the break of this key support price.
The support and resistance levels drawn on higher time frames have higher sentiment of buying or selling pressure.
Resistance levels mark areas where selling pressure is expected to increase enough to stop or reverse an uptrend. As the price rises into a resistance zone, sellers begin to see the asset as overvalued and look to take profits from long positions or initiate new short positions. This increase in selling interest provides resistance that caps further upside. Psychologically, resistance represents a clustering of seller conviction that the price is reaching an area where it is unlikely to break higher.
If a resistance level is tested multiple times, the capability of sellers’ pressure is reduced at a point where the buyers take control and break past the barrier converting this broken resistance level into a support.
How to identify support & resistance levels?
Look at the below graph to learn how to identify support & resistance levels.

This shows a stock chart that has support and resistance levels marked on it with arrows indicating the direction of the trend. The current price and trading volume are also displayed.
Support and resistance levels are identified on a chart by looking for areas where the stock price has previously either bounced off of (support) or broken through (resistance). Areas that have seen multiple touches tend to be stronger levels. Support levels are areas where demand is found to prevent the price from falling further. Resistance levels are areas where supply enters the market and acts as a ceiling preventing the price from rising higher.
Techniques used to identify support and resistance include analyzing price patterns like higher lows or lower highs that are forming.
Support and resistance levels are drawn by observing significant activity in the past or on the left side of the chart. Wick rejections offer significant signs of demand or supply pressure. These wick rejections are connected by the means of horizontal line forming relevant support and resistance levels. The OHLC prices (Open, high, low and close) of monthly and weekly candlesticks also offer relevant demand and supply areas. Additional indicators such as moving averages or trend lines can also help highlight potential areas on the chart. Once identified, these levels are then watched to see if the price interaction holds or breaks in the future. It’s important to note that support and resistance levels may change over time as market conditions shift.
How to draw support & resistance levels?
To learn how to draw support and resistance levels, look at the below graph.

There are multiple ways traders use to draw support and resistance. The above uploaded chart uncovers how a fibonacci retracement tool is used to draw support and resistance levels on these important ratios which are produced by extending the tool and connecting swing high and low. Observe how prices react to these key ratios as shown in the chart above in the purple box.
Another method is to look past price action and find wick (Shadow of candles) rejections. The wick rejections are connected by a horizontal line that connects these wick rejections into a proper support or resistance level. At Least 2 – 3 wick rejections should be considered. These are plotted on all the time frames but support and resistance drawn on higher time frames are significantly stronger than the levels drawn on lower time frames.
We can see the stock’s price rising and falling as it tests different support and resistance levels, shown as horizontal lines. There are strong resistance levels formed at points where the price was previously unable to break through, acting as a ceiling. Below that are support levels, where demand for the stock prevented the price from falling further.
The trader looks for areas where the price has bounced off of previously to find support levels, or broken through to find resistance levels. These key price points are then connected using lines or curves to identify the levels of support and resistance. The areas that have witnessed multiple touches by the price action are considered stronger levels.
What are the types of support & resistance?
There are five key methods used to identify support and resistance levels on stock charts. These include using price peaks and troughs, Fibonacci levels, pivot points, drawing trendlines, and looking at indicator levels.
1. Price peaks & troughs
One of the most basic techniques for drawing support and resistance is by connecting price peaks and troughs on the chart. Peaks are points where the price reaches a high before pulling back, while troughs are points where the price hits a low before bouncing. On daily or weekly charts, identify the highest peak and lowest trough over a given period.
For downtrends, the lower high peak serves as resistance while the lower low trough is support. For uptrends, the higher low trough is support and the higher high peak is resistance. The more times a peak or trough level is tested, the stronger the support or resistance. Connecting these swing highs and lows provides simple, visually defined areas where the price reverses. Now look at the below image.

This chart displays the daily price action and volume of a stock over a period of time. We see the peaks and troughs formed as the stock price oscillated between highs and lows. Technical analysts seek to identify these key swing points to determine support and resistance levels.
2. Fibonacci levels
The Fibonacci indicator draws horizontal lines at key ratios that act as potential support and resistance levels. In an uptrend, the price will often pull back and bounce off the Fibonacci retracement levels before continuing higher. These retracement levels serve as support. Meanwhile, Fibonacci extension levels identify resistance zones where upside is limited. The inverse is true for downtrends – Fibonacci retracements act as resistance while extensions act as support.
Traders often combine Fibonacci with trendlines to reinforce support/resistance levels. The most commonly used ratios are the 23.6%, 38.2%, 50%, 61.8% and 100% Fibonacci levels. Identifying clustered levels across multiple timeframes pinpoints high probability reversal areas. Look at the chart below.

The chart maps the price movement of a stock over time, with horizontal lines marking areas of support and resistance from previous interactions. The price successfully managed to react at these crucial ratios to suggest trades. A support zone shows where buying interest came in to halt a downward trend. Fibonacci retracement levels also highlight potential resistance and support areas drawn from a technical indicator.
3. Pivot points
Pivot points are calculated support and resistance levels derived from the previous day’s open, high, low and close. The pivot point (PP) is considered the primary support/resistance. Additional levels include three resistance levels (R1, R2, R3) above the pivot, and three support levels (S1, S2, S3) below. In an uptrend, pivot points often act as support while resistance levels turn into new support when broken.
The opposite is true for downtrends – pivot points become resistance while support levels turn into new resistance if breached. Traders look for bounces off support or breakdowns through resistance to enter new positions. Combining daily, weekly or monthly pivot points with price action confirms high probability reversal zones. Below is a representation of the same.

Pivot points are also featured in this chart, providing additional potential reversal or continuation areas as determined by technical indicators. Together these various tools illustrate how the stock traded in the past and highlight boundaries that may influence future price movement. Key levels are marked to anticipate where an uptrend may find resistance or a downtrend may find renewed buying pressure
4. Trendlines
Drawing uptrend and downtrend lines on the chart creates angled support and resistance zones. To draw an uptrend line, connect at least two significant low points with a line extending up to the right. This upward sloping trendline acts as dynamic support and indicates the prevailing uptrend. For downtrends, connect at least two significant high points with a downward sloping line that serves as resistance.
The more times the trendline is tested without being broken, the stronger it becomes. Breaking above or below the trendline signals potential trend exhaustion. Aggressive traders enter on trendline breaks, while conservative traders wait for confirmation before fading the trend. Valid trend lines should be drawn on higher time frames for reliability. See the image below.

The chart maps the price action of a currency pair over time. Upward sloping lines connect support points to represent the bullish trend similarly downward sloping lines connect resistance points to illustrate the bearish trend. These lines help take high quality trade setups by diving into lower time frame analysis and finding appropriate entries. to gauge These lines help in determining the overall direction of the market momentum. The trendlines also act as dynamic support and resistance levels providing traders with zones to identify potential reversals.
5. Technical indicators levels
Technical indicators like moving averages, Bollinger Bands, and the Ichimoku Cloud also identify support and resistance zones. Moving averages provide dynamic areas of support and resistance that change with the trend. Bollinger Bands use standard deviation to plot bands around the price that act as support and resistance. The middle band of the bollinger bands offer a direct key important price point that acts as support and resistance.
The Ichimoku Cloud plots a zone where price encounters support or resistance. Breakouts above or below these technical indicator levels signal a continuation or reversal of the trend. Traders often use indicators like the RSI to gauge momentum at support and resistance areas to anticipate potential breakouts or bounces. Combining indicator levels with classic analysis like trendlines or chart patterns improves accuracy when forecasting reversal points.
What happens when prices break through support or resistance levels?
Prices successfully breaking through established support or resistance signals a potential trend reversal or acceleration and represents a significant trading opportunity. Support and resistance levels act as barriers to price movement.
As the price drops towards support, buyers tend to enter the market as they anticipate the price will bounce off the support. However, if the selling pressure overwhelms the buying pressure at support, then the price breaks through the support level. Similarly, as the price rises towards resistance, sellers tend to enter as they expect the price to reverse off the resistance level.
But again, if the buying pressure overcomes the selling pressure at resistance, then the price pushes through the resistance and after the breakout, the sellers at this previous resistance shift their sentiment into buy side making them take long positions at the broken resistance converting itself into a newly formed support. Conservative traders often anticipate a retest of this broken level as an added confirmation. An example of the same is showed in the chart uploaded below.

How to confirm if support or resistance levels are broken?
Support or resistance levels being broken is confirmed by anticipating an appropriate retest of the broken level. A significant candlestick pattern confirms the overall analysis. Indications from indicators are taken and this way confluences are gathered to strengthen a particular trading plan that contains a proper entry and exit criterias, watching for closing prices beyond key levels, noting momentum indicator divergences, and waiting for follow-through over multiple bars before assuming the breakout is valid.

Intraday breaks of support/resistance are not sufficient confirmation. You want to wait for the daily, 4-hour or 1-hour bar to close beyond the key level. A closing price is more meaningful than an intraday spike above/below support/resistance. The close represents the consensus view of value after an entire period of trading. Sometimes the market will poke above or below a level during the day, but buyers or sellers will push it back by the close. Wait for confirmation of the close.
Review how the stock has reacted at the support or resistance level in the past. Some stocks tend to respect certain prices more than others. It increases the chance the level will hold again, if the level has rejected price multiple times before. It warns the level not to offer much support or resistance, if a stock has blown through the level easily previously. Understanding the personality of the stock at key levels avoids fakeouts.
Crossing certain moving averages confirms breakouts. For example, if price breaks an important support level and then starts trading below the 50-day moving average, it signals the sellers have taken control. Moving averages provide objective buy and sell signals that confirm the validity of the break.
Give the breakout time to play out over several bars before assuming support or resistance is broken. Avoid making immediate decisions on the same bar. One way to do this is to wait for three confirming closes beyond the level before acting. For example, if price closes below support, wait for two more closing bars to confirm downward momentum. This avoids whipsaws and ensures the breakout has some holding power. Below attached is an example of a failed breakout. Risky traders are usually trapped in this chasing behavior of breakouts thus risk averse traders usually anticipate an appropriate retest of the level for confirmation.

How to trade using support & resistance?
Support and resistance levels indicate potential turning points in a stock’s price. Traders look to buy at support and sell at resistance. Range trading involves buying at support and selling at resistance. Breakout trading means entering long after price breaks resistance or going short when it breaks support. Trendline trading involves drawing lines connecting swing highs and lows to identify the trend direction. Moving averages act as dynamic support and resistance levels for trading pullbacks in the trend direction.
1. Range trading
Range trading involves buying and selling a stock between defined support and resistance levels. Traders identify a price range where a stock has bounced between support and resistance over a period of time. The strategy aims to buy near support when the stock pulls back to the lower end of the range, and sell near resistance when it rallies to the upper end. Tight ranges indicate a balance between buyers and sellers. The aim is to lock in quick profits as the stock oscillates in the range. Strict risk management is essential, using stop losses in case the range breaks. Range trading requires patience to wait for trades at optimal entries.
This strategy works well for stocks trending sideways or lacking a clear direction. Defined support and resistance with a history of holding offers low risk entries to capture swings within the range. The buyers and sellers fight amongst each other to take control of the momentum. The range created is the outcome. The support and resistance level of this respective range provided multiple trading opportunities on lower time frames until a clean breakout occurs as shown in the chart below.

2. Breakout trading
Breakout trading aims to enter a stock as it breaks out of a period of consolidation. Traders identify key support and resistance levels that have contained a stock’s advances multiple times. It signals a potential new uptrend, when the price breaks above resistance with high volume. Traders buy the breakout, setting a stop loss below the recent resistance turned support. The break of a major level leads to swift gains as new buyers rush in. Breakdowns below support are traded similarly for short positions. Strict risk control is vital as breakouts fail. The surge in volume and volatility provides opportunity but also risk. Setting a stop loss and profit target is crucial when trading breakouts.
Breakouts mark a shift in sentiment and supply/demand dynamics. Capturing these explosive moves early is the appeal of breakout strategies. An example of an appropriate breakout is showcased in the chart below. The closing of candles on lower time frames trigger most of the breakout traders to enter the chasing momentum and push the price higher. The conservative trader often anticipates an appropriate retest of the level for a confirmed idea of continuation of an upside.

3. Trendline trading
Trendline trading involves drawing lines that connect swing highs and lows to identify the prevailing trend. Ascending trend lines show uptrends while descending trend lines indicate downtrends. Trendlines act as dynamic support and resistance levels. The strategy seeks to buy pullbacks to the trendline during uptrends, placing stop losses below the line. Selling near the trendline during downtrends also aims to capture moves lower. The sloping trendline reflects the momentum and directional bias. Traders look for tests of the trendline to time entries.
A break below rising support or above falling resistance signals a potential trend reversal. Strict risk management is critical when trendlines break as the prior trend is ending. Well-defined trendlines on the daily or weekly charts provide high probability trades in the direction of the major trend. In the chart below, the example of how support and trendline are combined to postulate a necessary trading plan. The breakout occurred on the daily time frame. Finally, on the same day, on lower time frames, a proper retest confirms the analysis for a trade that is supposed to be taken for the upside.

4. Moving average trading
Moving averages smooth out price action and help identify the overall trend direction. The strategy involves trading pullbacks towards key moving averages in the direction of the dominant trend. During uptrends, traders look to buy dips down to the 20-day or 50-day simple moving average support. In downtrends, rallies up to the moving averages present shorting opportunities. The moving average dictates the trend while price swings around it.
Moving average crossovers also generate trades. A golden cross with a faster average crossing above a slower one signals upside potential. A death cross with the reverse crossover points to potential declines. Strict risk management rules are essential, such as placing stop losses beyond the moving average extremes. Moving averages provide dynamic support and resistance to time entries in the prevailing trend direction. Study the chart uploaded below to uncover how support and resistance levels are combined with moving average strategy to unveil a high probability trading opportunity.

What is an example of support & resistance?
Look at the below image for example of support and resistance. The stock had been trending upwards within an upward sloping channel, supported by trend lines connecting the higher lows.

An example of support and resistance levels in this stock chart image would be the horizontal lines that have been drawn to connect previous price points. The lines act as boundaries that may influence potential future price movement. A key area of support is shown near the bottom of the chart, where the stock price has consistently found buyers and halted declines in the past.
This indicates that demand is present at this price level. The price respected the drawn trendline, accumulating the sellers on rise creating the liquidity of these sellers. With time, the price and bulls managed to push and break through the trendline. The trendline got retested as a confirmation of the continuation of the bullish trend and hitting stop losses of the sellers. This way trendlines and support and resistance levels are combined to refine a proper trade setup.
What are support & resistance reversals?
Let us first look at an example of resistance reversal, where resistance becomes support.

An area around previously acted as a ceiling, where selling pressure caused the uptrend to pause on multiple occasions. However, with the recent strong buying momentum, the stock was able to break above this long-standing resistance. Now that the resistance barrier has been surpassed, it signals a continuation of the bullish trend going forward. Traders will watch to see if the price finds support by holding above the former resistance level, which could now provide footing for further upside if retested as support. The sentiment is usually shifted in such cases.
The sellers fail to continue the selling pressure causing the buyers to eventually take control and form higher lows on the chart while approaching the resistance. The sellers observe this momentum shift and thereby convert their selling positions into buy side causing the price to break past the resistance and converting it into a support. This is how the shift in sentiment produces the new support that was previously a strong resistance.
Now let us look at an example of support reversal.

Here is a horizontal line marking a price level that previously acted as a strong floor, halting multiple declines in the past. This demonstrated that buyer demand was present at this point. However, in recent time periods as the uptrend advanced, sellers began to step in each time the price approached this level again. This caused the trend to pause or pull back temporarily. Now this familiar boundary, which once brought in buyers, is now providing selling pressure instead.
Buying sentiment is reduced in contrast to the selling pressure that causes the price to form lower highs and lower lows constantly on lower time frames. This way the confidence of the buyers is reduced converting their sentiment into selling side and eventually this combined selling pressure causes the support to break and convert it into a newly formed resistance. This way the reversal occurs after the breakdown.
How reliable are support & resistance?
Support and resistance levels are considered reliable but not foolproof indicators by most technical analysts. The reliability depends greatly on the stock, timeframe, volume, and other factors. Strong support/resistance formed over an extended timeframe, with tends to be more meaningful. Weak support/resistance that was formed quickly or sparsely traded is less reliable.
One factor is the timeframe in which longer-term support/resistance zones tend to be more reliable than short-term levels. For example, a stock price that struggles to break above a long-term range for months has formed strong resistance. This is likely to reject the price solidly on initial retests. However, an intraday support level that held for just a few hours before breaking is far less relevant. The longer buyers or sellers defend a level, the stronger the support or resistance.
With appropriate risk management and psychology in control, support and resistance levels are quite reliable. They do in turn give misleading signals as it is subjective to the traders. But on lower time frames, successful traders use support and resistance levels extensively in their analysis.
The number of touches also matters which means the more times a stock tests support/resistance without definitively breaking it, the more validity it gains. For example, if a stock price rallies to a prior high multiple times over several months but gets rejected there, this clearly has strong resistance. Just a single touch has far less significance.
Underlying market conditions affect reliability as well. Support/resistance tends to be more dependable in stable trending markets compared to choppy or volatile conditions. Key levels established in a high volatility environment are less reliable since wild swings easily breaches them.
What are the limitations of support & resistance?
One limitation of support and resistance is that identifying support and resistance levels contains an element of subjectivity. Technical analysts draw these zones slightly differently based on preferences like using closing prices versus intraday wicks or pivots. One trader draws support at Rs.50 while another sees it at Rs.49.85. This subjectivity means analysts sometimes misidentify or “over-optimize” support and resistance levels to fit past price action.
Another limitation is the static nature of horizontal support and resistance lines. Markets are dynamic, but these tools assume price will behave the same way each time it revisits a specific level. In reality, other shifting factors like volatility, trading volume or market conditions could alter how price behaves at historically significant levels.
Breakouts above resistance or breakdowns below support are widely used as trading signals. However, these breakouts frequently fail, as price reverses back within the prior trading range. Failed breakouts illustrate another limitation since they undermine the predictive power of these technical events.
Some technical indicators are prone to repainting, which means past signals change as new price data emerges. This repainting affects bounded indicators like Bollinger Bands that seek to identify support and resistance. Since the bands repaint as new prices alter historical volatility, bullish or bearish reversals off the bands disappear and undermine their reliability.
No indicators provide a trading holy grail, and traders should view technical analysis tools in probabilistic terms, not absolutes. Even reliable patterns fail frequently enough that overreliance on support and resistance or breakouts will cause mistakes. Technicals like these zones offer clues about market psychology—not infallible signals.
What are support & resistance zones?
Support and resistance zones are price levels or ranges on a stock chart that act as barriers, making it difficult for the price to break above or below that area. It indicates that there is more buying pressure as investors step in to buy shares and provide support, preventing the price from dropping further, when the price drops down to support. On the flipside, when the price rises up to resistance, this signals increased selling pressure as investors unload shares, creating resistance that prevents the price from rising higher.
These support and resistance zones form when a significant amount of buyers or sellers enter the market around a price area. This could occur when positive or negative events cause a surge of trading volume around a specific price range. The more times that a support or resistance zone is tested without giving way, the stronger it becomes, as more traders take note of that area and place buy or sell orders in anticipation of a bounce. Some ways traders identify support and resistance zones are by spotting horizontal price levels that connect multiple price highs or lows over time, observing trend lines that act as dynamic support and resistance, and watching for psychological round numbers like Rs.50 or Rs.100 which tend to attract more trading interest.

Which timeframe is best for support & resistance trading?
Daily time frame is an ideal for trading support and resistance levels in the stock market. This timeframe provides enough data to clearly see the underlying market structure and identify key support and resistance zones, while filtering out much of the market noise that confuses analysis on shorter timeframes. The daily time frame provides a very high-level view, making it hard to time entries and exits precisely, but if these daily levels are tested on lower time frames, one can time high probability trade setups.
Traders often consider monthly OHLC values as significant support and resistance levels that if tested on lower time frames offer significant trading interest, while very short timeframes like 5 minutes or 1 hour results in many false breakouts and whipsaws which undermine trading strategies. This then allows you to employ techniques like buying near identified support with a stop just below or shorting at resistance with a stop just above.
What tools are available for identifying support & resistance?
Technical analysis tools like trendlines, moving averages, pivot points and price action patterns all help traders identify potential support and resistance levels in the H4 timeframe.
Horizontal lines connecting daily time frame wick rejections and connecting psychological numbers offer straightforward method of identification of support and resistance levels.
Trendlines are a basic but powerful tool for spotting potential support and resistance. By connecting two or more price swing points, trendlines show areas where the price is likely to pause or reverse. Horizontal support and resistance levels also stand out clearly on the H4 charts. These are areas where the price has stalled and reversed multiple times in the past.
Moving averages like the 50 and 200 SMAs will often act as dynamic support and resistance, especially on the H4 timeframe. It indicates a potential support/resistance zone, when price approaches or trades around the moving average level. Levels like the daily open price also marks important intraday support/resistance, as round number handles ending in 00 or 50.
Pivot points are another useful indicator for spotting potential SR levels. The classic pivot along with the R1, R2, S1 and S2 levels are plotted on the H4 chart. It often struggles to continue trending and sees some consolidation, when price reaches pivot points. Volume profile visible ranges also highlight high volume areas that tend to attract price action.
In addition, classical chart patterns like double tops, head and shoulders patterns and wedge patterns all create potential reversal points that are seen as support and resistance. Finally, candlestick patterns like doji candles, shooting stars and evening star formations often occur at swing points where new support or resistance is established.
Using a confluence of some of these tools to identify SR zones on H4 makes for higher probability setups. The more tools that align with a potential support or resistance area, the more likely the price is to react at that level.


 Previous Article


![15 Investing.com Alternatives [Free+Paid] You Should Use in 2026](https://www.strike.money/wp-content/uploads/2026/04/Investing.com-Alternatives.jpg "15 Investing.com Alternatives [Free+Paid] You Should Use in 2026 142")
![15 TradeStation Alternatives [Free+Paid] You Should Use in 2026](https://www.strike.money/wp-content/uploads/2026/04/TradeStation-Alternatives.jpg "15 TradeStation Alternatives [Free+Paid] You Should Use in 2026 143")
![15 Chartink Alternatives [Free+Paid] You Should Use in 2026](https://www.strike.money/wp-content/uploads/2026/04/Chartlink-Alternatives.jpg "15 Chartink Alternatives [Free+Paid] You Should Use in 2026 144")
: Overview, 10 Types of Indicators, Settings for Different Markets 145")


 : Definition, Formula, calculation, Uses, Advantages Vs limitations 148")


: How We Used This 70/30 Indicator in 6 High Win-rate Strategies 151")


No Comments Yet.