The Fibonacci retracement is a method of technical analysis used by traders and investors to pinpoint probable support and resistance levels in the financial markets. The Fibonacci retracement bears the name of the Italian mathematician Leonardo Fibonacci. It is based on a sequence of numbers, and has important uses in different industries, including finance.
The Fibonacci retracement technical analysis indicator shows probable places of support or resistance using horizontal lines, during a price correction inside an established trend. It is predicated on the idea that financial markets frequently undergo brief reversals before continuing in the underlying trend’s direction. Finding levels where the price is most likely to retrace or pull back before continuing its initial movement is the main goal of Fibonacci retracement.
Traders must locate a recent swing high and swing low on a price chart in order to use the Fibonacci retracement. A downward move’s bottom is represented by the swing low, while an upward move’s top is represented by the swing high. The tool then determines particular retracement levels using a specified set of Fibonacci ratios.
What is a Fibonacci Retracement?
Fibonacci retracements are a technical analysis indicator used in trading and investing to locate probable levels of support and resistance on a price chart. The other term for Fibonacci retracement is “Fibonacci levels” or simply “Fibs”. Its foundation is the Fibonacci sequence, a mathematical pattern where each number equals the sum of the two numbers before it: 0, 1, 1, 2, 3, 5, 8, and so forth.Traders and analysts often refer to these retracement levels as Fibonacci levels or Fibs for short.

Horizontal lines are drawn at the significant Fibonacci ratios of 23.6%, 38.2%, 50%, 61.8%, and 100% to represent the Fibonacci retracement levels, on a price chart. These levels suggest possible regions where a price retracement or pullback could take place before the current trend resumes. The 38.2%, 50% and 61.8% retracement levels are the ones that are most frequently employed.
A Fibonacci retracement forecast is created by taking two extreme points on a chart and dividing the vertical distance by Fibonacci ratios. 0% is considered to be the start of the retracement, while 100% is a complete reversal to the original price before the move. Horizontal lines are drawn in the chart for these price levels to provide support and resistance levels
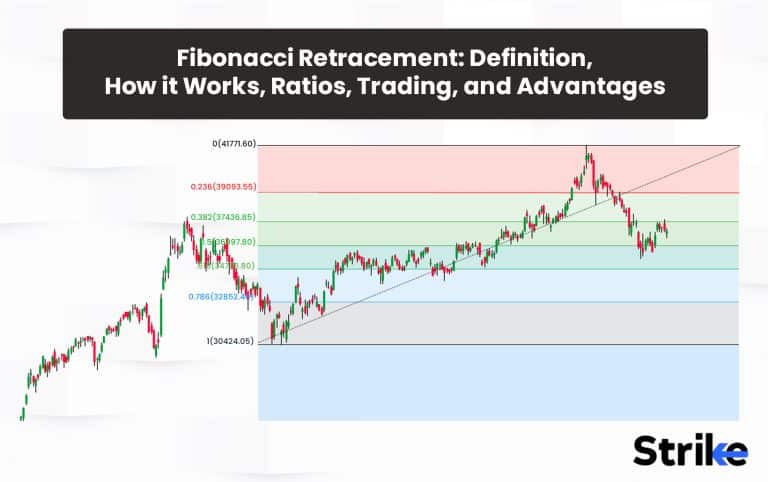
In the image below, you can see how the fib. Is plotted. A direction of one way trend is observed and the fib is marked. Observe how the price reacted from 38.2 % and 50 % respectively.

Traders recognise two important points on a price chart: a swing high and a swing low, to apply Fibonacci retracements. The swing low denotes a low point or bottom, whereas the swing high denotes a price peak. The Fibonacci retracement tool is then made by connecting these two points to form the retracement levels.
Who developed the Fibonacci Retracement?
The Fibonacci retracement was developed by Leonardo Pisano Fibonacci, commonly known as Fibonacci, it is where the idea of Fibonacci retracement originates. The Italian mathematician Fibonacci is credited with popularising the Hindu-Arabic numerical system in Europe, for the publication of his “Liber Abaci” (Book of Calculation) in 1202.
Fibonacci ratios were included in trading ideas by well-known technical analysts like Ralph Nelson Elliott in the 20th century, which led to an increase in the use of Fibonacci retracements in the financial markets. Traders now make more educated trading decisions by determining probable levels of support and resistance, with the help of the Fibonacci retracement tool.
The usage of Fibonacci ratios in financial markets did not originate with Fibonacci, who did not particularly invent the idea of Fibonacci retracement as it is used in contemporary trading and investment. The Fibonacci retracement technique was created as a part of technical analysis as traders and analysts started to understand the relevance of the Fibonacci numbers and ratios in price patterns and market movements.
Fibonacci (a mathematician from Pisa) although provided the groundwork for the mathematical sequence that bears his name, the development and use of Fibonacci retracements in trading and investing are the results of the cumulative efforts of many traders, analysts, and mathematicians over time.
How does a Fibonacci Retracement Work Technical Analysis?
The Fibonacci retracement indicator is a widely used technique during technical analysis that tries to identify support and resistance levels, as well as profit targets, based on the key Fibonacci ratios. It aims to anticipate where price reverses in an uptrend or downtrend by connecting two extreme points (swing high and swing low) and then dividing the vertical distance by the main Fib ratios – 23.6%, 38.2%, 50%, 61.8%.

The idea is these ratios reflect how far a prior move will retrace before resuming in the original direction.
So in an uptrend, if price retraces down to the 61.8% level of the prior advance and bounces, that tends to confirm the underlying bullish momentum remains intact. The reverse would apply in a downtrend – a retracement up to the 61.8% level of the prior down move that stalls and rolls over would suggest bearish control.
The 50% ratio level marks a key middle ground where you could expect either support/resistance in a retracement, or an eventual profit target for a swing trade if the retracement extends to that area before reversing back. Basically, Fib Retracements try to identify probable turning points for both entry targets and profit taking based on just these handful of ratios.

Observe, when a price is undergoing profit taking and selling, the moment it reaches 50% retracement, it is presumed to be in discount, a lot of activity is taking place at this point.
Fresh new entries for longs, Trailing stoplosses are hit, Trapped short sellers are exiting. So, these ratios provide price points where some activity will take place. Of course, in a one way fall or rise of markets, these fib’s wont work.
Like all indicators, Fib levels are not guaranteed to work perfectly every time. Price action can overshoot or fail to reach those exact ratio values. So Fib Retracements should be used along with other signals of support/resistance to improve accuracy. But overall, they remain a popular and often effective tool for technical traders, especially for identifying reversal points and profit targets.
Why is Fibonacci Retracement Important in Technical Analysis?
The Fibonacci Retracement plays a crucial role in technical analysis as it helps traders to identify key price points that will have some probable chance of reaction. The Fibonacci retracement is significant in technical analysis because of the following three reasons.
Finding Potential Support and Resistance Levels: Fibonacci retracement levels serve as places of support and resistance, in a price chart. These ratios may reflect significant market behaviour. These levels are used by traders to forecast price reversals or regions where the price is likely to pause or change course. Trading professionals can choose better entry and exit points for trades by spotting these levels.
Confirmation of Trend Lines: Fibonacci retracement levels can serve as confirmation for other technical analysis techniques and patterns, such as price patterns and trend reversals. A possible support zone gains power, for instance, if a price chart displays a bullish trend and a Fibonacci retracement level aligns with a trend line or a previous support level. The potential resistance zone is also strengthened if a bearish trend is present and a Fibonacci retracement level coincides with a resistance level or a downward trend line. The trader feel more confident in their analyses and choices after receiving this confirmation.
Supporting Risk Management and Stop Loss Placement: Fibonacci retracement levels are ratios which may help in placing safer stoplosses to avoid stop hunting, supporting risk management. Traders set their stop-loss orders a little below or above a Fibonacci retracement level depending on whether they are buying or selling. Fibonacci retracements enable traders to control their risk, by placing stop-loss levels at logical positions that take into account anticipated price reversals and lessen the chance of premature stop-outs.
Fibonacci Retracements work fine even for short term traders: Fibonacci retracements represent key ratios of any impulsive moves. These impulsive moves that show significant flow or direction can be observed on lower time frames and thus day traders and scalpers use this tool to find entries on these ratios to anticipate reaction or fluctuations.
The Fibonacci retracement is widely used in technical analysis because of its simplicity and versatility. Traders and analysts widely utilise this tool to identify potential areas of price reversal or continuation, aiding in making informed decisions regarding entry and exit points for trades.
How to determine the Sequence and Ratios in a Fibonacci Retracement?
The mathematical features of the Fibonacci sequence are used to derive the Fibonacci sequence and ratios employed in Fibonacci retracement levels. Each number after the initial pair of digits (0 and 1) is the sum of the two numbers before it. Use these steps to calculate a Fibonacci retracement’s ratios and order, beginning with 0 and 1 put the digits 0 and 1 at the start of the Fibonacci series.
Determine the Upcoming Number: Add the previous two numbers, to find the following number. Since 0 + 1 = 1, the following number is 1. The sequence then becomes 0, 1, 1, 2, because 1 plus 1 equals 2.
Continue the Process: Repeat the method to obtain the following number by adding the last two numbers in the series. Thus, a continuous series of numbers is produced.
Calculate Ratios: Divide each number in the sequence by the number after it to determine the Fibonacci ratios utilised in Fibonacci retracement levels.
Plot Fibonacci Retracement Levels: Plot Fibonacci retracement levels by using charting software or a tool that supports Fibonacci retracements, after calculating the ratios. The software will automatically plot horizontal lines at the Fibonacci retracement levels based on the ratios if a swing high and swing low are connected on the price chart.
The golden ratio (or its related ratios, such as 38.2% and 61.8%) is used to determine potential retracement levels in a price trend. These levels mark potential support or resistance areas where price will pause, reverse, or continue its already adopted trend. Traders and analysts utilise this rat in conjunction with the Fibonacci retracement tool to identify key levels that influence buying or selling decisions.
The Fibonacci sequence and ratios are theoretically determined, but their use in financial markets depends on the premise that market participants behave in ways that correspond to these patterns.
What are the Key Ratios in Fibonacci Retracement?
In Fibonacci retracement, several key ratios are commonly used to identify potential levels of support and resistance. These ratios are derived from the mathematical properties of the Fibonacci sequence. Following is a detailed description of the top five key Ratios in Fibonacci Retracement.
- 23.6% (0.236): This ratio is found by dividing a number in the Fibonacci sequence by the number two places ahead. For example, dividing 21 by 89 results in approximately 0.236. This ratio is often rounded to 23.6%. Traders consider the 23.6% retracement level a shallow retracement and expect the price to potentially find support or resistance in this area.
- 38.2% (0.382): The 38.2% ratio is obtained by dividing a number in the Fibonacci sequence by the number one place ahead. For instance, dividing 21 by 55 gives approximately 0.382. This ratio is commonly rounded to 38.2%. Traders see the 38.2% retracement level as a significant level that act as support or resistance.
- 50% (0.5): The 50% retracement level is not derived directly from the Fibonacci sequence, but it is considered significant in technical analysis. It represents a half-retracement of the initial price move. Traders often pay attention to this level, as it can act as a key support or resistance area.
- 61.8% (0.618): The 61.8% ratio is derived by dividing a number in the Fibonacci sequence by the number preceding it. For example, dividing 21 by 13 results in approximately 1.618, which is commonly rounded to 61.8%. Traders consider the 61.8% retracement level a critical level, often referred to as the “golden ratio.” It is believed to be a potential area for the price to reverse and continue in the direction of the prevailing trend.
- 78.6%: The 78.6% level is not directly a part of the standard Fibonacci retracement levels, although some traders occasionally use it as a personal preference or in combination with other indicators.
- 100%: The 100% level represents the complete range of the initial price move, while not a ratio in the Fibonacci sequence. It signifies a retracement that completely erases the preceding move. Traders often pay attention to this level as a potential target for price retracements.
These ratios are used to draw horizontal lines on a price chart, indicating potential levels of support and resistance where the price pauses or reverses. The strongest and most commonly used levels are considered to be the 38.2%, 50%, and 61.8% levels, in the Fibonacci retracement. Traders utilise these levels to make trading decisions, such as identifying entry or exit points, setting stop-loss orders, or determining profit targets.
How do traders use Fibonacci Retracement for entry and exit points?
Fibonacci retracement levels are used by traders to pinpoint potential entry and exit points for their trades. They can be applied on all the capital markets. The use of Fibonacci retracement for entry and exit positions is briefly explained in the following five points.
An impulsive move that seems logical is observed and extreme points are plotted. These extreme points are the start and end of a move. This impulsive move can be a breakout or can be any significant move. A significant move indicates a clean move of price in a certain direction.
Entry Points: Traders frequently hunt for entry points close to Fibonacci retracement levels plotted on the impulsive move observed. that coincide with other technical analysis instruments or indicators.
Pullback Entries: Traders watch for a pullback or retracement in an upswing or a downswing that leads to a Fibonacci retracement level. If an upswing is plotted for fib retracements, traders can start a long position close to Fibonacci level’s support level in anticipation of the rising trend picking up again. Traders also look for a retracement towards a Fibonacci retracement level as a potential opportunity for short-selling during a slump.

Fibonacci levels coming together: Traders view the coming together of several Fibonacci retracement levels as a more reliable sign of a probable entry point. Different Fibonacci retracement levels, such as 38.2%, 50%, and 61.8%, are made more significant and act as a stronger entry signal if they closely coincide with other technical indicators, such as trend lines, moving averages, or chart patterns.
Exit Points: For risk management and profit maximisation, identifying exit points is essential. Retracement levels are also used to locate probable exits.
Profit Objectives: Traders frequently establish profit objectives close to upcoming Fibonacci retracement levels. Traders set profit goals at the following Fibonacci level or a previous swing high/low if the price retraced to a particular Fibonacci level and then resumed the trend.
Trailing Stops: Fibonacci retracement levels can be used by traders to modify their trailing stop-loss orders. They can adjust the stop-loss level to be slightly below the most recent swing low (in an uptrend) or above the most recent swing high (in a downtrend) that correlates with a Fibonacci level as the price moves favourably in that direction. Traders preserve their gains while allowing the transaction to continue, by using a trailing stop strategy.
Reversal Signals: This is a sign that the trend is about to reverse, if the price reaches a Fibonacci retracement level but does not move further in the desired direction. If the price fails to surpass a crucial Fibonacci level, indicating a potential trend reversal, traders think about closing out their positions or tightening their stop-loss order.
The above steps explain how the Fibonacci retracement levels are used by traders to determine entry and exit points in a trade. This helps in easily determining the change in the market sentiments, which helps traders to make profitable decisions.
What is the best trading strategy for the Fibonacci Retracement?
The ideal trading strategy for Fibonacci retracement combines the Fibonacci levels with other technical analysis tools and indicators, in order to maximise the possibility of profitable trades. Fibonacci retracement levels should only be used as a component of a full trading strategy, not as the sole basis for trading choices. Traders can confirm the probable support and resistance levels revealed by the Fibonacci retracement by combining additional tools like trend lines, moving averages, and candlestick patterns.
A more complete understanding of the trade setting can also be obtained by taking into account the general market context and fundamental considerations. Setting proper stop-loss orders and profit goals based on the discovered Fibonacci levels is essential for risk management. It’s crucial to regularly monitor deals and make adjustments as fresh price information becomes available. The best trading strategy for Fibonacci retracement is one that incorporates multiple analysis methods, changes with the market as it develops, and fits the risk appetite and trading style of the particular trader.
When is the best time to use the Fibonacci Retracement?
Fibonacci retracement is most effective, when the market is in a clear and well-defined trend. The Fibonacci retracement performs best under these conditions, whether a market is in an upswing or a decline. It is less successful, in volatile or sideways markets where the price lacks a distinct direction. The following are the three best situations where Fibonacci retracement will be especially helpful.
- After a Significant Price Move: Traders can use Fibonacci retracement to determine potential levels of retracement when the price has seen a significant move in one direction. This is frequently observed following a strong trend or a rapid price change.
- Near Key Support and Resistance Levels: It produces extra confluence, when the Fibonacci retracement lines up with other important support or resistance levels. For instance, the significance of a Fibonacci retracement level is increased if it corresponds with a previous swing high or low, a trendline, or a horizontal support or resistance level.
- Confirming Reversal or Continuation Pattern: Fibonacci retracement is a tool that can be used to verify the validity of reversal or continuation patterns. A probable trend reversal can gain more support, for instance, if a bullish reversal pattern develops close to a Fibonacci retracement level. A continuation pattern, such as a flag or a pennant, that appears close to a Fibonacci level increases the likelihood that the trend will continue.
The signals produced by the Fibonacci retracement should be confirmed by other technical analysis tools, such as trendlines, candlestick patterns, or momentum indicators. Furthermore, market circumstances and price behaviour are subject to change, so it is critical to modify and adapt the Fibonacci levels as soon as new price information becomes available. Effective use of the Fibonacci retracement requires regular trade monitoring and reevaluation.
How to combine Fibonacci Retracement with other Indicators for better results?
Your analysis and trading decisions can be more effective if you combine the Fibonacci retracement with other indicators. Consider combining the Fibonacci retracement with the following five indicators listed below, for improved results.
- Trend Confirmation: Confirm the trend’s direction by using trend indicators like moving averages, trendlines, or the Average Directional Index (ADX). Look for convergence between the trend indicators and Fibonacci retracement levels, to reinforce your analysis.
- Oscillators for Oversold/Overbought Conditions: Use Fibonacci retracement with oscillators like the Relative Strength Index (RSI) or Stochastic Oscillator, to detect possible overbought or oversold conditions. When a Fibonacci retracement level and an extreme oscillator reading appear together, the trend is reversing or continuing.
- Candlestick Patterns: Watch out for candlestick patterns that appear close to Fibonacci retracement levels. Additional evidence of potential trend reversals or continuations be seen in patterns like engulfing patterns, or hammer.
- Volume Analysis: Use Fibonacci retracement in conjunction with volume indicators like the Volume Weighted Average Price (VWAP) or On-Balance Volume (OBV). Volume can confirm the robustness of Fibonacci support or resistance levels and signal future breakouts or reversals.
- Multiple Time Frame Analysis: Use Fibonacci retracement on many time frames, to get a bigger picture. Fibonacci retracement levels from various time frames are given greater significance when they closely coincide.
Concentrate on using a small number of complementary indicators that support your trading philosophy and deliver reliable indications. Evaluate your chosen indicators’ performance on a regular basis and change your strategy as market conditions change.
Can Fibonacci Retracement be Used with Bollinger Bands?
Yes, using Bollinger Bands and Fibonacci retracements together can improve trade analysis. Bollinger Bands are volatility indicators with an upper and lower band based on standard deviations and a middle band that is typically a moving average. Traders can spot probable support and resistance levels at the Bollinger Bands’ outer bands when paired with a Fibonacci retracement.
Does MACD work well with the Fibonacci Retracement?
Yes, the Fibonacci retracement and the Moving Average Convergence Divergence (MACD) indicator is used successfully. Fibonacci retracement reveals probable levels of support and resistance, whereas MACD assists in identifying shifts in momentum and trend direction.
The MACD indicator is used by traders to confirm the strength of a trend and identify potential entry or exit points by combining it with Fibonacci retracement levels. The reliability of trading signals is increased when the MACD aligns with a Fibonacci retracement level since it can offer additional confirmation.
How can Fibonacci Retracement be used to set stop-loss levels and manage risk?
Effective risk management is achieved by using Fibonacci retracement to define stop-loss levels. The five steps used to set stop-loss levels and manage risk in the Fibonacci Retracement are listed below.
Use the Fibonacci retracement to locate major retracement levels on the price chart that correspond to potential places of support or resistance. Stop-loss orders can be placed at these levels if they seem reasonable.
Set the stop-loss order slightly below the Fibonacci retracement level in an uptrend or just above the level in a downtrend, depending on the trade’s direction. By doing this, a probable trend reversal is indicated if the price breaks below the retracement level, and the stop-loss order aids in limiting losses.
In the image uploaded below, one can observe how an impulse move (in this case, a downmove) is identified and a fibonacci retracement tool is applied. The tool reflects important fib ratios and these provide sufficient information to take trade, place safer stop losses, ensures better risk:reward and also provide a solution to trailing stoploss.

In addition to the Fibonacci retracement levels, consider the prior swing highs or lows that coincide with the retracement levels. Placing the stop-loss order just slightly beyond these levels adds an added layer of safety because these levels frequently serve as strong support or resistance zones.
Modify the stop-loss order as the price moves in your favour, for the purpose of protecting profits and reducing risk, Traders can adjust the stop-loss level to the following Fibonacci retracement level or a recent swing high/low, to effectively trail the stop and lock in profits.
Consider the risk-reward ratio, before making a deal. The possible target profit should be used to compare the distance between the entry point and the stop-loss level. The ideal risk-reward ratio is one in which the potential reward surpasses the risk.
It’s crucial to keep in mind that establishing stop-loss levels is only a portion of an overall risk management plan, and traders should also take their own risk tolerance, transaction size, and market volatility into account.
What are the common mistakes traders make when using Fibonacci Retracement?
Fibonacci retracement traders make a number of typical errors. Understanding these dangers is essential for avoiding them and making better trading decisions. The following are three common errors traders frequently make while utilising Fibonacci retracement.
Incorrect Placement: Fibonacci retracement levels should not be placed on inaccurate price swings. This is a typical error. Retracement levels that are incorrect and reliable trading signals result from this.
Incorrect plotting of Fibonacci levels: Market participants often misunderstand the tool. They end up marking the tool on the retracements. The tool is supposed to be plotted on the significant impulsive moves. Incorrect trade signals are generated by plotting them on minor corrections and retracements.
Over-reliance on Fibonacci Levels: Relying entirely on Fibonacci retracement levels without taking into account additional technical analysis tools or indicators is another error. The Fibonacci retracement must be used in conjunction with other confirmation signals, such as trendlines, moving averages, or candlestick patterns, to improve the accuracy of trade setups,
Not Making Volatility Adjustments: Market volatility can affect how well Fibonacci retracement levels work. Inappropriate placement of support/resistance levels and erroneous trading signals result from failing to modify the Fibonacci levels for highly volatile or low-volatility markets.
Traders should become knowledgeable about the right Fibonacci retracement methods, gain expertise through practice, and create a thorough trading strategy that includes a variety of analysis tools and risk management guidelines, to avoid making these errors.
Do you draw Fibonacci Retracement from low to high?
Yes, the Fibonacci retracement is normally drawn from low to high, in an uptrend. The swing high or low serves as the beginning point depending on which way the trend is going. The Fibonacci retracement tool is used by traders to plot the retracement levels once they have determined the important swing points. They are able to pinpoint potential levels of support and resistance for potential entry and departure positions in keeping with the current trend.
Can Fibonacci Retracement be used in different financial markets?
Yes, Fibonacci retracement is used in various financial markets, including stocks, forex, commodities, and cryptocurrencies. The underlying principles of Fibonacci ratios and retracement levels is applied to any market that exhibits price trends and pullbacks.
What are the advantages of using Fibonacci Retracement in trading?
The Fibonacci retracement provides practical advantages such as simplicity and indicating market sentiments in trading, which can help traders make better choices. The top five advantages of the Fibonacci retracement in trading are listed below.
- Finding Possible Levels of Support and Resistance: The Fibonacci retracement aids traders in finding possible levels of support and resistance within a price chart. These levels can serve as areas where price reversals or trend continuations take place because they are based on mathematical ratios drawn from the Fibonacci sequence. Trading professionals can better predict potential turning points and decide when to enter and leave a position by identifying these levels.
- Objective and Unbiased Tool: The Fibonacci retracement is a frequently used, unbiased tool that is objective and used by many traders. It doesn’t rely on subjective interpretation because it is based on mathematical concepts. This makes it a trustworthy and consistent tool for analysing price changes and locating crucial market levels.
- A Framework for Price Corrections is provided: Markets rarely move directly forward; instead, they frequently see price corrections or retracements. The Fibonacci retracement provides a foundation for figuring out how big these corrections are. Traders can determine the probable length of a retracement and predict where the correction will conclude by applying Fibonacci levels to large price swings, allowing for smart entry or exit opportunities.
- Confluence with Other Technical Analysis Tools: The Fibonacci retracement is used in conjunction with other technical analysis tools to raise the confirmation of the trade to make it profitable. Fibonacci levels gain greater significance and improve the overall trading signal when they line up with other indicators like trendlines, moving averages, or chart patterns.
- Risk Management and Stop-Loss Placement: The Fibonacci retracement helps traders identify suitable stop-loss levels for risk management and stop-loss placement. Trading professionals can specify their risk and safeguard their capital by placing stop-loss orders beyond important Fibonacci levels. This methodical approach to risk management aids traders in maintaining control and preventing big losses.
The ability to recognise possible turning moments, offer objective analysis, assist in risk management, and integrate well with other technical analysis tools are the main benefits of employing Fibonacci retracement in trading. Traders can improve their ability to comprehend market dynamics and make wiser trading decisions by using Fibonacci retracement in their trading approach.
What are the limitations of using Fibonacci Retracement in trading?
The Fibonacci Retracement tool plots percentage retracement levels based on the key Fibonacci ratios of 23.6%, 38.2%, 50%, 61.8% and 100%. While useful, traders should keep these limitations in mind.
Retracement levels are not precise: They provide estimated support and resistance zones rather than exact price levels. The market may stop and reverse at other prices.
Levels are subjective: Traders may draw Fibonacci Retracements differently, leading to different price levels. There are no definitive rules on placement.
Works best in some markets: Fibonacci works better in trending assets or markets. They generate enough misleading signals in volatile or choppy markets.
Ignores other factors: Fibonacci only considers past price action, ignoring other market forces like news and fundamentals.
Not a timing indicator: It doesn’t forecast when price may reach target levels or provide trade signals.
Fibonacci Retracement is a useful tool but should be used with other analysis like price action, indicators, fundamentals. Traders should treat levels as guideposts rather than absolutes. Combining Fibonacci with discretion and confirmations tends to yield the best results.
Do professional traders use the Fibonacci Retracement?
Yes, Professional traders do use the fibonacci Retracement. Professional Derivative traders who work in Lower Time frames like 1 min, 3 min 5 min have fibonacci retracement as their tool to identify price points for precise entries, stoplosses. As the Fib. Tool provides safer stoplosses, professionals are inhabited using the mathematically derived tool.
Professional swing traders also use the tool to protect their profits by placing trailing stoplosses.
However, as already mentioned, it isn’t a tool that is supposed to be relied on completely.
Is Fibonacci Retracement for beginners?
Yes, Beginners can use Fibonacci Retracement. But as the usage of this tool is totally subjective, it is important to learn about swing highs and lows, significant impulsive moves and differentiation between a trendy and a choppy market to avoid plotting the Fibonacci Retracements incorrectly. It is advised to increase chart time and practice placing Fibonacci retracement in live markets to experience how price reacts to the ratios.
Is Fibonacci Retracement a good strategy?
Fibonacci Retracements in itself is not a complete trading strategy. It is a mere mathematically derived tool that assists in the existing strategy to generate better confluence and confirmation about a trade setup or an opportunity. Other factors must be considered alongside the fibs for better clarity about the current state of the market.
Does Fibonacci Retracement work for day trading?
No, For day trading, Fibonacci has limited usefulness on its own. Intraday moves tend to be fast and dynamic, while Fibonacci works better on longer timeframes.
While, on Lower Time Frames below 5minutes, the tool can be useful. But it also has a lot of chances of generating misleading signals thus strict risk management should be followed. If followed, the trades generated through Fib. Retracement can generate higher Risk:Reward winning trades by combining it with other indicators or price action and candlestick patterns.
What is the difference between Fibonacci Retracement and Moving Average?
The Fibonacci retracement serves the purpose of primarily identifying probable levels of support and resistance in a price chart. Traders identify potential regions, using this information where a price retracement or pullback ceases and the trend resumes. Moving averages, on the other hand, are used to smear out price data and determine the general trend’s direction. The momentum of the trend and potential turning points are highlighted by the moving average line that they provide. This line shows the average price over a given period.
Moving averages are computed using price data over a predetermined time period, whereas Fibonacci retracement is based on the mathematical ratios generated from the Fibonacci sequence. Fibonacci retracement calculates certain percentage levels from the Fibonacci sequence, such as 23.6%, 38.2%, 50%, and 61.8%, to pinpoint potential support and resistance levels. Moving averages, on the other hand, draws a line on the price chart based on the average price over a predetermined number of periods.
Moving averages and Fibonacci Retracements can be used together as well to generate robust trade signals as it will provide a better confirmation of a trade setup.
Shorter-term market fluctuations or particular swings within a trend are typically covered by Fibonacci retracement levels. The Fibonacci retracement is frequently used by traders on daily or intraday charts. Moving averages, on the other hand, are used with a range of time frames, including shorter, intermediate and longer-term charts.


 Previous Article


![15 Investing.com Alternatives [Free+Paid] You Should Use in 2026](https://www.strike.money/wp-content/uploads/2026/04/Investing.com-Alternatives.jpg "15 Investing.com Alternatives [Free+Paid] You Should Use in 2026 76")
![15 TradeStation Alternatives [Free+Paid] You Should Use in 2026](https://www.strike.money/wp-content/uploads/2026/04/TradeStation-Alternatives.jpg "15 TradeStation Alternatives [Free+Paid] You Should Use in 2026 77")
![15 Chartink Alternatives [Free+Paid] You Should Use in 2026](https://www.strike.money/wp-content/uploads/2026/04/Chartlink-Alternatives.jpg "15 Chartink Alternatives [Free+Paid] You Should Use in 2026 78")
: Overview, 10 Types of Indicators, Settings for Different Markets 79")


 : Definition, Formula, calculation, Uses, Advantages Vs limitations 82")


: How We Used This 70/30 Indicator in 6 High Win-rate Strategies 85")


No Comments Yet.