The Ichimoku Cloud indicator is a package of 5 indicators that help a trader navigate support and resistance on a price chart. The Ichimoku Cloud technical indicator was developed by a Japanese journalist Goichi Hosada in the 1930s. Ichimoku Cloud also shows other things such as the trend direction and momentum of a stock.
The Ichimoku cloud uses five different indicators to provide valuable insights of a price chart. It includes a 9-period moving average (Conversion Line), a 26-period moving average (Base Line), an average of these two averages (Leading Span A), a 52-period average (Leading Span B) and a lagging closing price line (Lagging span). All of these components together generate clear trading signals. The stock, generally, is considered bullish when the price is trading above the cloud, and it is considered bearish when the price goes below the cloud.
What exactly is Ichimoku Cloud?
The Ichimoku Cloud is a collection of indicators which show support and resistance levels as well as it helps traders identify the trend direction and momentum of a stock in one view. The Ichimoku Cloud is considered to be amongst very few indicators that provide valuable insights from the price chart within a single indicator.

It provides traders with various metrics and signals on one chart, based on 5 main components:
Tenkan-sen: Also called the conversion line, it is the mid-point of the 9-day high and low.
Kijun-sen: Also called the baseline, it is the mid-point of the 26-day high and low.
Senkou Span A: This is the midpoint between the conversion line and the baseline, plotted forwards 26 periods.
Senkou Span B: This is the midpoint between the 52-period high and low, plotted forwards 26 periods.
Chikou Span: This plots the current closing price shifted back 26 periods.
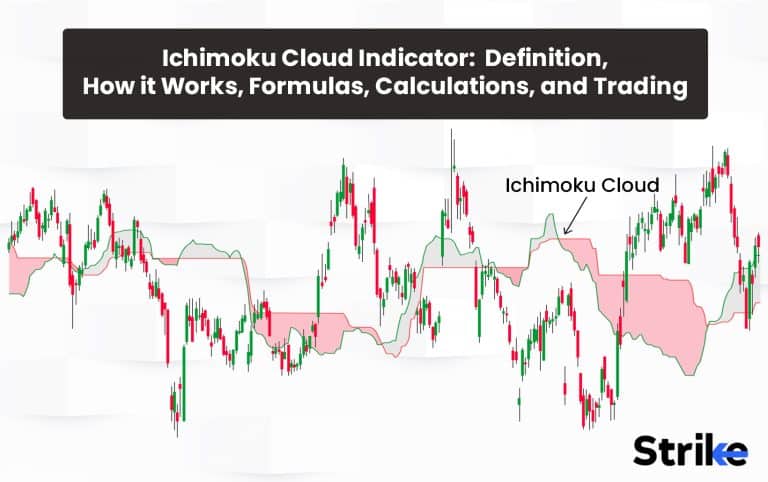
The area between Senkou Span A and B forms the Ichimoku cloud, representing support and resistance zones. The zones tend to work best when markets are trending. The indicator provides trading signals based on crossovers of the lines and the price interaction with the cloud.
The averages used in Ichimoku Cloud differ from the moving average. A simple moving average takes only the closing price over a specific number of periods into consideration, while the Ichimoku averages calculate the high and low of the price over a specific number of periods.
What is the other term for the Ichimoku Cloud Indicator?
The other term used for the Ichimoku Cloud indicator is its real Japanese name “Ichimoku Kinko Hyo”. “Ichimoku Kinko Hyo” means “one glance equilibrium chart” or “chart at a glance”. This term was first coined by a Japanese journalist named Goichi Hosoda, also known as “Ichimoku Sanjin”.
What is the origin of the Ichimoku Cloud?
The Ichimoku Cloud indicator was invented by a Japanese journalist called Goichi Hosoda in the late 1930s. Goichi Hosado, however, made the detailed principles and applications of the Ichimoku Cloud publicly available in the 1960s through his book “Ichimoku Kinko Hyo”. Many Japanese trading floors have adopted this indicator since then.
Goichi Hosoda invested in Ichimoku Cloud to capture different aspects of the price chart in one glance. Hosoda’s aim was to provide a single chart that covered different market dynamics at the same time to help traders find better and clearer trading opportunities.
How does the Ichimoku Cloud indicator work in Technical Analysis?
The Ichimoku Cloud indicator works by providing detailed price chart insights at a glance. The Ichimoku Cloud indicator uses 5 different averages and plots them on the price chart. It uses the same data points to compute a “Cloud” which helps traders in predicting future price movements.

Ichimoku Cloud provides clear signals for determining the trend of a stock. The indicator considers the stock to be bullish when the price of the stock is trading above the cloud, and the stock is considered bearish when the price of the stock is trading below the cloud.
The conversion line and Base line within the Ichimoku cloud act as the potential support and resistance levels of stock. Traders can take a buy/sell trade at the time of a crossover or if the price breaches either of the lines.
The cloud changes its colour to green whenever the Leading Span A goes above the Leading Span B. This shows a bullish sentiment. A thicker cloud indicates a strong trend within the stock, while a thin cloud shows the weakness of the trend.
Traders can make effective trading decisions by analysing the all components of the Ichimoku Cloud Indicator. The Ichimoku Cloud indicator provides a simple way to assess the overall market dynamics.
Why is the Ichimoku Cloud important in Technical Analysis?
The Ichimoku Cloud is an important indicator in technical analysis because it covers detailed aspects of a price chart. The Ichimoku Cloud eases the job of a trader as it helps them find areas of importance, trend direction, and the strength of the price movement. The Ichimoku Cloud is important in technical analysis for three more reasons.
- The Ichimoku Cloud offers detailed insights into a price chart by analysing different market dynamics. This helps traders gain effective and clear information about market conditions.
- The leading Span A and leading Span B of the Ichimoku Cloud project future support and resistance levels on the price chart. This helps the traders get a better idea of their take profit and stop loss levels.
- The Ichimoku Cloud generates effective and clear trading signals when the price breaks below or above its cloud. Traders take a bullish trade when the price breaks above the cloud, and vice versa. The Ichimoku Cloud indicator covers detailed aspects of the market and is also simple to understand and follow.
What are the Formulas of the Ichimoku Cloud?
The Ichimoku Cloud consists of 5 averages. These averages together help a trader in getting a significant view of the overall market conditions. Understanding the formulas behind these averages can help you get a better understanding of how this indicator generates trading signals. Following are the formulas used for calculating the Ichimoku Cloud.
1.Tenkan-Sen Line:
The Tenkan-Sen (Conversion line) is the midpoint of the last 9 candles or periods. It is calculated by adding the highest high and the lowest low of the last 9 periods and dividing it by 2. Tenkan-Sen Line provides a short-term view of the price movement and it can signal potential trend reversals in the market.
The formula for calculating the Tenkan-Sen line –
(Highest high of 9 periods + Lowest low of 9 periods) / 2
2. Kijun-Sen Line:
The Kijun-Sen (Base Line) is the midpoint of the last 26 candles or periods. It is calculated by adding the highest high and the lowest low of the last 26 periods and dividing it by 2. Kijun-Sen Line provides a medium-term view of the price movement and acts as a support/resistance level on a price chart.
The formula for calculating the Kijun-Sen Line –
(Highest high of 26 periods + Lowest low of 26 periods) / 2
3. Senkou Span A Line:
The Senkou Span A Line (Leading Span A) is the average of the Tenkan-Sen and Kijun-Sen lines, and it is plotted 26 periods ahead. Senkou Span A Line acts as the first boundary of the Ichimoku Cloud and it is a forward looking indicator which represents the support/resistance levels on a price chart.
The formula for calculating the Senkou Span A Line –
(Tenkan-sen + Kijun-sen) / 2
4. Senkou Span B line:
The Senkou Span B line (Leading Span B) is calculated by adding the highest high and the lowest low of the last 52 periods. It is plotted 26 periods ahead. Senkou Span B is the second boundary of the Ichimoku Cloud.
The formula for calculating the Senkou Span B line –
(Highest high of 52 periods + Lowest low of 52 periods) / 2
5. Chikou Span Line:
The Chikou Span Line (Lagging span line) is the closing price plotted 26 periods backwards on the price chart. Chikou Span Line provides a visual representation of the historical price data on a price chart. A Chikou Span Line above the current price represents a bullish sentiment while a Chikou Span line below the current price shows bearish sentiment.
The formula for calculating the Chikou Span line –
(Close plotted 26 periods in the past)
The Ichimoku cloud uses these formulas to project support and resistance levels. These formulas also help in projecting the potential trend direction and determining the strength of the ongoing price movement.
How to Calculate the Ichimoku Cloud?
The Ichimoku Cloud is a collection of averages that helps a trader in getting a comprehensive view of the market. You can plot the Ichimoku Cloud on any charting platform for free. Here is a 5-step guide for you to calculate the values of each component of the Ichimoku cloud.
- Calculate the Conversion Line and Base Line with the help of the formula above.
- Calculate the average of the Conversion Line and Base line and put this value ahead by 26 periods to get Leading Span A.
- Calculate the Leading Span B with the help of the formula above and plot this value ahead by 26 periods.
- Plot the closing price 26 periods before for Lagging Span.
- Plot the space between Leading Span A and Leading Span B to create the cloud.
It’s crucial to know about the parameters used in calculating this indicator. You can also adjust them according to your personal preferences.
How to Read Ichimoku Cloud?
Reading Ichimoku Cloud can look a bit complex at the start, but it is very simple to understand once you get to know its applications and basic principles. Here is how to interpret ichimoku cloud.

- The price trading above the cloud represents a stock’s bullishness and whenever the price is trading below the cloud, it shows a sign of weakness in the stock.
- The Conversion Line and Base line act as the lines of support and resistance. Traders have a potential trading opportunity whenever the price breaks these levels.
- The trend is considered bullish when the price breaks through the cloud from below. Similarly, the trend is considered bearish when the price breaks the cloud from above.
- Leading Span A and Leading Span B are the projections of the support and resistance zones of the future. Traders can find a potential trading opportunity whenever the price interacts with these levels.
The lagging span is used to confirm the signals generated by the other averages of the Ichimoku Cloud.
Combining these readings can help a trader use the Ichimoku cloud indicator more effectively. Remember, practice and consistency are the key components to mastering the Ichimoku Cloud.
How to use Ichimoku Cloud in Trading?
The Ichimoku Cloud can look difficult to use at the start but it is very simple once you get to know the basic principles and applications of the indicator. Here’s how you can trade while using the Ichimoku cloud indicator in 3 simple steps.

- Crossovers:
Traders can find a potential trade opportunity when the Conversion line goes above or below the Baseline. Traders can take a bullish trade when the conversion line breaks the Baseline from below and vice versa. Example is provided in the image above.
- Cloud breaks:
A Cloud break is a common Ichimoku Cloud trading strategy. Traders take a bullish trade when the price breaks the cloud from below and a bearish trade when the price breaks the cloud from above. Example is provided in the image above.
- Identifying support and resistance:
Both the Conversion line and the Baseline act as levels of support and resistance. Additionally, Leading Span A and Leading Span B also forecast the potential support and resistance levels 26 periods into the future. Example is provided in the image above.
Always remember to combine any technical tool with other tools to enhance the quality of your analysis. It is recommended to back-test these strategies till you are familiar with them.
What trading strategy works well with Ichimoku Cloud?
There are hundreds of trading strategies that work well while using Ichimoku Cloud. The strategy we are going to talk about utilises every component of the Ichimoku very well, is easy to understand, and has effective results. Following are the conditions of this trading strategy in a bullish scenario.
- The Conversion line must be above the Baseline.
- The Lagging span must be above the cloud.
- The price must break above the cloud.

The image above shows a familiar scenario where all three conditions are met.
This setup is also effective in a bearish scenario. You will just have to reverse the conditions according to the market sentiment.
Can short-term and long-term trading strategies use the Ichimoku Cloud?
Yes, you can take short-term as well as long-term trades while using the Ichimoku Cloud indicator. The Ichimoku Cloud indicator’s versatility adapts to changing timeframes and trading styles. You can use Ichimoku Cloud for understanding the overall sentiment and overview of market participants. Short term traders and investors do trade using Ichimoku cloud.
What timeframe is the best to trade using Ichimoku Cloud?
There is not a single best time frame to trade while using the Ichimoku Cloud. However, it is recommended to use the Ichimoku Cloud on longer time frames such as 4h, daily, weekly. This indicator is a bit erratic in shorter time-frames and will not be as effective as it is in a longer time frame.
What are the main trading signals that the Ichimoku Cloud generates?
Trading signals help traders in analysing the different aspects of the market effectively and make informed trading decisions. Following are three of the main trading signals that the Ichimoku Cloud generates.
- Cloud Breakout:
A bullish cloud breakout happens when the price breaks above the cloud. Similarly, a bearish cloud breakout happens when the price breaks below the cloud.
- The Conversion Line and the Baseline crossover:
A potential bullish trade opportunity is generated when the conversion line crosses above the baseline. Similarly, a bearish trade opportunity is generated when the conversion line crosses below the baseline.
- Kumo twist:

A bullish twist happens when the Leading Span A crosses above the Leading Span B, indicating a potential bullish entry. Similarly, a bearish twist happens when the Leading Span A crosses below the Leading Span B, indicating a potential bearish trading opportunity. Chart uploaded below shows the relevant example of Kumo Twist.
Always remember to use additional technical tools to enhance the quality of your analysis. The signals generated by the Ichimoku Cloud should not be used solely. Moreover, effective risk management methods can also help you a lot when using trading strategies like these.
How can traders find support and resistance using the Ichimoku Cloud?
The Conversion line and the Base line act as support and resistance in the Ichimoku Cloud. Traders can find support and resistance when the price interacts with these lines. Additionally, Leading Span A and Leading Span B forecast the support and resistance of stock 26 periods into the future.
How can Ichimoku Cloud work with other indicators?
The Ichimoku Cloud does cover multiple aspects of the price chart, but it is not a stand-alone indicator. The effectiveness of the Ichimoku Cloud is enhanced when used in conjunction with other technical tools. Here are 3 types of technical indicators that you can use Ichimoku Cloud with.
- Candlestick patterns such as engulfing patterns, doji, or hammer formations can help a trader decide the entry and exit of a trade. A candlestick pattern aligning with the Ichimoku Cloud’s trading signal enhances the success rate of a trade.
- Demand and supply levels are also identified in conjecture to other confluences available.
- Oscillators such as the RSI (Relative Strength Index) and Stochastics are used to identify the overbought and oversold zones in a stock. This can help a trader find the right area to enter/exit a trade.
- Fibonacci retracement levels are used alongside the Ichimoku cloud to identify the potential support and resistance zones in a stock. This can give a more detailed insight into the potential trend reversal zones of a stock.
You should experiment with different indicators and only combine the indicators you know best. You should back-test using different technical tools alongside the Ichimoku Cloud on historical price charts before taking actual trades.
Does the Ichimoku Cloud Indicator work well with Bollinger Bands?
Yes, combining the Ichimoku Cloud Indicator with Bollinger Bands will work well. The confluence between both indicators can signal a strong trading signal. The chances of the price rising even higher enhances when the price breaks above the cloud and the middle band at the same time.
What is the winning rate of the Ichimoku Cloud Indicator?
It is difficult to give an accurate winning rate for the Ichimoku Cloud indicator, and it can be subjective. The winning rate of the Ichimoku Cloud indicator depends on factors, such as market conditions, the skills of the trader to execute the trade, the trading time-frame, etc.
Is the Ichimoku Cloud accurate?
Yes, the Ichimoku Cloud is accurate. But it must be noted that no indicator or tool can determine future uncertainty. Thus the scale of accuracy should be factored in the form of precision. The popularity and effectiveness of the indicator prove that the Ichimoku Cloud is a profitable trading setup. It is difficult, however, to give an accuracy rate for the indicator. The accuracy of the Ichimoku Cloud indicator depends on market factors such as the current market condition, the skills of the trader, etc.
What are the advantages of the Ichimoku Cloud Indicator?
The Ichimoku Cloud is a technical indicator comprising five leading and lagging indicators. These averages help traders identify potential trend reversal zones and support and resistance levels. Here are three more advantages of the Ichimoku Cloud Indicator.
- A Comprehensive view of the price chart:
The five components of the Ichimoku Cloud provide a comprehensive view of the price chart. This enables traders to identify the overall trend of the market and identify the potential trade opportunities easily.
- Provides clear trading signals:
The Ichimoku Cloud gives clear and detailed trading signals unlike some indicators. The entry/exit signals and the support and resistance levels are very easy to spot using this indicator.
- Flexible application:
The Ichimoku Cloud Indicator is used across all types of markets, time-frames, and trading styles. This indicator is also suitable for both long and short-term trading styles.
It is also important to understand that no indicator can achieve 100% accuracy even while traders can benefit from the multiple advantages offered by the Ichimoku Cloud Indicator. Traders should always deploy effective risk management strategies while trading.
What are the disadvantages of the Ichimoku Cloud Indicator?
The Ichimoku Cloud indicator does have its limitations aside from its popularity. Following are three of the disadvantages of the Ichimoku Cloud Indicator.
- Hard to understand:
The Ichimoku Cloud consists of a combination of technical tools that can be difficult for a beginner trader to understand. It can take months of practice for a beginner to master this Indicator.
- Lagging nature:
The Ichimoku Cloud indicator has a lagging nature. Meaning, the trading signals received from this indicator are delayed sometimes. There is a possibility that the indicator fails to give a signal at the very start or end of the trend.
- Overwhelming amount of information:
Your price chart can look messy while using the multiple lines of the Ichimoku Cloud indicator. Traders can find it overwhelming to utilise all the information provided by this indicator.
- False setups on lower time frames:
Traders using this indicator on lower time frames have found to be not so effective. They generate enough fake trade setups and the volatility of today’s era is not calculated.
Traders should be aware of the limitations of the Ichimoku Cloud indicator. You can save yourself a lot of time and money by understanding the limitations of this indicator and using it with caution.
Is Ichimoku Cloud a leading indicator?
No, the Ichimoku Cloud is not a leading indicator. The Ichimoku Cloud indicator is classified as a trend-following indicator. The Ichimoku Cloud indicator provides more information about the current market trend than future price movements.
Does the Ichimoku Cloud predict the future?
No, the Ichimoku Cloud indicator does not predict future price movements in a stock. The Ichimoku Cloud indicator analyses historical price data and creates a visual representation of the current market conditions with the help of it.
Is the Ichimoku Cloud Indicator based on moving averages?
Yes, the Ichimoku Cloud indicator incorporates moving averages as part of calculating its components. The Conversion Line and the Baseline are examples of this. However, the calculation of Ichimoku averages and moving averages differs. A simple moving average considers the closing price over a specific number of periods, while an Ichimoku average is calculated by adding the highest high and the lowest low over a specific number of periods and then dividing the sum by 2.
Can the Ichimoku Cloud Indicator be used to identify potential trend reversals?
Yes, the Ichimoku Cloud indicator is used to identify potential trend reversals. The primary trading strategies of the Ichimoku cloud are trend reversal strategies. For example, Cloud break, Kumo twist and the conversion line and base line crossover.
Is the Ichimoku Cloud Indicator only used in forex trading?
No, the Ichimoku Cloud Indicator is used in all types of markets. The versatility of the Ichimoku Cloud indicator makes it effective across all sorts of market types.


 Previous Article


![15 Investing.com Alternatives [Free+Paid] You Should Use in 2026](https://www.strike.money/wp-content/uploads/2026/04/Investing.com-Alternatives.jpg "15 Investing.com Alternatives [Free+Paid] You Should Use in 2026 76")
![15 TradeStation Alternatives [Free+Paid] You Should Use in 2026](https://www.strike.money/wp-content/uploads/2026/04/TradeStation-Alternatives.jpg "15 TradeStation Alternatives [Free+Paid] You Should Use in 2026 77")
![15 Chartink Alternatives [Free+Paid] You Should Use in 2026](https://www.strike.money/wp-content/uploads/2026/04/Chartlink-Alternatives.jpg "15 Chartink Alternatives [Free+Paid] You Should Use in 2026 78")
: Overview, 10 Types of Indicators, Settings for Different Markets 79")


 : Definition, Formula, calculation, Uses, Advantages Vs limitations 82")


: How We Used This 70/30 Indicator in 6 High Win-rate Strategies 85")


No Comments Yet.