The Thrusting pattern is a bearish continuation candlestick formation that reflects sellers maintaining control after a temporary attempt by buyers to push prices higher. The Thrusting pattern belongs to the family of two-candle patterns and usually appears during downtrends.
This pattern is crucial for traders because it signals that bearish momentum remains strong, despite short-lived optimism. The thrusting pattern often traps aggressive buyers who mistake the second candle for a reversal signal.
What is a Thrusting pattern?
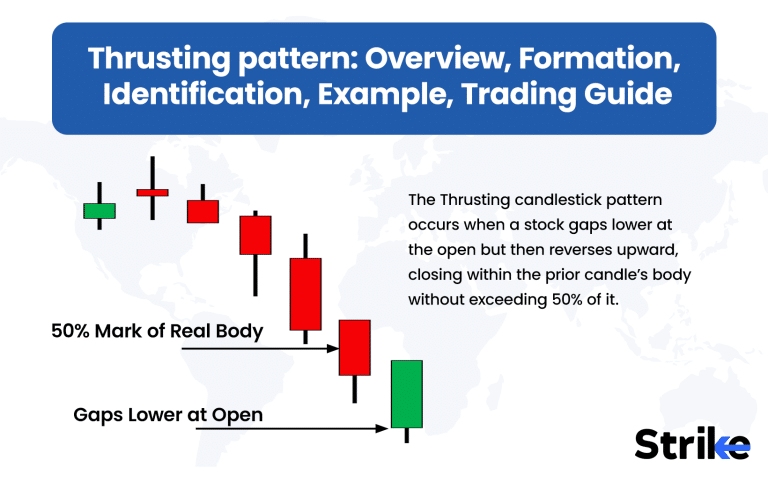
A Thrusting pattern is a bearish continuation formation appearing in a downtrend where a small bullish candle closes within the body of the previous bearish candle but fails to cross above its midpoint. This structure highlights the inability of buyers to regain control.

The pattern always involves two candles. The first is a long bearish candle that confirms dominant selling pressure. The second is a smaller bullish candle that opens lower but closes inside the body of the first candle without crossing its midpoint.
This failure to close above 50% of the first candle confirms that the recovery attempt is weak. In practice, the pattern signals that sellers remain strong and are likely to push the price lower in the following sessions.
Technical analysts consider the thrusting pattern to have moderate predictive power. Its reliability increases when it appears near resistance levels, trendlines, or when accompanied by high trading volume.
How does Thrusting pattern Candlestick Pattern Formed?
The Thrusting pattern forms during a downtrend when sellers dominate, followed by a weak bullish recovery attempt that fails to break critical resistance. The psychology behind it reflects temporary buyer optimism being crushed by prevailing bearish sentiment.

The first candle in the pattern is a strong bearish candle. It usually shows a large body, minimal upper wick, and heavy volume, establishing strong downside momentum.
The second candle opens with a gap down, reflecting bearish continuation. Buyers then push prices upward during the session, but the close remains within the body of the first candle, failing to surpass its midpoint.
The psychology is simple. Bears remain in control even after buyers attempt a comeback. Market participants watching this setup read it as sellers defending resistance levels aggressively.
This sequence builds trader confidence that the downtrend is intact. Statistics from candlestick studies suggest continuation signals like thrusting have an accuracy of 55–60% when confirmed with volume or trend indicators.
The formation shows a fight between bulls and bears, with the bears still holding the upper hand. Traders interpret this as an opportunity to enter short trades with favorable risk-reward ratios.
When do Thrusting pattern Candlestick Patterns occur?
Thrusting patterns occur during established downtrends, often after sharp price declines where sellers dominate. They are visible on daily, weekly, and intraday charts, like in the example below.

The setup usually develops after a series of bearish candles. At this stage, traders look for weak bullish attempts that stall before reversing the broader trend.
Thrusting formations are more reliable on higher timeframes. On daily charts, they signal stronger continuation because of wider participation and higher trading volume. On hourly or 15-minute charts, they appear frequently but give weaker signals because of market noise.
The pattern often occurs after news-driven sell-offs or during phases of low investor confidence. In equity markets, thrusting structures appear more often in cyclical sectors like metals, banking, and technology, where volatility remains high.
For traders, spotting the pattern near a resistance zone or moving average increases its effectiveness. Backtested results indicate that thrusting formations on daily charts yield a higher success rate compared to lower timeframes.
How to Identify a Thrusting pattern
A Thrusting pattern is identified by spotting a strong bearish candle followed by a small bullish candle that closes within the prior candle’s body but below its midpoint. This combination confirms the signal.
The identification process involves three main steps.
First, check the trend to ensure that the pattern appears in an ongoing downtrend.
Second, look for a large red candle with strong volume that sets the tone of selling pressure.
Third, observe the following candle, which must be bullish, close within the first candle’s body, but fail to cross its 50% level.
There are also key features that strengthen the recognition of this setup. A visible gap-down opening on the second candle is often present. The bullish candle typically has a smaller body compared to the prior bearish candle, showing weak buying strength. Long lower wicks are rare because the focus remains on how the close relates to the midpoint of the first candle.
Confirmation plays a vital role in validating the pattern. Traders often wait for the next one or two sessions to see whether prices continue falling.
What Does a Thrusting pattern Pattern Indicate?
A Thrusting pattern indicates bearish continuation, showing that sellers remain in control despite a temporary upward push by buyers. The second candle represents weakness in the bullish move.
The pattern signals that any buying momentum is not enough to reverse the downtrend. Market psychology shows that sellers defend resistance levels and prepare for another wave of selling pressure.
This indication is especially useful for swing traders who seek continuation entries. Short positions often become more attractive after confirmation.
In statistical studies, thrusting patterns have around 55%–60% probability of forecasting further decline when paired with volume confirmation. The signal grows stronger in volatile sectors such as banking or technology stocks.
For investors, the pattern serves as a warning against mistaking small bullish candles for a trend reversal. It emphasizes that bearish strength outweighs short-term optimism.
Example of Thrusting pattern
An example of a thrusting pattern appeared in Tata Steel during June 2022 when the stock was in a strong downtrend. The pattern signaled continuation and led to further price weakness.
On June 16, Tata Steel formed a long bearish candle with heavy volume after global metal prices corrected. The very next session opened with a gap down, creating pressure on buyers.
However, buyers attempted to recover, leading to a small green candle closing inside the body of the previous bearish candle. Importantly, the close stayed below the midpoint, confirming thrusting characteristics.
The following sessions saw continued selling, pushing Tata Steel down by more than 6% within a week. This validated the bearish continuation and highlighted the predictive power of the pattern.
Such real-world examples prove useful for traders. They show that thrusting setups often lead to profitable short opportunities.
In this case, traders who shorted near the second candle close gained an advantage with a tight stop-loss above the midpoint of the first candle. This setup provided a 1:2 risk-reward ratio.
Thus, thrusting patterns help identify entry points in live markets and give strong evidence of trend continuation.
How Reliable are Thrusting pattern Candlestick Patterns?
Thrusting patterns are moderately reliable, with accuracy improving when confirmed with volume, resistance, or trend indicators. They are not foolproof.
Research on candlestick pattern reliability by Thomas Bulkowski shows thrusting patterns predict continuation roughly 55% of the time. While not the strongest signal, reliability increases on daily and weekly charts.
The main limitation is false signals during sideways markets. In choppy environments, bullish candles within bearish trends may be misinterpreted, reducing accuracy.
Reliability increases when the pattern appears near technical resistance. Coupling it with RSI divergence or volume spikes raises predictive strength.
Traders should treat thrusting patterns as one part of a broader strategy rather than a standalone tool. Using stop-loss orders and position sizing ensures better results.
How to Trade Using the Thrusting pattern Pattern
Let us see how to trade using a thrusting pattern using an example. Here, the provided Nifty 50 chart clearly shows the thrusting setup with entry, stop-loss, midpoint, and target levels already highlighted. This helps us understand how to apply the candlestick structure in real market conditions.

The chart shows two key candles boxed in purple. The first is a strong bearish candle, and the second is a smaller bullish candle that closes inside the body of the first but remains below its midpoint. This satisfies the definition of a thrusting pattern, signaling that the bearish momentum is still dominant even though buyers attempted a recovery.
Entry point is marked at the blue horizontal line near 11,548. Traders prepare to go short once the price weakens around this level after the second candle’s confirmation. The stop-loss is defined at 11,352, shown by the red line under the pattern. This ensures risk is capped if the market reverses against the trade.
The midpoint reference is shown at 11,425 (black line). This midpoint is critical because if the bullish candle had closed above it, the thrusting pattern would not have been valid.
Target level is placed at 11,824, highlighted by the green line. This gives a clear risk-to-reward framework. Risk from entry (11,548 to 11,352) equals around 196 points, while the reward up to 11,824 is about 276 points, giving nearly 1.4R. An extended target near 11,940 improves the trade to about 2R.
Trade management involves scaling out partially at 11,824 and trailing the stop to breakeven once price crosses 11,700. If momentum continues, the final exit comes closer to 11,940. If price fails and drops below 11,352, the trade is invalidated and the stop ensures protection.
This example shows that the thrusting pattern is not just a theory but a practical trading tool. By using defined levels from the chart—entry at 11,548, stop below 11,352, and targets at 11,824/11,940—traders achieve disciplined execution with favorable risk-reward.
How to Combine Thrusting pattern with other Technical Indicators?
The thrusting pattern becomes stronger when combined with technical indicators like volume, RSI, moving averages, and support-resistance analysis. These tools confirm market sentiment.
| Indicator | Condition with Thrusting Pattern | Interpretation / Bearish Confirmation |
| Volume | High volume on the first bearish candle | Strong selling pressure; increases reliability of continuation. |
| RSI | RSI trending below 50 | Confirms bearish momentum; signals weak buying strength. |
| Moving Averages | Close below 50-day or 200-day MA | Aligns with broader downtrend; supports continuation bias. |
| Support & Resistance | Pattern appears near resistance | Reinforces sellers’ control; failed breakout attempt confirms downside. |
A multi-tool approach increases reliability. For instance, a thrusting pattern supported by bearish MACD crossover gives traders more confidence.
Combining multiple signals such as volume, RSI, moving averages, and support-resistance reduces false entries. Studies show that using patterns with at least two confirming indicators improves success rates to above 65%.
What are the Pros vs Cons of Using Thrusting pattern?
The thrusting pattern offers advantages like trend alignment and clear entry signals, but disadvantages include moderate accuracy and false signals in sideways markets. A table makes the comparison clear.
| Pros | Explanation | Cons | Explanation |
| Aligns with ongoing bearish trend | Helps traders stay with the dominant direction of the market, reducing the risk of trading against momentum. | Moderate reliability (55–60%) | Studies show thrusting patterns succeed only around 55–60% of the time, making them less reliable compared to stronger continuation setups like falling three methods. |
| Provides clear stop-loss level | The midpoint or high of the first bearish candle offers a logical stop-loss reference, simplifying risk management. | Prone to false signals in sideways trends | In choppy markets without a clear trend, thrusting setups appear frequently but fail often, causing repeated losses. |
| Works better with indicators | When combined with RSI, MACD, or volume, the thrusting pattern produces more accurate signals, increasing trader confidence. | Requires confirmation for accuracy | Traders cannot rely solely on the two candles. A follow-up bearish candle or indicator confirmation is needed, slowing down decision-making. |
| Simple two-candle identification | Easy for beginners to recognize and apply without complex chart-reading skills. | Limited standalone predictive power | On its own, the thrusting pattern lacks strong forecasting strength, requiring it to be part of a broader strategy. |
| Effective across multiple timeframes | Works on daily, weekly, and intraday charts, giving flexibility for swing and short-term traders. | Low reliability on lower timeframes | On 5-min or 15-min charts, market noise reduces the effectiveness of thrusting signals drastically. |
| Encourages discipline | Forces traders to plan entry, stop-loss, and target in advance, improving risk-reward ratios. | Vulnerable to news-driven reversals | External events like policy announcements or earnings reports often invalidate the setup quickly. |
| Statistically proven | Thomas Bulkowski’s research highlights thrusting patterns as moderately predictive, which still gives traders an edge over random entry. | Performance varies by sector | The pattern works better in volatile sectors (metals, banks) but underperforms in defensive sectors (FMCG, utilities). |
| Supports short-selling strategies | Provides traders with structured opportunities to profit from bearish markets, not just bullish ones. | Not suited for long-term investors | Long-term investors tracking fundamentals find little value in thrusting patterns, as signals are short-lived. |
Traders benefit from clarity in setup and risk management rules. However, dependence on additional confirmation slows decisions.
Thus, the thrusting pattern is a useful but not standalone tool. Proper integration with technical analysis and disciplined trading makes it effective in bearish strategies.


 Previous Article


![15 Investing.com Alternatives [Free+Paid] You Should Use in 2026](https://www.strike.money/wp-content/uploads/2026/04/Investing.com-Alternatives.jpg "15 Investing.com Alternatives [Free+Paid] You Should Use in 2026 24")
![15 TradeStation Alternatives [Free+Paid] You Should Use in 2026](https://www.strike.money/wp-content/uploads/2026/04/TradeStation-Alternatives.jpg "15 TradeStation Alternatives [Free+Paid] You Should Use in 2026 25")
![15 Chartink Alternatives [Free+Paid] You Should Use in 2026](https://www.strike.money/wp-content/uploads/2026/04/Chartlink-Alternatives.jpg "15 Chartink Alternatives [Free+Paid] You Should Use in 2026 26")
: Overview, 10 Types of Indicators, Settings for Different Markets 28")

 : Definition, Formula, calculation, Uses, Advantages Vs limitations 30")


: How We Used This 70/30 Indicator in 6 High Win-rate Strategies 33")


No Comments Yet.