What is a Fair Value Gap (FVG)?
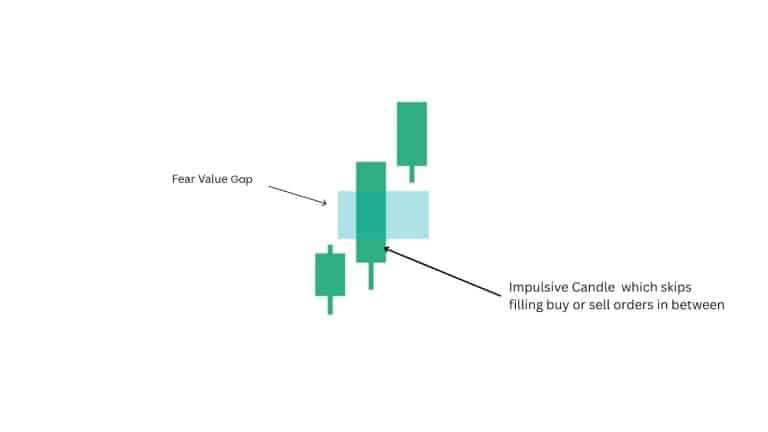
A Fair Value Gap (FVG) is a price imbalance on a chart where rapid buying or selling pressure causes a sudden move, which skips filling buy or sell orders in between. This gap shows where buyers and sellers didn’t get a chance to trade fairly, hence the term “fair value” gap.

Price often returns to fill this imbalance because the market seeks efficiency. Once the gap is filled, price usually reacts either continuing the trend or reversing from the FVG zone.
Why Does a Fair Value Gap Occur?
Fair Value Gap occurs for four main reasons. The reasons are economic news, earning reports, market sentiment and supply/demand imbalance.
- Economic News and Announcements: FVGs often appear due to major economic news, such as inflation reports, GDP numbers, or interest rate decisions. These events can result in sudden buying and selling which cause prices to move quickly and skipping intermediate levels and leaving imbalance on the chart.
- Earnings Reports: When companies earning significantly beat or miss the expectations, traders react aggressively. Such aggressive and fast reaction creates sharp candles, where price may jump or fall without giving the market time to fill orders in between, forming a fair value gap.
- Market Sentiment: Extreme market sentiments shift due to geopolitical events, market rumors, or unexpected announcements can force traders to act impulsively. This sentiment shift can cause prices to move in one direction rapidly, creating inefficiencies that show up as FVGs.
- Supply and Demand Imbalances: FVG is nothing but the visual representation of supply and demand imbalance. When there are significantly more buyers than sellers (or vice versa) in a short time can accelerate price, leaving behind FVG.
Traders exploit these gaps by anticipating retracements for high-probability fills, enhancing edge in strategies on Nifty or forex charts.
What are the Types of Fair Value Gaps
There are three main types of Fair Value Gap. The types are Bullish FVG, Bearish FVG and Inverse FVG.
Bullish Fair Value Gaps
Bullish FVG (Fair Value Gap) is a price imbalance on the chart where price moves up quickly leaving unfilled space between three consecutive candles. This happens when the high of the first candle is lower than the low of the third candle, leaving a price gap that the market did not fully trade through.

Bullish FVG act as a support zone where price often retraces into the FVG to rebalance before continuing higher. Traders use this retracement as a high-probability entry zone in a bullish trend. Bullish fair value gaps are typically triggered by positive economic news, better-than-expected earnings reports, or a sudden shift in investor sentiment towards optimism.
Bearish Fair Value Gaps
Bearish FVG (Fair Value Gap) is a price imbalance on the chart where price moves down quickly leaving unfilled space between three consecutive candles. This happens when the low of the first candle is higher than the high of the third candle, leaving a price gap that the market did not fully trade through.

Bearish FVG act as a resistance zone where price often retraces into the FVG to rebalance before continuing lower. Traders use this retracement as a high-probability entry zone in a bearish trend. Bearish FVGs are typically triggered by negative economic news, poor earnings reports, or a sudden negative shift in investor sentiment.
Inverse Fair Value Gaps
In inverse FVGs, price enters into a rebalancing zone, but moves in the opposite direction, creating a new imbalance opposite to the original move.

This opposite-side imbalance is an indication of a drastic change in the order flow, signalling that the price will tend to retrace the inverse gap and move on in the direction of the bigger trend. IFVGs are used by traders to predict these secondary rebalancing points, and to make more precise entries.
How to Identify Fair Value Gaps on a Chart
There are three major steps to identify FVGs. The Steps include spotting the initial impulsive move, checking for three candle patterns and locating a gap.
Spot the Initial Impulse Candle: Look for a strong bullish or bearish candle that shows a sudden change in momentum
Check for the Three-Candle Pattern
A fair value gap example is best understood through the 3-candle structure:

- Candle 1: The initial bullish candle.
- Candle 2: A strong continuation candle that moves sharply in one direction and leaves untested price levels.
- Candle 3: Forms without touching or overlapping the wick of Candle 1, creating an empty price area between them.
Locate the Gap Zone: The FVG is the area between the high of Candle 1’s wick and the low of Candle 3’s wick (in a bullish scenario), or the opposite in a bearish scenario. This untested space is the fair value gap.

Many traders use custom FVG indicators on platforms like TradingView or MetaTrader instead of marking gaps manually. These tools automatically highlight imbalance zones, making it faster and easier to scan multiple charts for Fair Value Gaps.
What is the Best Fair Value Gap Indicator
There is no single “best” FVG indicator because the efficiency depends on a trader’s specific strategy, platform, and preference for simplicity versus advanced features. But there are few quality FVG indicators available on charting platforms like TradingView.
| Indicator Type | Platform | Key Features | Best For |
| LuxAlgo FVG | TradingView | Auto FVG detection, filters, alerts, dynamic updates | Traders wanting a premium, feature-rich tool |
| SMC Structures & FVG (LudoGH68/pc75) | TradingView | Simple display, MTF support, auto removal of filled gaps | Traders who prefer a clean, free, clutter-free chart |
| Volumetric FVGs | TradingView | Volume-based gaps, heatmaps, highlights institutional activity | Traders who use volume to validate FVG strength |
| Time-Based FVGs (BigGuava) | TradingView | FVG detection in key sessions (Kill Zones), ICT-aligned | Traders following ICT time-based strategies |
Every FVG indicator has its own pros and cons. Some offer advanced filters, others focus on simplicity or volume integration. But no indicator can judge market context for you. Indicators only automate the visuals; the real edge comes from understanding structure, liquidity, and the quality of the imbalance.
How to Trade Fair Value Gaps
A fair value gap trading strategy relies on spotting imbalances in price action and using them as high-probability trading zones. To trade FVGs effectively, traders must follow precise rules for entry, risk management, and exits while confirming setups across multiple timeframes.
Select Timeframe
- Higher Timeframe: Higher time frame such as H1, H4, D1 creates more reliable FVGs by reducing short term price fluctuation. These FVGs offer high-probability retracements for swing trades.
- Lower Timeframe: Use M15, M5, or even M1 for precise entries and scalping within higher timeframe FVGs, confirming retracements via candlestick rejection or liquidity sweeps.
Entry Conditions
- Bullish FVG Entry: Identify a tree bullish candle with a FVG gap below the current price. Wait for price to retrace into the gap zone and enter long when price touches the FVG and shows bullish candle.

- Bearish FVG Entry: Identify a tree bearish candle with a FVG gap above the current price. Wait for price to retrace into the gap zone and enter short when price touches the FVG and shows bearish candle.

- Partial Fill Entries: Conservative traders may wait for a full gap to fill, while aggressive traders may enter at the 50% midpoint of the gap for better risk-to-reward positioning.
Position Sizing
- Only risk 1-2% of the total account per trade.
- Reduce your risk per trade in case of trading multiple FVG setups to avoid overexposure.
- Use smaller position sizes for partial fill entries.
Stop-Loss Placement Rules
Place your stoploss just beyond the FVG boundary (below the gap for longs, above the gap for shorts).
Take-Profit Targets
- Nearest market structure level (recent swing high for longs, swing low for shorts).
- Major support/resistance, Fibonacci levels, or institutional order blocks in line with trend direction.
- Use a partial exit strategy, scale out 50% at the midpoint of the gap and trail the rest using a moving average or adjusted stop-loss.
Mastering Fair Value Gaps through disciplined multi-timeframe analysis, precise entries on retracements, and strict 1-2% risk management transforms these market inefficiencies into consistent, high-reward opportunities across Nifty, forex, or global indices.
Fair Value Gap in ICT (Inner Circle Trader) Methodology
Fair Valued Gap (FVG) gained popularity through ICT (Inner Circle Trader) methodology, introduced by Michael J. Huddleston. He introduced this idea to retail traders as a key smart money concept.
According to ICT, FVGs are price inefficiencies created when institutional algorithms move markets quickly, leaving a gap between the candles. These unfilled gaps show low liquidity and often pull prices back to fill them.
Traders following ITC methodology uses FVGs alongside order blocks, liquidity grabs, and Market Structure Shifts for confluence.

- Order Blocks: Regions in which institutions had high buy/sell orders; to locate a good buy/sell.
- Liquidity Grabs: The price will overshoot and go higher or lower to incur stop-losses before turning around.
- Market Structure Shift (MSS): A sharp reversal in direction of the trend, it makes sure that momentum has reversed.
ITC principle says that price always seeks efficiency, so it often returns to fill an FVG before continuing in the trend. Unfilled FVGs on higher timeframes act like magnets and help traders find strong setups on charts like Nifty or Sensex.
Advantages vs Limitations of Using Fair Value Gaps in Trading
The advantages and limitations of using a fair value gap in trading is mentioned below in the table.
| Advantages | Limitations |
| Provide high-probability pullback entry zones | Not all FVGs get filled, especially in strong trends |
| Reveal institutional orderflow and displacement | Gives weak or false signals in sideways/choppy markets |
| Work well with BOS/MSS to confirm direction | Requires proper context; FVG alone is not enough |
| Offer precise entry, stop-loss, and target levels | Beginners struggle to identify true gaps vs noise |
| Improve risk–reward by allowing refined entries | Too many micro FVGs appear on lower timeframes |
| Apply to all markets and timeframes | Cannot predict trend direction on their own |
Balance FVGs within multi-timeframe systems and strict risk rules to leverage strengths while mitigating pitfalls in Indian or global markets.
Is Fair Value Gap a Reliable Trading Concept?
Yes, FVG is a reliable trading concept when used in the right market context, supported by price action, liquidity behavior, and higher-timeframe structure. It is not a standalone magic indicator but becomes powerful when combined with displacement, trend direction, and liquidity sweeps.
How to Distinguish a Valid FVG from a Minor Market Inefficiency
To distinguish a valid FVG from a minor market inefficiently, look for the core structure, context, momentum size and gap size.
- Core Structure: An authentic FVG only develops when the three clean consecutive candles with no overlap of wicks between Candle 1 and Candle 3. When the wicks are in contact, then it is usually a minor market inefficiency, rather than a true FVG. You can use a four-candle pattern only under exceptional circumstances like when Candle 1 is an inside bar.

- Momentum and Size Filters: Strong FVGs appear when the middle candle is significantly bigger than usual, typically 1.5x-2x of average candle size, with most of its range occupied by the actual body (70% body). The minor inefficiencies normally form in slow markets or low volume markets and get filled shortly.
- Contextual Validation: Reliable FVGs appear during strong trends, after liquidity sweeps, or during high volatility moves. FVGs often come with big volumes and show clear reactions when price retest the gap. Gaps that form during choppy markets are usually weak and behave like minor inefficiencies.
Is FVG better than Traditional Support and Resistance?
Neither Fair Value Gaps (FVGs) nor Traditional Support and Resistance (S/R) is inherently better, instead, they are complementary tools that offer different perspectives on market dynamics. Traditional S/R relies on past price turning points and FVGs detect price-inefficiencies in the market as a result of robust institutional order flow that the market tends to revert to restabilize.
Difference between Fair Value Gap vs Liquidity Gap vs Imbalance
The difference between Fair Value Gap vs Liquidity Gap vs Imbalance is mentioned below in the table.
| Feature | Fair Value Gap (FVG) | Liquidity Gap | Imbalance |
| Core Meaning | A 3-candle price inefficiency where the middle candle leaves unfilled space between its wicks and the wicks of candles before/after it | A price level where very little or no trading volume occurred, causing a thin area on the chart | A general price inefficiency where buying and selling pressure are not equal |
| Market Origin | Caused by displacement and aggressive institutional orders | Caused by lack of orders or sudden voids in volume | Caused by one-sided trading or momentum push |
| Structure Type | Candle-based pattern | Volume/auction-based void | Broader concept referring to uneven buy/sell activity |
| How It Looks on Chart | Clear gap between candle wicks (3-candle pattern) | Long thin candles, micro-gaps on volume profile, sudden price jumps | Large candles, long wicks, inefficient moves without gaps |
| Timeframe Impact | Appears on all timeframes but more reliable on higher TFs | More visible on volume profile or low-liquidity assets | Seen universally across candles, trends, and swings |
| Why It Forms | Algorithms repriced the market too quickly | Market had insufficient participants to trade that zone | Buyers or sellers dominated without opposition |
| How Price Reacts Later | Price likely returns to “rebalance” or fill the FVG | Price may quickly pass through or reject due to thin liquidity | Price often retraces to balance order flow |
| Trading Usage | Precise entry zones for continuation or reversal setups | Identifying fast-move zones, breakout traps, thin liquidity | Used to understand strength of displacement or smart-money intent |
| Reliability | High when combined with BOS/liquidity sweep | Medium; depends on volume structure | High when aligned with trend and orderflow |
| Common Misconception | Every gap is an FVG (not true—needs 3-candle structure) | Every fast move is a liquidity gap (not true—it must reflect low trading activity) | Imbalance = FVG (not true—FVG is one type of imbalance) |
| Tools Used | Candlestick chart | Volume profile, market profile | Candlestick + volume analysis |
Distinguish these via context and tools to avoid conflation, enhancing setups when FVGs align within larger imbalances on higher timeframes.
Combining Fair Value Gaps with Other Tools
We can combine FVGs with other tools such as order blocks, fibonacci retracement, RSI, and volume profile to increase the reliability and efficiency to trade FVG.
FVG + Order Block
Using an FVG within or touching an Order Block significantly improves the setup. Order Blocks indicate the source of the institutional orders, whereas FVG verifies that the price has moved too fast out of that range. In most cases when the price comes back to the Order Block and touches the FVG, it will result in a high-probability continuation trade with a tight stop-loss.

FVG + Fibonacci Retracement (0.5–0.618 Levels)
The Gaps of Fair Value that are close to the 50 or 61.8% retracement levels are more likely to serve as powerful reaction zones. The Fibonacci level is a landmark of the expectation of the pullback, and the FVG is the exact area of entry within the retracement. This option tends to be applied in trending markets to trade clean retracements.

FVG + RSI Divergence
An FVG forming around a liquidity grab and RSI displaying bullish or bearish divergence increases the reliability of the setup. The divergence shows that the current move is getting exhausted whereas the FVG presents a structural imbalance in which price is likely to revert prior to switching. This is effective in reversal as well as continuation trades.

FVG + Volume Imbalance Zones
Volume Imbalances point out those parts of the trading where the volume was either uneven or thin. The overlapping of these areas with FVGs is an indication that the prices were shifting fast in a poorly participated area. Price tends to re-enter these merged areas to re-equilibrium the volume as well as price. This two-fold merging enhances accuracy and probability of trade.

Smaller gaps tend to close quickly, while higher-timeframe imbalances can stay open for months. Traders should use FVGs as part of a broader strategy that includes trend, liquidity, and market context rather than relying solely on the gap itself.
How Long Does it Take for an FVG to Fill?
Fair Value Gaps (FVGs) have no fixed fill time and it depends on the timeframe, market volatility, and conditions. Generally, FVGs on lower time frames often get filled within hours or days, while higher ones (daily/weekly) may take weeks or months.
This table shows the types of FVG and their typical fill time.
| Type of FVG | Typical Fill Time | Timeframes | Characteristics |
| Small FVGs (Intraday) | 5 minutes to a few hours | 1m, 5m, 15m | Form during rapid intraday moves; markets usually rebalance these inefficiencies the same day. |
| Medium FVGs (Swing Timeframes) | 1–5 days | 1H, 4H | Filled within a few candles; respected longer and often part of structured pullbacks in trending markets. |
| Large FVGs (Higher Timeframes) | Weeks to months | Daily, Weekly | Formed during major events; can remain unfilled for long periods and still remain valid. |
Do Institutional Traders use Fair Value Gaps?
Yes, institutional traders use FVG but not in the way retail traders trade. Institutional traders don’t sit and “draw FVGs” on their charts like retail ICT students, but they still follow the same core concept behind the FVGs.
For institutions, FVG is nothing but an inefficient price area or low-liquidity zone formed because of algorithms like VWAP or TWAP. Institutions focus on liquidity, volatility, orderflow, and market balance, which naturally create the zones that retail traders call FVGs. In simple terms, FVGs are just a visual way to understand how big players move the market.
Are FVGs Reliable in Intraday Trading?
Yes, FVGs are moderately reliable in intraday trading on timeframes like 5-minute, 15-minute, or 1-hour charts, but only when the market is moving with strong momentum where they capture short-term momentum imbalances, but success requires confluence to filter noise and false signals.
Intraday FVGs form during active sessions from rapid price moves, providing frequent setups on lower charts, though higher intraday frames (15-min to 1-hour) balance opportunity with reliability better than 1- or 5-minute noise. Lower the timeframe increases false signals due to market noise.


 Previous Article


![15 Investing.com Alternatives [Free+Paid] You Should Use in 2026](https://www.strike.money/wp-content/uploads/2026/04/Investing.com-Alternatives.jpg "15 Investing.com Alternatives [Free+Paid] You Should Use in 2026 172")
![15 TradeStation Alternatives [Free+Paid] You Should Use in 2026](https://www.strike.money/wp-content/uploads/2026/04/TradeStation-Alternatives.jpg "15 TradeStation Alternatives [Free+Paid] You Should Use in 2026 173")
![15 Chartink Alternatives [Free+Paid] You Should Use in 2026](https://www.strike.money/wp-content/uploads/2026/04/Chartlink-Alternatives.jpg "15 Chartink Alternatives [Free+Paid] You Should Use in 2026 174")
: Overview, 10 Types of Indicators, Settings for Different Markets 175")


 : Definition, Formula, calculation, Uses, Advantages Vs limitations 178")


No Comments Yet.