Flag pattern often emerges as a highlight of strong market trends, showcasing the balance between momentum and temporary consolidation. Flag pattern captures traders’ attention because it represents a moment of indecision where price action pauses before potentially resuming its previous strength.
Combined with a directional and steep price movement, it creates the flag and pole formation – a structure which embodies the constant struggle between the buyers and the sellers. This structure has been earmarked as very popular in both time and assets, and traders like to have it as a continuation signal with good volume and breakout action.
What is a Flag Pattern in Technical Analysis?
Flag pattern in technical analysis is a trend continuation pattern that signals a brief pause or consolidation during a strong trend. Flag pattern resembles the shape of flag on a pole where the pole represents sharp price movement and the flag represents pause or a consolidation.
Is the Flag pattern a Reversal or Continuation Pattern?
The Flag pattern is a continuation chart pattern which signals a brief pause before continuing the prevailing trend. It forms after a strong price move, followed by a small consolidation channel. Once price breaks the channel, price continues its prevailing trend.
Components and Characteristics of a Flag Pattern
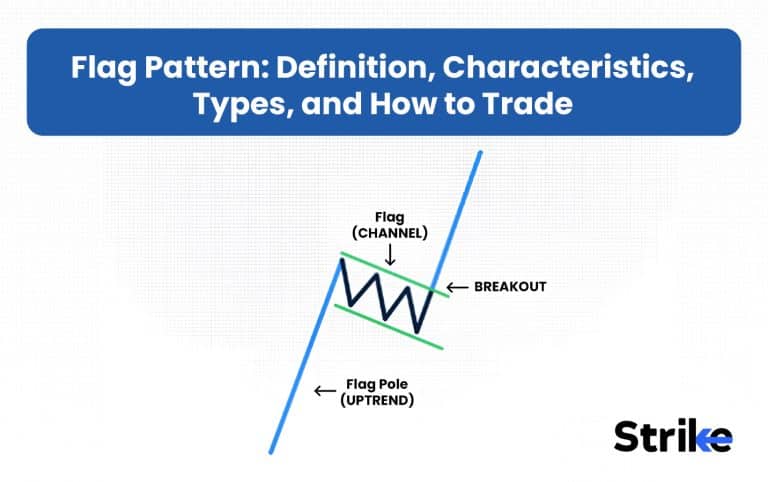
The Flag pattern includes three major components. The components are Flagpole, Flag and Breakout.

- Flagpole: The initial strong, nearly vertical price movement, either up or down representing a strong trend. This usually forms by long body candles and high volume.
- Flag: The period of consolidation after the strong price movement. It takes the shape of a rectangle or parallelogram sloping slightly against the main trend.
- Breakout: End of consolidation phase, when price breaks above the flag pattern continuing the prevailing trend.
There are three main characteristics of Flag Pattern. The Characteristics are volume, duration and market context.
- Volume: During the initial move, formation of flagpole, volume increases. During the consolidation phase, the volume decreases indicating slowdown of trading activity. Volume increases again during the time of breakout, confirming the continuation.
- Duration: A flag pattern is a short-term formation that typically lasts between one and four weeks. If the consolidation lasts longer, the pattern becomes less reliable.
- Market context: The flag patterns are more reliable in strong and trending markets compared to sideways or choppy markets.
These components and characteristics collectively make the Flag Pattern a reliable continuation pattern used by traders for identifying entry, stop-loss, and profit target levels in trending markets.
Psychology behind Flag Pattern
The psychology behind the Flag pattern reflects how traders or investors behave during a pause in a strong market.
- Phase of Flagpole: A sudden change in prices indicates a high level of trader confidence and high engagement. This strong trend is fueled by the news, technical catalyst, or sentiment. It represents enthusiasm and hope in the movement.
- Phase of flag: Following the surge, the prices stabilise with profit-taking and hesitation equalising the market. The temporary equilibrium is achieved as a result of which buyers and sellers form a narrow range with a lower volume. This period will be a brief pause before the trend carries on.
- Breakout – New Dedication: With time, the pullback gains back traction again because traders consider the pullback as a rest rather than a retreat. Increase in volume validates conviction, and a break in price in the direction of the previous direction indicates continuation of the trend.
This pattern illustrates market psychology cycles of momentum, pause for profit-taking, and renewed commitment. It embodies how emotions like greed, caution, and optimism interact, making the flag pattern a useful tool for anticipating and trading trend continuations.
What are Types of Flag Pattern?
There are two main types of Flag Patter in technical analysis depending on the trend of the market. The types are Bullish Flag Pattern and Bearish Flag Pattern.
Bullish Flag Pattern
Bullish Flag Pattern forms during a strong uptrend where price rises sharply upward forming a flagpole. Price then consolidates slightly downward or sideways, creating the flag. The pattern confirms after price breaks above the upper boundary of the flag with volume.

Bearish Flag Pattern
Bearish Flag Pattern forms during a strong downtrend where prices fall sharply downward forming a flagpole. Price then consolidates slightly upward or sideways, creating the flag. The pattern confirms after price breaks below the lower boundary of the flag with volume.

These flag patterns are reliable continuation setups widely used for trading entry and exit decisions due to their clear price structures and trend indications.
How to Identify a Flag Pattern Correctly
To identify Flag Pattern, you must look for four key components. The components are strong trend, consolidation, boundary and volume.

- Look for a strong trending move (Flagpole): Spot a flagpole with a sharp, impulsive move long body candle indicating strong momentum. This impulsive price move could be upwards (bull flag) or downwards (bear flag).
- Look for consolidation ( Flag ): Find the consolidation channel that follows a small rectangular or parallelogram range that slopes slightly against the prior trend. The flag should not retrace more than 50% of the flagpole’s length, or the pattern becomes less reliable.
- Confirm the boundaries: Ensure the consolidation is bounded by two parallel and well-defined trendlines forming a flag-like rectangular or parallelogram shape.
- Check Volume: Volume should decrease during the flag formation (consolidation) and then surge on breakout in the direction of the prior trend.
- Breakout: Look for a clear breakout above (bull flag) or below (bear flag) the consolidation channel, confirming resumption of the trend.
Don’t confuse flags with pennants. Pennants converge into a triangle whereas flags are parallel channels. Use multiple timeframes to confirm the pattern’s validity and strengthen trading decisions.
How to Trade a Flag Pattern?
Trading a flag pattern involves identifying the pattern, taking entry, setting a stop-loss, and defining a profit target. The specific steps differ for bullish and bearish flags.
Bullish Flag Trading Strategy

- Identifying the pattern: Find a strong bullish upward trend (flagpole) and then a down or flat consolidation(flag).
- Entry: Enter long when the price breaks above the flag with increasing volume validating the breakout.
- Stop- Loss: Put your stoploss below the lower trendline or last swing low of the flag to reduce the risk on the downside.
- Target: Measure the length of the flagpole and extrapolate it upwards relative to the breakout point to establish profit target.
Bearish Flag Trading Strategy

- Identifying the pattern: Find a strong bearish downward trend (flagpole) and then a up or flat consolidation(flag).
- Entry: Enter short when the price breaks below the flag with increasing volume validating the breakdown.
- Stop- Loss: Put your stoploss above the upper trendline or last swing high of the flag to reduce the risk on the upside.
- Target: Measure the length of the flagpole and extrapolate it downwards relative to the breakout point to establish profit target.
Both strategies emphasize waiting for a confirmed breakout with volume, especially when executing a Bearish Flag Pattern trade, and managing risk through precise stop-loss placement. Additionally, setting realistic profit targets based on the initial flagpole length and using multi-timeframe analysis can significantly increase the reliability of any Bearish Flag Pattern setup.
How to Set Entry, Stop-loss, and Profit targets for a Flag Pattern?
To set entry, stop-loss, and profit targets for a Flag Pattern, here is a well-structured approach
Entry
Enter into trade when the price breaks decisively the boundary of the flag in the same direction as the former trend.
- In the case of a bullish flag, enter when the price breaks above the upper trendline of the flag consolidation.
- In the case of a bearish flag, enter when the price breaks below the lower trendline of the flag consolidation.
Alternatively, wait until a pullback to re-test the breakout level to achieve a more optimal risk-reward positioning.
Stop-Loss
Put stoploss just below the other side of the flag consolidation.
- In the case of bullish flags, put stoploss just below the lowest point of the flag or slightly below the trendline support.
- In the case of bearish flags, put stoploss just above the highest point of the flag or slightly above the trendline resistance.
You can also use EMA as a dynamic stoploss, alternative indicator for stop-loss placement.
Profit Target
Measure the length of the flagpole (first strong price action before consolidation). Project this length in the direction of the trend of the breakout point. Use Fibonacci extension levels (e.g., 1.618) for additional precision in target setting.
This setup combines clear entry and exit rules with disciplined risk management, enhancing the probability of successful trades using the flag pattern.
What is an Example of Flag Pattern in Trading?
Lets understand the Flag pattern in trading by taking a real life example of stock Dixon Technologies LTD.
Flagpole Formation: On 17th May 2023, Dixon Tech saw higher volume compared to previous four months average days volume. Since then price catched the momentum and saw a massive trending move of 57% with a big volume within 32 days. This forms the initial flagpole of the pattern.

Flag Formation: After this sharp move, Price went under consolidation for 42 days forming flag patter sloping downwards. Volume also got reduced during this consolidation period.

Breakout and Continuation: After Flag formation, on 3 Aug 2023, price breakout of flag pattern with a big volume confirming the pattern. After breakout, price continued its previous uptrend.

Is Flag Pattern Bullish or Bearish?
Flag Pattern can be both bullish and bearish, depending on the direction of the preceding trend. Flag Pattern is a continuation pattern, which means it continues the prevailing trend, doesn’t reverse it. A flag is considered to be bullish when it appears in an uptrend, whereas a flag is considered bearish when it appears during a downtrend.
Which Time-frame is Best to Trade a Flag Pattern?
The best time-frame for trading a flag pattern depends on your trading style and goals. The pattern itself is versatile and appears across all timeframes, but higher timeframes like 1-hour, 4-hour, and daily are more reliable, offering clearer structures and stronger trend continuation signals.
| Trader Type | Recommended Timeframe | Pattern Strength | Characteristics |
| Intraday | 5-min to 30-min | Moderate | Quick formations; best after strong intraday momentum or news-based moves. |
| Swing | 1-hour to Daily | Strong | Clearer structure; reliable continuation setups with volume confirmation. |
| Positional | Daily to Weekly | Very Strong | Long, well-defined patterns showing institutional participation and strong trend conviction. |
How Reliable is Flag Pattern in Trading?
The Flag Pattern is considered to be one of the best continuation patterns in technical analysis especially when confirmed by volume and strong momentum of both the trends. Its success rate, however, depends on the context and time frame of the market.
According to Thomas Bulkowski in Encyclopedia of Chart Patterns (2nd Edition)
- Bullish Flags: 65–75% success rate, depending on trend strength and breakout conditions.
- Bearish Flags: Slightly lower reliability, around 62–68%.
Flag pattern has a high reliability on higher time frames such as daily or weekly, whereas the reliability is less on lower time frames such as 1-5 min.
| Timeframe | Reliability | Key Observation |
| Higher Timeframes (Daily/Weekly) | High | Stronger flagpole momentum and cleaner breakouts supported by volume. |
| Lower Timeframes (5–30 min) | Moderate | More prone to false breakouts and noise due to intraday volatility. |
How to Manage Risk when Trading the Flag Pattern?
Wait for Confirmed Breakout: Avoid entering too early. Wait until a candle closes above the flag with increasing volume, to confirm the real breakout. False breakouts are usually caused by entering too early or on low volume, subsequent prices occasionally break out only to reverse.
Position Stop-Loss Strategically: You can set your stop-loss just a bit below or above the flag for bullish and bearish trade respectively. The violation of these levels invalidates the pattern.
Have a Positive Risk-to-Reward Ratio: To calculate your potential profit (target) and potential loss (stop-loss distance), you need to know your potential profit before entering. The lower the better: 1 2 ratio, or in other words, your potential profit must be at least twice the potential loss.
Size Your Position Appreciatively: Depend on your base size on your total capital and risk-taking. To have a buffer through a drawdown, limit risk to 12% of your account on an individual trade.
Defend Profits with Trailing Stops: When the price is going in the right direction, use a trailing stop to take profits on as the trade unfolds. This will enable you to record long movements and reduce the effect of abrupt turns.
Flag Pattern vs Other Chart Patterns
Compared to other chart patterns, Flag Pattern stands out in terms of its simplicity, reliability and strong connection to market momentum. Unlike other chart patterns which signal either a reversal or a continuation, Flag Pattern only indicates trend continuation. While many chart patterns like triangle, wedges or head and shoulder can form in various market phases, the Flag pattern requires a well established trend.
Flag Pattern to the Pennant Pattern, both share the same psychology, a strong impulsive move followed by consolidation, but differ in structure and appearance.
Difference between Flag Pattern and Pennant Pattern
The difference between Flag Pattern and Pennant Pattern is mentioned below in the table.
| Feature | Flag Pattern | Pennant Pattern |
| Shape | Small rectangle or channel | Small symmetrical triangle |
| Trend Pause Type | Sideways or slightly sloping consolidation | Converging price movement forming a tight range |
| Trend Direction | Usually slopes opposite to the main trend | Typically horizontal or neutral in direction |
| Formation Lines | Parallel trendlines | Converging trendlines |
| Duration | Slightly longer consolidation | Usually shorter and more compact |
| Volume Behavior | Volume decreases during flag, then spikes on breakout | Volume tapers off during pennant, then rises sharply on breakout |
| Interpretation | Indicates a steady pullback before trend continuation | Indicates a brief indecision before strong breakout |
| Reliability | Highly reliable in strong trending markets | Equally reliable but often forms faster |
This comparison aligns with your provided table, consolidating various sources’ explanations for clarity and practical understanding.
What Type of Indicators can be used with a Flag Pattern?
There are four main types of indicator that can be used with Flag Pattern. The indicators are Volume, Bollinger bands, EMA and Fibonacci.
Volume: Volume is the heartbeat of the flag pattern. It typically spikes during the flagpole (strong trend move) and contracts during the flag (consolidation). An increase in volume on breakout confirms pattern validity.

Bollinger Bands: These bands represent volatility and price range. During flag consolidation, Bollinger Bands contracts suggest low volatility and pause. Bollinger expands once price breaks the flag, indicating increased volatility and trending move.

Moving Averages (MA): The 20, 50 or 200-period MAs are used to verify the existing trend. Bullish flags Price remaining above key moving averages indicates strength of trend; the vice versa happens with bearish flags. It acts as a dynamic support and resistance.

Fibonacci Retracement: Helps to estimate how much the flag had consolidated compared to the original flagpole. Support/resistance levels of the flag are determined with the assistance of common retracement levels (38.2%, 50%, 61.8), and enable specific entries and stop-loss levels.

These indicators combined with the flag pattern’s price action enhance trading confidence and improve risk management by confirming trend strength, breakout validity, and optimal trade placement.


 Previous Article


![15 Investing.com Alternatives [Free+Paid] You Should Use in 2026](https://www.strike.money/wp-content/uploads/2026/04/Investing.com-Alternatives.jpg "15 Investing.com Alternatives [Free+Paid] You Should Use in 2026 50")
![15 TradeStation Alternatives [Free+Paid] You Should Use in 2026](https://www.strike.money/wp-content/uploads/2026/04/TradeStation-Alternatives.jpg "15 TradeStation Alternatives [Free+Paid] You Should Use in 2026 51")
![15 Chartink Alternatives [Free+Paid] You Should Use in 2026](https://www.strike.money/wp-content/uploads/2026/04/Chartlink-Alternatives.jpg "15 Chartink Alternatives [Free+Paid] You Should Use in 2026 52")


 : Definition, Formula, calculation, Uses, Advantages Vs limitations 56")


No Comments Yet.