The Pennant Pattern is a classic pattern for technical analysts and is identifiable by a large price move followed by a unification period and a breakout. A Pennant is a type of continuation pattern formed when there is a large movement in security known as the flagpole. The Pennant Pattern is identical to the flag pattern in its setup and implications, but the only difference is that the consolidation phase of a Pennant Pattern is characterised by converging trend lines rather than parallel trend lines. The patterns that appear in financial markets are used by traders to predict future market movements.
Bullish and Bearish are the main two kinds of Pennant patterns. A Bullish Pennant Pattern occurs in strong uptrends. Traders aim to close their position, assuming a reversal is on the horizon during this period. The Bearish Pennant Pattern occurs after a significant decrease in a financial instrument’s price. Following a long downtrend, traders aim to close their short positions, assuming that a trend reversal will materialise. Traders place a buy limit order at the top trendline when trading a Bullish Pennant. Traders place the price target sell order at the height of the initial flagpole in addition to the breakout price. They would typically place a stop loss order under the lower trendline to manage risk. Traders place a sell limit order at support or the lower trendline during a bearish pennant. The cover price is set at the difference between the height of the initial flagpole and the breakout phase. Traders place a stop loss above the resistance or the upper trendline.
Traders usually use the pennant pattern to predict upcoming price movements. The pennant pattern, which is the consolidation period between two converging trend lines, forms the shape of a pennant.
What is a Pennant Chart Pattern in Technical Analysis?
A pennant chart pattern in technical analysis is a continuation pattern that forms after a significant price movement in a financial market. Pennant Chart Pattern is considered a short-term consolidation pattern that shows a brief pause in the existing trend before the price resumes its previous direction. The formation of the pattern suggests that market participants are taking a temporary break, catching their breath, and consolidating their positions. This indicates a period of indecision and balance between buyers and sellers. This consolidation is followed by a decrease in trading volume as market participants wait for a significant news event to drive the pricing in the prevailing trend’s direction. There are mainly four key components of a pennant chart pattern: Pole, Flag, Volume, Breakout.

Traders and investors use the pennant pattern to identify potential entry points, set price targets, and manage risks by placing stop-loss orders. The technical analysis chart pattern is formed by two converging trendlines that resemble a small, symmetrical triangle. It is important to confirm the pattern with other indicators and tools to reduce false signals and increase the probability of successful trades.
How important is Pennant Chart Pattern in Technical Analysis?
The Pennant Chart Pattern is a continuation pattern that typically appears, indicating a brief consolidation or pause before the price moves forward in the direction of the prior trend. The pennant, according to traders, is a time when the market is uncertain and buyers and sellers are temporarily balancing one another.
Trading volume tends to decline, indicating decreased market participation and reduced volatility. This decrease in volume will be a confirmation of the consolidation phase. Traders use the pennant pattern to estimate potential price targets. The height of the pennant’s mast will be projected from the breakout point to estimate a target for the price movements after the pattern completes. The pennant pattern is also useful for managing risk. The pennant pattern is a reliable signal for traders, as it indicates that the market is likely to continue its prior trend.
How does a pennant chart pattern work in technical analysis?
A pennant pattern is a type of continuation pattern formed when there is a large movement in a security in technical analysis known as the flagpole, followed by a consolidation period with converging trendlines. A pennant pattern is preceded by a strong up or down move that resembles a flagpole. Many traders look to enter new long or short positions following a breakout from the pennant chart pattern. The trendlines of a pennant pattern represent a period of indecision among traders, with traders taking a break before deciding the direction of the next move. Traders place a long entry order above the upper trendline with a stop loss order below the lower trendline.
What are the key features of a pennant chart pattern?
The pennant pattern exhibits a continuation of the downward or upward trend. Every pennant pattern will have two breakout points. They show a triangular shape at the end of the consolidation period. The main five key features of a pennant chart pattern are as follows:
- Trendlines: A pennant chart pattern is formed when a narrow triangle shape is formed between two trend lines that are converging.
- Price consolidation: The pattern is characterised by a period of price consolidation, where the price moves in a narrow range, forming a flagpole-like structure.
- Volume: Volume tends to decrease during the consolidation period and pick up on the breakout.
- Breakout: The breakout from the pennant pattern occurs in the direction of the previous trend and is accompanied by a sharp decrease in trading volume.
- Targets: The distance between the height of the flagpole and the base of the pennant is be used to calculate the price target for the breakout.
The pennant pattern is a short-term pattern that is completed within one to three weeks. The pennant patterns are described as bullish or bearish depending on the direction of the movement.
What happens after a pennant chart pattern?
Traders look for a breakout to occur after a pennant chart pattern. A breakout happens when the price moves rapidly above or below the boundaries of the pennant pattern. The preceding trend was upward; a bullish breakout would involve the price breaking above the upper trendline of the pennant, indicating a continuation of the uptrend. A bearish breakout would occur when the price breaks below the lower trendline, showing a continuation of the trend if the preceding trend was downward. It is accompanied by an increase in trading volume when a breakout occurs, which confirms the validity of the breakout. Traders will enter positions in the direction of the breakout, anticipating further price movement in the same direction as the preceding trend. The price will continue its trend after a successful breakout, and traders monitor subsequent price action and use further technical analysis to identify potential target or exit points.
How can pennant chart patterns identify trend continuation?
Pennant chart pattern helps to identify trend continuation based on their structure and principles of technical analysis. Pennant patterns indicate trend continuation depending on six major factors as given below. The existence of a clear trend before the formation of the pennant is crucial for identifying trend continuation. Pennants are characterised by two converging trendlines. The consolidation phase within the pennant pattern represents a temporary pause or rest in the prevailing trend, trading volume decreases during the formation of the pennant which reflects reduced market participation. A breakout occurs when the price moves above the upper trendline or below the lower trendline. Traders use a measuring technique to estimate a potential price target after the breakout. Traders should use additional analysis tools and indicators to confirm and take a trend decision.
What are the types of pennant chart patterns?
The pennant pattern is a continuation that forms during a period of consolidation in a financial market. There are mainly two types of pennant chart pattern: Bullish pennant pattern & Bearish pennant pattern. Both the patterns are characterised by decreasing volume during the consolidation period. This decreasing volume is followed by a surge in volume and the price breaks out of the pattern, confirming the continuation of the trend.
The patterns worth considering that variation of the pennant pattern occurs, such as the ascending pennant (bullish) and descending pennant (bearish) , where the trendlines have a slight upward or downward slope, respectively these variations still exhibit the converging triangle shape and follow a similar breakout principle.
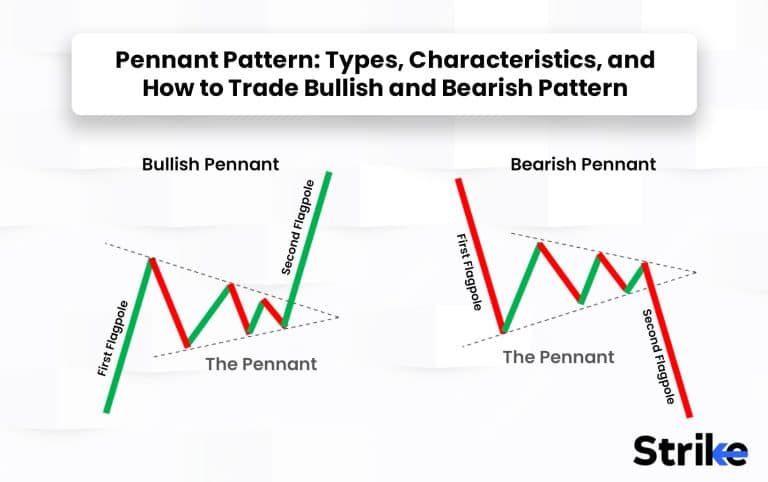
1. Bullish pennant pattern
A bullish pennant is a technical trading pattern that shows the impending continuation of a strong upward price move. The pattern indicates the continuation of a bull market. They are formed when a market makes an extensive move higher and then pauses, consolidating between converging support and resistance levels.

The bullish pennant pattern will occur over lots of different time frames. A trader needs to watch two elements to identify a bullish pennant. A pronounced upward movement beforehand is known as the pole. Secondly, a price consolidation forms a roughly symmetrical triangle with its support and resistance lines. It’s important not to confuse a bullish pennant with other patterns such as triangles, falling wedges, and bullish flags. The bullish pennants break out when the market moves beyond its resistance levels.
2. Bearish pennant pattern
A bearish pennant pattern is a technical trading pattern that shows the impending continuation of a downward price move. They are the opposite of bullish pennants: the market pauses on a significant move down.

A trader should look for consolidation between support and resistance after a major bearish price move called the pole to identify a bearish pennant. The support and resistance lines will form a roughly symmetrical triangle, showing that the market is in a conflict between positive and negative sentiment. The strong negative sentiment causes the market to plummet lower in a bearish pennant. The sellers that have pushed their price down then back off and take profit, while the bulls sense the potential for a bounce back. The bearish pennants break out when the market moves beyond its support line.
What is the best way to trade a pennant pattern?
Trading the pennant pattern involves a combination of technical analysis and risk management. There are mainly seven important steps to trade a pennant pattern.
A pennant pattern is characterised by a small symmetrical triangle formed after a sharp price move. Confirm that the trader is observing a valid pennant pattern by analysing the price action and volume.
Pennants are either bullish or bearish. Determining the direction of the trend preceding the pennant pattern helps identify if it is a bullish or bearish pennant.
The entry point should be after a breakout from the pennant pattern. A breakout occurs when the price breaks above the upper trendline or below the lower trendline. This breakout should really be accompanied by increased volume, indicating strong buying or selling pressure.
It is important to wait for confirmation of the breakout to minimise false breakouts. Allowing some candles to close beyond the pattern provides confirmation.
Determine the risk tolerance and set a stop loss order just outside the pennant pattern. This helps limit potential losses when the breakout fails. The stop loss should be placed accordingly either above or below the pattern.
Based on the risk tolerance and the distance between the entry point and the stop loss level, determine the appropriate position size for the trade. The wider the stop loss, the smaller the position size should be.
Keep a close eye on price action and volume once the trade is entered. Monitor the movement to ensure the breakout continues in the expected direction. Be ready to exit if the price fails to move as anticipated after the breakout.
How to trade a Bullish Pennant Pattern?
The bullish pennant consists of three main elements – a flagpole, the pennant formation, and a breakout.

The flagpole is the initial strong uptrend defined by a series of higher highs and higher lows. After this sharp move up, the asset’s price consolidates in a pennant formation marked by lower highs and higher lows. This symmetrical triangular pattern should not retrace more than 50% of the flagpole move.
The breakout finally occurs when the price breaks above the upper trendline of the pennant with increased trading volume. This signals a resumption of the uptrend.
Ideally, the shorter and shallower the consolidation, the stronger the ensuing breakout. A textbook bullish pennant corrects only to the 38.2% Fibonacci retracement level before breaking out.
To trade the pattern, wait patiently for the breakout before taking a long position. The breakout candle closing above the pennant signals an entry point. A protective stop loss can be placed just below the breakout candle or the lower trendline of the pennant.
An alternative is to wait for a throwback to the broken trendline and enter on this retest which offers a better risk-reward ratio. However, the throwback may not always materialize.
The take profit target is projected at a distance equal to the flagpole move. If the flagpole rallied 100 pips before the pennant formed, the profit target is 100 pips up from the breakout level.
Closely monitor the volume and price action for confirmation of the breakout. Other indicators can also be checked for validation. Manage risk accordingly by sizing positions as per the stop loss distance.
How to trade a Bearish Pennant Pattern?
A Bearish pennant is a technical trading pattern that indicates the impending continuation of a downward price move. Trading a bearish pennant pattern involves anticipating a potential downward continuation of the prior trend. There are mainly 6 steps to trade a bearish pennant pattern they are as follows:
- Identify the bearish pennant pattern: The first step to trade a pennant pattern is to correctly identify the bearish pennant pattern on a price chart.
- Wait for confirmation: The next step is to confirm its validity and look for specific characteristics such as a sharp initial price drop that forms the flagpole, followed by lower volume during the consolidation phase.
- Determine entry point: The entry point is typically below the lower trendline, as it confirms the continuation of the existing downtrend.
- Set stop loss and take profit levels: set a stop loss order just above the upper trendline of the bearish pennant pattern to manage risk .
- Manage risk and monitor the trade: Monitor its process once a trader enters the trade closely. It can reduce risk of the trade.
- Review and learn: Review the outcome and analyse the trade’s performance after closing the trade.
Trading involves risk, and a trader always conducts thorough analysis, adapts the trader’s approach to current market conditions, and considers using a combination of technical indicators, price patterns, and fundamental analysis.
What indicator is best to trade with a pennant pattern?
Indicators are useful for confirming signals and providing additional insights. Volume indicators are one of the most important indicators. Trading volume provides valuable information about the strength of price moves and the confirmation of breakout signals. Volume indicators such as the On Balance Volume (OBV), Volume Weighted Average (VWAP), and Money Flow Index (MFI) help traders assess the buying and selling pressure during the pennant pattern formation and breakout.
Is it possible to Trade a pennant pattern with Fibonacci Retracement ?
Yes, Fibonacci retracements are used in combination with a pennant pattern to identify potential entry and exit points for trading. It is a technical analysis tool that helps identify support and resistance levels based on the Fibonacci sequence.
There are mainly four steps to trade the pennant pattern with Fibonacci retracement. Identify the pennant pattern, select the relevant, identify potential support and resistance levels, and confirm with price action.
Can a pennant pattern be traded with Moving Averages (MA)?
Yes, moving averages (MA)are used in conjunction with a pennant pattern to enhance the trading strategy. Traders use moving averages to confirm the formation of the pennant pattern. Moving average lines are very powerful in determining the direction of the trend.
When is the best time to Trade a Pennant pattern?
The best time to trade a pennant pattern is during the breakout phase, when the price breaks above or below the pattern’s boundaries. This is when the price is expected to resume its prior trend with increased momentum. Traders should look to enter the trade on confirmation of the breakout after a sudden sharp move in price. Trading during the breakout offers the potential to capture a significant price move. There are mainly five key points to consider to trade a pennant pattern at its best time, including the formation of the pattern, price breakout, confirmation signals, timeframe consideration, and risk management.
What is the accuracy rate of a pennant pattern?
The accuracy rate of a pennant pattern cannot be quantified with a specific accuracy percentage. The pennant patterns are subjective in nature and rely on visual interpretation. The accuracy rate of the pattern differs depending on market conditions, timeframe, volume, and other confirmation indicators. The accuracy rate will also vary among traders and investors due to differences in individual skills, experiences, risk management techniques, and their ability to interpret patterns and market signals effectively. But pennant patterns alone do not guarantee accurate predictions of future price movements.
Is the pennant pattern profitable?
Yes, the pennant pattern has the potential to be quite profitable if traded correctly. Its ability to identify consolidations within strong trends makes it a high probability continuation pattern. The pattern provides clearly defined entry, stop loss and take profit levels. Traders have the potential to capture large moves if the breakout from the pennant aligns with the direction of the preceding trend.
Is Pennant Pattern for beginners?
The pennant pattern is suitable even for beginners as it is straightforward to identify and trade. Its visual shape as a small symmetrical triangle is easy to recognize. Rules for entries and stop losses are clearly defined based on breakouts. With some practice, beginners can learn to spot pennants and trade them profitably.
What are the common mistakes Traders make when Trading a Pennant Pattern?
Entering trades before the breakout is one of the common mistakes while using a pennant pattern. This leads to losses if the breakout fails. It’s best to wait for confirmation. Below are six more mistakes.
- Inaccurate stop loss placement. Stop losses placed too close or too far from the pattern can increase risk.
- Not validating with other indicators. Over-reliance on pattern without cross-checking can lead to false signals.
- Poor risk management. Inadequate position sizing relative to stop loss.
- Lack of patience. Impulsive entries without waiting for optimal setups.
- Forceful trading against the trend. Not trading in the direction of the preceding trend.
- Letting losses run and not sticking to stop loss levels.
With proper analysis, validation, risk management and discipline, traders can avoid these mistakes and improve pennant pattern trading outcomes.
What is the difference between a Pennant pattern and a Flag pattern ?
The pennant pattern and flag pattern are identical in their setup and implications, but the only difference is that the consolidation phase of a pennant pattern is characterised by converging trend lines rather than parallel trendlines. The two patterns are commonly found in the price charts of financially traded assets. They are a continuation pattern and form when asset prices fall sharply.
The flag pattern is encompassed by two parallel lines, these lines will be flat or pointed in the opposite direction of the primary market trend. The pennant pattern is characterised by converging trend lines and has a triangular shape. The breakout from the flag pattern occurs in the direction of the initial price move, indicating a continuation of the prior trend. The breakout from a pennant pattern occurs in either direction as it is not biassed towards the direction of the prior trend.


 Previous Article


![15 Investing.com Alternatives [Free+Paid] You Should Use in 2026](https://www.strike.money/wp-content/uploads/2026/04/Investing.com-Alternatives.jpg "15 Investing.com Alternatives [Free+Paid] You Should Use in 2026 52")
![15 TradeStation Alternatives [Free+Paid] You Should Use in 2026](https://www.strike.money/wp-content/uploads/2026/04/TradeStation-Alternatives.jpg "15 TradeStation Alternatives [Free+Paid] You Should Use in 2026 53")
![15 Chartink Alternatives [Free+Paid] You Should Use in 2026](https://www.strike.money/wp-content/uploads/2026/04/Chartlink-Alternatives.jpg "15 Chartink Alternatives [Free+Paid] You Should Use in 2026 54")
: Overview, 10 Types of Indicators, Settings for Different Markets 56")

 : Definition, Formula, calculation, Uses, Advantages Vs limitations 58")


: How We Used This 70/30 Indicator in 6 High Win-rate Strategies 61")


No Comments Yet.