A rising wedge pattern is a price chart candlestick formation that signals a bearish trend reversal. A rising wedge pattern is formed by two converging trend lines. Rising wedge patterns indicate the potential of an upcoming bearish reversal, as the breakout usually takes place through the lower trend line.
Rising wedge patterns are commonly formed during uptrends in security prices. The convergence of the two trend lines of the rising wedge pattern indicates an upcoming bearish trend reversal as the price breakouts into a downward price movement. The three key features of a rising wedge pattern include a temporary uptrend in the price action, a decline in the trading volume, and the convergence of the two trend lines. Traders use trading strategies such as shorting to trade the rising wedge pattern. The five main advantages of the rising wedge pattern include its ability to predict upcoming bearish reversals, its accuracy and reliability, its ability to be used in all financial markets, the opportunity for a good risk ratio, and the ability to be used in different time frames. The five main disadvantages of the pattern include its tendency to seem ambiguous, its tendency to signal trend continuation as well as a trend reversal, its tendency to be identified incorrectly, its tendency to produce false signals, and the difficulty involved in trading with the pattern.
What is a Rising Wedge Pattern in Technical Analysis?
A rising wedge pattern is a bearish trend reversal candlestick formation that is found on price charts. A rising wedge pattern belongs to the class of wedge patterns, which are represented by converging trend lines for trading periods ranging from ten to fifty. The rising wedge pattern is also known as an ascending wedge pattern. A rising wedge pattern, as the name suggests, resembles a wedge with an upward slope.
The rising wedge pattern comprises two upward-sloping trend lines that move towards one another. Trend lines are the lines that traders and analysts draw on price charts in order to gain an understanding of the direction of a security’s price movement.
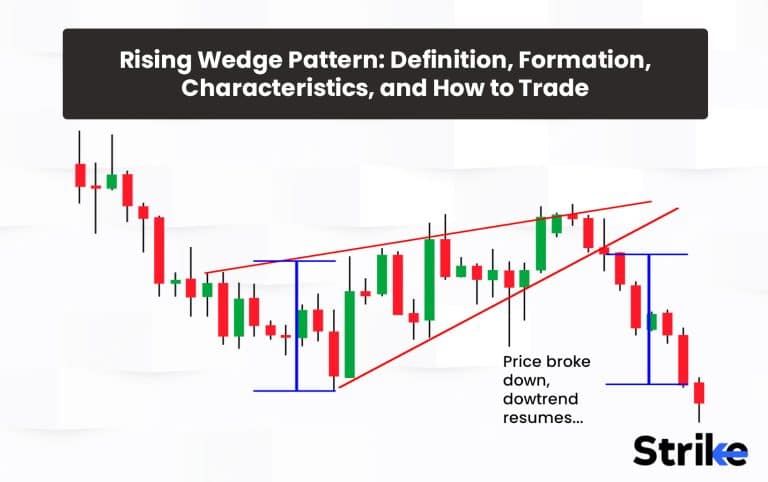
Trend lines are drawn over the pivot highs and below the pivot lows of the price chart, and they represent the resistance and support levels of the security for a specific time period. The trend lines in a rising wedge technical analysis chart pattern move upward and then converge at a point known as the apex. Rising wedge patterns signal imminent bearish trend reversals. The rising wedge pattern is most useful to traders due to its reliability. The image below indicates a rising wedge pattern.

The image shows that the rising wedge patterns begin with a wide range between the two trendlines and taper as the price moves higher. Towards the end of the rising wedge pattern, the trading range gets narrower and narrower. The image shows that the price breaks out into a bearish downtrend following the convergence of the two trend lines.
What is the other term for Rising Wedge Pattern?
The rising wedge pattern is also known by the ascending wedge pattern. The ascending wedge pattern, as the name suggests, refers to the wedge patterns in which the trend lines are on the ascend. The ascending wedge patterns are characterized by ascending or upward-sloping trendlines. An ascending wedge pattern signals an imminent bearish trend reversal. The bearish trend reversal occurs once the two ascending trend lines converge at one point and a breakout occurs through the lower trend line.
How does a Rising Wedge Pattern in Technical Analysis work?
The rising wedge pattern works in technical analysis by helping traders predict upcoming bearish trend reversals. The rising wedge pattern tells traders and analysts that the trading range is decreasing as the two trend lines move closer and closer to one another. Trading range refers to the gap between the high and low prices in a particular time frame. A narrow trading range signifies that buying and selling are balanced and that a reversal is imminent. Traders and analysts use the rising wedge pattern in technical analysis to plan their trading strategies according to upcoming market trends.
What is the importance of a Rising Wedge Pattern in Technical Analysis?
The primary importance of the rising wedge pattern in technical analysis lies in its reliability. The rising wedge pattern is considered one of the most consistent of all candlestick patterns. The pattern has a very good record of accurately predicting trend reversals. The predictions of the rising wedge pattern help traders plan or alter their trading strategies accordingly, as it gives them a sense of the potential direction of the price action.
How is a Rising Wedge Pattern formed?
A rising wedge pattern is most often formed during a bullish trend. The rising wedge pattern resembles a wooden wedge with an upward slope. The image below depicts the rising wedge pattern formation.

The image shows that the rising wedge pattern formation begins when the trading range is wide, indicating that there is a large difference between the opening and closing prices. The buyers or bulls are thus in a more dominant position at the start of the rising wedge formation. The two red lines in the image above are the trendlines, and the trading range is represented by the gap between the two trendlines. The lower trendline of the pattern has a steeper slope than the upper trendline, implying that the lows are catching up with the highs.
The image shows that the highs and lows get higher and higher with time. The gap between the trendlines narrows as time progresses, indicating that the buyers are losing their dominant position. The two trend lines converge towards the end of the pattern. The convergence indicates a lull in the trading activity and signals a potential trend reversal to a downtrend. The bearish reversal is set into action once a breakout occurs through the lower trend line. The rising wedge pattern formation is mostly accompanied by a steady decrease in trading volume.
How often does a Rising Wedge Pattern occur?
The rising wedge pattern has no definite occurrence frequency. The rising wedge pattern is most commonly found towards the end of strong and prolonged bullish trends. The rising wedge pattern requires a strong bullish trend to be in action to form, as there must be a prior bullish trend for the pattern to reverse. The trend is considered to be reversed once the rising wedge breakouts. The occurrence of the rising wedge pattern thus depends on market conditions and the ongoing trends in the market.
How long does a Rising Wedge Pattern last?
The strongest rising wedge pattern occurs three to six months after a bullish trend is in place. The bearish trends that follow strong rising wedge patterns tend to last a minimum period of a few months. Weaker rising wedge patterns form over intraday time frames, although these are not easy to spot, and trend reversals that follow them tend to be short-lived ones.
What happens after a Rising Wedge Pattern?
A bearish trend reversal happens once a rising wedge pattern is formed. The trend is considered to be reversed once the rising wedge breakouts. The converging trend lines of the rising wedge pattern indicate indecision in the market sentiment as the buying and selling are equalised. The indecision is followed by a downward movement in the price action. The trend is considered to be reversed once the rising wedge breakouts.
What are the key features of the Rising Wedge Pattern?
There are three key features of the rising wedge pattern. These three key features are central to determining whether the pattern is classified as a rising wedge pattern or not. The three key features are listed below.
- A temporary uptrend in the price action
The rising wedge pattern is always accompanied by a temporary uptrend in the price action. The uptrend in the price action is reflected by the two upward-sloping trendlines. The highs move higher, and the lows move even higher, during the formation of a rising wedge pattern.
- A decline in the trading volume
The second key feature of the rising wedge pattern is that it is almost always accompanied by a steady decrease in trading volume. The decrease in trading volume indicates that there is a prevalent lull in the market sentiment and that the sellers are about to take over the buyers and drag the security prices down.
- The convergence of the two trend lines
The convergence of the two trend lines is another key defining feature of the rising wedge pattern. The converging trendline depicts the narrowing of the trading range and indicates that a trend reversal is about to take place.
Each of the features of the rising wedge pattern contributes to the significance of the pattern and what meaning or information they give to traders and analysts. The features together warn traders of imminent trend reversals.
How to Identify the Rising Wedge Pattern in the Price Chart?
The rising wedge pattern is identified using its distinct formational structure. The three main criteria to be kept in mind to identify the rising wedge pattern are listed below. The steps have been explained using the image below, which portrays how the rising wedge pattern can be easily identified.
- The two upward-sloping trendlines
The first aspect is the presence of two trendlines with upward slopes. The two black lines (plain and dotted) in the image above are the trendlines, of which the upper indicates the resistance level and the lower the support level.
- The narrowing of the trendlines
The second aspect of the rising wedge pattern is the narrowing of the trendlines. The trendlines begin with a wide range between them. The range between the trendlines grows narrower as time progresses. The image above shows how the pattern tapers off with the passage of time.
- The convergence of the trendlines
The third and final aspect of identifying the rising wedge pattern is the convergence of the two trendlines. The two lines seem to converge at a point which is known as the apex. The apex is the point where the pattern breakouts from the lower trendline to start the bearish trend reversal. The convergence shows that the trading range has reached a null point and that a trend reversal is imminent.
Traders and investors can easily spot the rising wedge candlestick pattern by paying attention to the three main criteria. The bearish reversal is set into action once a breakout occurs through the lower trend line.
How to Trade a Rising Wedge Pattern in the Stock Market?
There are mainly 6 steps to keep in mind when trading the rising wedge pattern. These steps range from identifying the rising wedge pattern to entering the trade and setting stop-loss orders and profit targets. The six main steps to trade a rising wedge pattern are listed below.

- Identification of the rising wedge pattern
The first step to trading a rising wedge pattern is identifying the pattern. Traders must closely study price charts, looking out for the distinct structure of the rising wedge pattern. The rising wedge pattern looks like a wedge with an upward slope. The two trendlines of the rising wedge pattern cover the high and low price points of the security over a particular period of time. The two trendlines taper off with time and finally converge at a point known as the apex. The image below shows the start and formation of the rising wedge pattern.
- Identification of the breakout
The second step to trading a rising wedge pattern is identifying the breakout point of the rising wedge pattern. The breakout point refers to the point where the price of the security breakout of the lower trend line or support line, marking the beginning of the bearish trend reversal.
- Confirmation of the breakout
The third step to trading a rising wedge pattern is confirming the breakout of the rising wedge pattern. The breakout point is confirmed by checking whether the trendlines are drawn accurately, covering all the pivot highs and lows, and cross-checking to see that the breakout point falls outside the trendlines.
- Entering the trade
The fourth step to trading a rising wedge pattern is entering the trade. Traders commonly sell long positions when the security price falls below the lower trendline of the rising wedge pattern or resort to shorting. The image below shows the point where traders tend to sell short positions.

- Placing the stop-loss order
The fifth step to trading a rising wedge pattern is placing a stop-loss order. A stop-loss is an order to automatically sell securities when the price reaches a certain level. Stop-loss prevents high losses. The placement of stop-losses depends on the trader’s appetite for risk. Aggressive traders place stop-loss orders at higher prices, such as just above the point on the upper trendline that lies opposite the breakout point. Conservative traders, on the other hand, choose to place them at a lower price point. The image below depicts the placement of the stop-loss order.
- Setting a profit target
The sixth and final step to trading a rising wedge pattern is setting a profit target. The profit target for a rising wedge pattern is commonly placed at the beginning of the upper trendline of the pattern. The image below shows where the profit target is placed.
Investors and traders in the stock market can use the same steps to trade the rising wedge pattern in other financial markets including the forex and commodities markets. The rising wedge pattern is considered a reliable pattern and investors and traders can profit from trading it, especially when it is used along with a sound market analysis and other technical indicators.
What is the best Trading Strategy for the Rising Wedge Pattern?
The best trading strategy for the rising wedge pattern is to either sell long positions right when the security price breaks out of the lower trend line or sell short positions. Traders tend to sell short positions once the breakout of the rising wedge pattern is confirmed to make maximum gains from the bearish trend reversal. It is important to note, however, that shorting is a strategy that involves risk and is undertaken by more experienced traders.
When is the best time to trade a Rising Wedge Pattern?
The best time to trade a rising wedge pattern is right after its breakout from the lower trendline. The breakout point is the best time to trade the pattern, as it is the breakout point that brings the first confirmation of an upcoming bearish trend reversal, and selling short positions at the point maximises the traders’ gains. Other technical indicators are used along with the rising wedge pattern to confirm its signals, as the rising wedge pattern is almost always accompanied by a decline in trading volume.
Can you trade a Rising Wedge Pattern with Bollinger Bands?
Yes, Bollinger Bands are used along with the rising wedge pattern for trades. Bollinger Bands are momentum-based indicators that indicate oversold and overbought levels in a price chart. The Bollinger Band signals is used to cross-check the rising wedge pattern signals before entering trade positions. The upcoming bearish trend reversal is confirmed if the breakout of the rising wedge pattern is accompanied by the security price going below the lower Bollinger Band.
Can you trade a Rising Wedge Pattern with RSI?
Yes, the Relative Strength Indicator (RSI) can be used along with the rising wedge pattern for trades. RSI are momentum-based indicators that indicate oversold and overbought levels in a price chart. The RSI signals can serve as a way to cross-check the rising wedge pattern signals before entering trade positions. The upcoming bearish trend reversal is confirmed if the breakout of the rising wedge pattern is accompanied by the security price going below a certain level of the RSI.
What is the price target of the Rising Wedge Pattern?
The price or profit target for a rising wedge pattern is commonly placed at the beginning of the upper trendline of the pattern. The low price target shows that the traders believe that the bearish trend will drag the prices to the level of the price target.
How accurate is the Rising Wedge Pattern?
The rising wedge pattern is considered a highly accurate pattern. The rising wedge pattern has proven to be a good indicator of upcoming bearish reversals. The pattern is very effective in helping traders plan out their trading strategies to suit the upcoming bearish market.
How effective is the Rising Wedge Pattern?
The rising wedge pattern is considered a fairly effective pattern owing to its accuracy rate of 81%, as per Liberatedstocktrader.com. The pattern effectively predicts upcoming bearish reversals which in turn helps investors and traders alter their trading strategies according to the upcoming market conditions. The effectiveness and reliability of the pattern increased by using it in conjunction with other technical indicators such as the Moving Averages, Relative Strength Indicator (RSI) or Bollinger Bands.
Is a Rising Wedge Pattern Profitable?
Yes, the rising wedge pattern is profitable when traded using appropriate trading strategies, such as shorting. The rising wedge pattern can also be combined with other momentum-based technical indicators to cross-check its signals and minimise the risk involved in using the pattern in isolation.
What is an example of a Rising Wedge Pattern used in Trading?
An example of the use of the rising wedge pattern in trading is given below with the help of the price chart.

The image shows that the market is in a bullish trend at the start of the formation of the rising wedge pattern. The two trend lines, which represent the resistance and support levels, are shown in blue colour. The trading range between the two trendlines is wide, at the start,. The trading range narrows as time progresses. The price breakouts of the lower trendline at the price of $786.60 indicate an upcoming bearish trend.
The breakout of the rising wedge pattern coincides with a decrease in trading volume, as indicated by the results from a momentum-based technical indicator. The signals of the rising wedge pattern are thus confirmed by the decreasing trading volume. Traders can enter short positions at the price of 786.60. The image below shows the position of the short entry. Profit targets are placed at the beginning of the upper trendline of the pattern.
How can Technical Analysis benefit from a Rising Wedge Pattern?
There are five main benefits to using the rising wedge pattern in technical analysis. The most important benefit is that it predicts upcoming trends, using which traders can plan their strategies. Other benefits include its accuracy and reliability, its ability to be used in all financial markets, the opportunity for a good risk ratio, and the ability to be used in different time frames. The five benefits are listed in detail below.
- Ability to predict upcoming trend reversals
One of the main benefits of the rising wedge pattern is its ability to predict upcoming trend reversals. The pattern warns traders of a potential and imminent downward trend and helps them plan out their trading strategies accordingly.
- Accuracy and reliability
The rising wedge pattern is considered a fairly accurate pattern with a good track record of accurately predicting upcoming trend reversals. The accuracy of the rising wedge pattern is about 81%. Several traders rely on the rising wedge pattern to plan their trading strategies.
- Ability to be used in all financial markets
Another main benefit of the rising wedge pattern is its versatility. The rising wedge pattern is used in all financial markets from stock markets to forex markets and the commodities market.
- Ability to provide good reward-risk ratios
Rising wedge patterns tend to have good risk ratios to traders trading with them. Reward-risk reward refers to the ratio of the potential profit to the potential risk. Traders who place stop-loss orders at the upper trendline opposite to where the price breakouts and profit targets at the start of the pattern tend to obtain a good reward-risk ratio with the pattern.
- Ability to be used in different time frames
The rising wedge pattern is also versatile in its ability to be used in different time frames. The rising wedge pattern is used for a range of time frames from intraday ones to timeframes lasting for months.
The rising wedge pattern is used along with stop-loss orders to reduce the risk involved in trading the pattern to a minimum. A stop loss order is placed right above the upper trendline at the point that is right opposite to the breakout point of the pattern.
What are the Risks of a Rising Wedge Pattern?
There are mainly five risks to trading with a rising wedge pattern. The risks mainly stem from the pattern seeming unclear to beginner traders and the tendency of the patterns to sometimes signal trend continual rather than trend reversals. The five main disadvantages are listed in detail below.
- Tendency to seem ambiguous
The rising wedge pattern can seem ambiguous to traders, particularly those who are new to trading and candlestick patterns. The pattern is rather hard to identify for beginner traders.
- Tendency to signal trend continual as well as reversal
Another main limitation of the rising wedge pattern is that it signals both trend reversals and trend continual. The rising wedge pattern can sometimes signal a trend continual when formed within a downtrend, making it hard for traders to pre-determine how the trend changes.
- Tendency to be identified incorrectly
Another limitation of the rising wedge pattern is that it has a tendency to be confused with other similar-looking patterns. The rising wedge pattern looks a little similar to the ascending triangle pattern, and traders often mistake one for the other, creating problematic situations in their trading strategies.
- Tendency to produce wrong signals
The rising wedge pattern has an accuracy rate of about 80%. The pattern, however, has a tendency to produce false signals 20% of the time. Investors and traders are thus advised to use the pattern along with other technical indicators to avoid incurring losses.
- Difficulty in trading with the pattern
Traders also often face difficulties in trading with the pattern, as it is very difficult to accurately predict the breakout point for the pattern. The price often breaks out before the predicted reversal, making it difficult for traders to plan entry and exit positions.
Two of the other disadvantages include the pattern’s limited predictive power and the need for a detailed market analysis while using the pattern for trading. Traders and investors must ideally understand the existing market context and the conditions in which the pattern appears before making any trading decisions. It is also advisable to use other technical indicators to cross-check the signals of the pattern.
Can a Rising Wedge Pattern be reliably used to predict future price movements?
Yes, the rising wedge pattern is considered to be one of the most accurate and reliable candlestick patterns. The rising wedge pattern can effectively predict upcoming bearish trend reversals, especially when used along with other technical indicators such as Bollinger Bands, Moving Averages, RSI, or Fibonacci Retracement indicators.
Can a Rising Wedge Pattern occur within a broader trend?
Yes, the rising wedge pattern can sometimes occur within a border trend. The occurrence of the rising wedge pattern within a broader trend is more common for intraday time frames. The rising wedge pattern within a broader trend indicates a pause in the uptrend while the market participants are considering which direction the price action will take. The bulls and bears both try to pull the prices higher and lower, respectively, with the bulls winning in the end and continuing the bullish trend. The rising wedge pattern, in such cases, is a trend continuation indicator.
Is a Rising Wedge Pattern bullish?
No, the rising wedge pattern is a bearish trend reversal indicator. The rising wedge pattern usually occurs towards the end of a bullish trend and signals a transition into a bearish trend.
What is the difference between a Rising Wedge Pattern and an Ascending Triangle Pattern?
The two main differences between the rising wedge pattern and the ascending triangle pattern are listed below.
| Rising Wedge Pattern | Ascending triangle pattern |
| It is a bearish trend reversal pattern. | It signals the start of a bullish trend. |
| It comprises two upward-sloping trendlines. | It comprises two trendlines, of which the upper one is a flat or horizontal line with no significant slope and the lower one is an upward-sloping one. |


 Previous Article


![15 Investing.com Alternatives [Free+Paid] You Should Use in 2026](https://www.strike.money/wp-content/uploads/2026/04/Investing.com-Alternatives.jpg "15 Investing.com Alternatives [Free+Paid] You Should Use in 2026 64")
![15 TradeStation Alternatives [Free+Paid] You Should Use in 2026](https://www.strike.money/wp-content/uploads/2026/04/TradeStation-Alternatives.jpg "15 TradeStation Alternatives [Free+Paid] You Should Use in 2026 65")
![15 Chartink Alternatives [Free+Paid] You Should Use in 2026](https://www.strike.money/wp-content/uploads/2026/04/Chartlink-Alternatives.jpg "15 Chartink Alternatives [Free+Paid] You Should Use in 2026 66")
: Overview, 10 Types of Indicators, Settings for Different Markets 67")


 : Definition, Formula, calculation, Uses, Advantages Vs limitations 70")


No Comments Yet.