The falling wedge pattern is a continuation pattern that forms when the price oscillates between two trendlines sloping downward and converging. A falling wedge pattern is regarded as a bullish chart formation, it can also signify continuation or reversal patterns depending on where it appears in the trend. There is significant confusion in identifying the descending wedge pattern because it isseen as both a bullish continuation and a bullish reversal pattern. Different market conditions exist in both cases, and these must be taken into account.
The factor that distinguishes the bullish continuation from the bullish reversal pattern is the direction of the trend when the falling wedge emerges. The pattern is considered a continuation pattern during an uptrend and a reversal pattern during a downtrend.
A descending wedge formation, which is bullish in technical analysis, indicates that the downward trend is losing momentum. It suggests that the current trend will either continue or reverse.
The falling wedge pattern denotes the end of the period of correction or consolidation. Buyers take advantage of price consolidation to create new buying chances, defeat the bears, and drive prices higher.
What is a Falling Wedge Pattern in Technical Analysis?
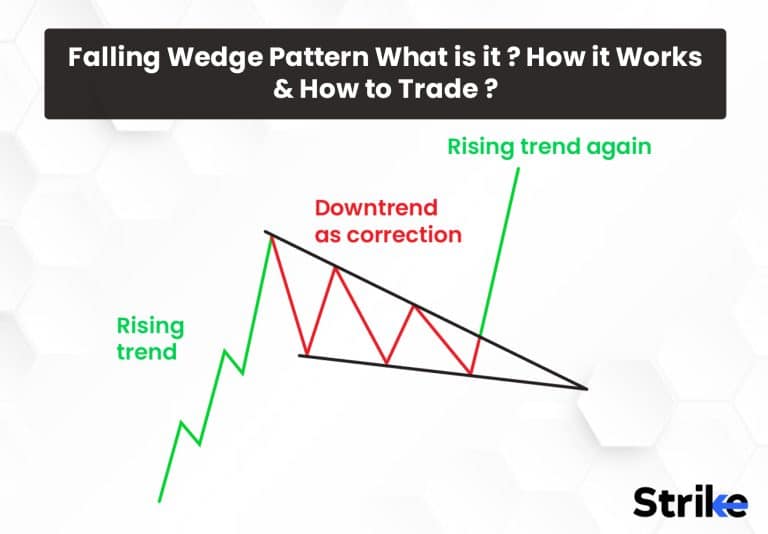
The Falling Wedge is a bullish pattern that widens at the top and narrows as prices start falling. The highs and lows of the price action converge to generate a cone that slopes downward. The falling wedge helps technicians spot a decrease in downside momentum and recognize the possibility of a trend reversal.
A falling wedge technical analysis chart pattern forms when the price of an asset has been declining over time, right before the trend’s last downward movement. The trend lines established above the highs and below the lows on the price chart pattern converge when the price fall loses strength and buyers enter to lower the rate of decline. The price breaks through the upper trend line before the lines merge.
The security is anticipated to trend upward when the price breaks through the upper trend line. Investors who spot bullish reversal signs should search for trades that profit from the security’s price increase.
What is the other term for a Falling Wedge Pattern?
The falling wedge pattern is popularly known as the descending wedge pattern. The pattern is known as the descending wedge pattern because it is formed by two descending trendlines, one representing the highs and one representing the lows.
What is the significance of a Falling Wedge Pattern in Technical Analysis?
A falling wedge pattern is a technical formation that signifies the conclusion of the consolidation phase, which allows for a pullback lower. Falling wedges are a continuation or reversal pattern. The falling wedge pattern is generally considered as a bullish pattern in both continuation and reversal situations.

The buyers will use the consolidation phase to reorganise and generate new buying interest to surpass the bears and drive the price action much higher.
A falling wedge pattern, therefore, is an essential indicator that signals that the asset’s price left the wedge to the upside, indicating that the correction or consolidation has just come to a conclusion. The continuation of the overall pattern is taking place in most cases.
How Does a Falling Wedge Pattern Work?
The falling wedge will ideally form following a long downturn and indicate the final low. The pattern qualifies as a reversal pattern only when a prior trend exists. The upper resistance line must be formed by at least two intermittent highs. The bottom support line must be formed by at least two intermittent lows. The falling wedge pattern’s subsequent highs and lows should both be lower than the preceding highs and lows, respectively. Shallower lows suggest that the bears are losing control of the market. The lower support line thus has a slope that is less steep than the upper resistance line due to the reduced sell-side momentum.
A descending wedge pattern requires consideration of the volume of trades. The breakdown won’t be properly confirmed without a rise in volumes.
How does a Falling Wedge Pattern form?
A falling wedge pattern forms when the price of an asset declines over time, right before the trend’s last downward movement. The trend lines established above the highs and below the lows on the price chart pattern merge when the price fall loses strength and buyers enter to reduce the rate of decline. The price breaks through the upper trend line before the lines merge.

The security is predicted to be trending upward when the price breaks through the upper trend line. Investors who spot bullish reversal signs should search for trades that profit from the security’s price increase.
How often does a Falling Wedge Pattern break out?
The falling wedge pattern often breaks out following a significant downturn and marks the final low. The pattern typically develops over a 3-6 month period and the downtrend that came before it should have lasted at least three months.
How to Identify Falling Wedge Patterns in Technical Analysis?
Technical analysts identify a falling wedge pattern by following five steps. The first step is to identify an uptrend or a downtrend. Secondly, link the lower highs and lower lows using a trendline. The third step is to search for divergence. The fourth step is to confirm the oversold signal and finally enter the trade.
- Identify an upward or downward trend. The pattern will act as a continuation pattern if it appears in an uptrend and as a reversal pattern if it appears in a downtrend.
- A trend line is used to connect lower highs and lower lows. The two lines will merge and slope downward.
- Watch out for divergence between price and an oscillator like a stochastic indicator or the Relative Strength Index (RSI).
- Oscillators and other technical instruments could confirm an oversold signal.
- Look for a break above resistance for a long entry.
Traders should look for a break above the resistance level for a long entry if they believe that a descending triangle will act as a reversal pattern. The pattern functions as a continuation pattern, indicating that the downtrend is likely to continue, if the price moves downward and breaks below the support level.
What are the Characteristics of a Falling Wedge Pattern?
The falling wedge pattern has three distinct characteristics. First is the trend of the market, followed by trendlines, and finally volume.
- The lower highs and lower lows of the price action indicate that it is currently in a downtrend. The market has reached its bottom if the wedge develops following an extended downturn. There should be a prior trend for the pattern to be qualified as a reversal pattern.
- Presence of two trendlines (upper and lower trendline). The upper and lower trend lines are convergent. There must be at least two consecutive highs to construct the upper resistance line. A lower support line must be established by at least two sporadic lows.
- The volume gradually decreases as the pattern moves forward. It is important to consider volume in falling wedge patterns because, without increased volume, the breakdown won’t be properly established.
The first two components of a falling wedge must exist, but the third component, which is a decrease in volume, is highly useful because it lends the pattern more credibility and authenticity.
What happens after the Falling Wedge Pattern?
The falling wedge pattern generally indicates the beginning of a potential uptrend. A rise in trading volume, which often takes place along with this breakthrough, suggests that buyers are entering the market and driving the price upward. Traders must consider a long position once the pattern is confirmed.
How to Use the Falling Wedge Pattern in Trading?
The falling wedge pattern are used in trading using six major steps. The first step is to identify the wedge pattern on a chart. Secondly, monitor the breakout. The third step is to confirm the breakout. The fourth step is to enter the trade. The fifth step is to set a stop-loss order and finally set a profit target.
- Find and identify the falling wedge pattern on a graph. Draw trend lines parallel to the swing highs and lows to emphasise the pattern.
- Look out for the breakout. This indicates that the price moves outside the drawn wedge pattern.
- Review the breakout. Check to see if the price has left the wedge. Verify that you have established the trendlines according to your preferences (they are commonly drawn along and connecting swing highs and lows).
- Enter the market. Open a buy position in case the price moves above the upper trendline of the falling wedge pattern.
- The traders should place a stop-loss order. Some traders choose to set their stop-loss order just outside the pattern’s breakout side. Others place the stop loss closer to maintain a lesser stop-loss magnitude. Risk management is a crucial feature of trading.
- Determine your profit target and choose how you’ll exit a profitable trade. An estimated profit objective is the height of the wedge at its thickest part, added to the breakout or entry point.
A trailing stop-loss is also used several times. The stop loss is trailed behind the price if the price action is favourable in order to help lock in profits. Always decide on the risk or reward ratio before proceeding. Consider the trade’s potential for profit after setting the entry, stop-loss, and target. The potential return should be twice as great as the possible risk ideally. It will be harder to make money across a large number of trades if the potential reward is smaller than the risk since losses will be greater than gains.
What is the best trading strategy for a Falling Wedge Pattern?
There are two best trading strategies for a falling wedge pattern. One is the falling wedge continuation pattern, and another is the falling wedge reversal pattern.
Descending wedge pattern develops as a continuation signal during an uptrend, suggesting that the price movement will continue to move upward. The pattern forms near the bottom of a downtrend as a reversal indicator, suggesting that an uptrend would follow.
Falling Wedge Continuation Pattern: The descending wedge pattern develops during an uptrend when the price has a tendency to consolidate or trade more sideways. The slight downward slant to the wedge pattern is seen by connecting the lower highs and lower lows before the price eventually recovers, resulting in a falling wedge breakout to resume the more significant uptrend.
The price clearly breaks out of the descending wedge on the Gold chart below to the upside before falling back down.

This is known as a “fakeout” and occurs frequently in the financial markets. The fakeout situation emphasises the significance of placing stops in the right place, providing a little extra time before the trade is potentially closed out. Investors set a stop below the wedge’s lowest traded price or even below the wedge itself.
Falling wedge reversal pattern: Traders utilise falling wedge technical analysis to identify market reversals. Such a situation is shown in the USD/CHF chart below, where the market is continuing to decline by setting new lows. The price action then begins to move sideways in a more consolidation-like pattern before making a sudden upward turn.

Traders connect the lower highs and lower lows using trendline analysis to make the pattern simpler to observe. The entry into the market would be indicated by a break and closure above the resistance trendline. The objective is set using the measuring technique at a previous level of resistance or below the most recent swing low while maintaining a favourable risk-to-reward ratio.
Measuring technique: Traders evaluate the vertical gap between support and resistance by looking at the falling wedge pattern’s starting point. Superimpose that same distance in front of the present price just after a breakout. The target will be at the top of the line.
What is the price target for a Falling Wedge pattern?
The price targets are set at levels that are equal to the height of the wedge’s back. The logical price goal should be 10% above or below the breakout if the distance from the wedge’s initial apex is 10%. It is obtained by multiplying the breakout point by the pattern’s initial height. This gives traders a clear idea of the potential direction of price movement after a successful breakout. Traders should place their stop-loss orders inside the wedge once the falling wedge breakout is verified.
What Type of Indicator is Best to Use with a Falling Wedge Pattern?
The best indicator type for a falling wedge pattern is the divergence on price-momentum oscillators such as the Stochastic Oscillator or the Relative Strength Index (RSI).
Divergence happens when the oscillator is going in one direction while the price is moving in another. This frequently happens with wedges since the price is still rising or decreasing, although in smaller and smaller price waves. The oscillators track price momentum. They begin to move in the opposite direction to represent this.

The descending wedge in the USD/CAD price chart below has a stochastic applied to it. The stochastic oscillator displays rising lows over the later half of the wedge formation even as the price declines and fails to make new lows. This shows that price momentum on the downside is declining. The stochastic divergence and price breakout from the wedge to the upside helped predict the subsequent price increase.
How accurate is the Falling Wedge Pattern?
A falling wedge pattern has an accuracy of 74%. The pattern can break out upward or downward, but because it rises 68% of the time, it is often regarded as bullish. Traders should be careful when they see the falling wedge form. The trading range narrows as the price action falls more, signalling that the stock is under pressure from sellers to decline. There is a 68% likelihood of an upward breakout once the buyers gain control.
Is the Falling Wedge Pattern reliable?
Yes, the falling wedge is considered a reliably profitable chart pattern in technical analysis. It has a high probability of predicting bullish breakouts and upside price moves. The pattern has clearly defined support/resistance lines and breakout rules which provides an edge in trading. When confirmed with rising volume on the breakout, falling wedges can signal high-probability upside moves making them a reliable bullish pattern.
Is the Falling Wedge Pattern Profitable?
Yes, falling wedge patterns are considered highly profitable to trade due to the strong bullish probabilities and upside breakouts. Traders have the advantage of buying into strength as momentum increases coming out of the wedge. Profit targets based on the pattern’s parameters also provide reasonable upside objectives.
What is an example of a Falling Wedge Pattern in trading?
The falling wedge pattern acts as a reversal pattern in this example. The price saw lower highs and lower lows following a decline. The descending wedge pattern acts as a reversal pattern in a downtrend.

Keep in mind that the trend line connecting the highs is decreasing, but the trend line connecting the lows is rising. The pair made a strong move upward that is roughly equivalent to the height of the formation after breaking above the top of the wedge. The price rally in this instance went a few more points beyond the target.
What are the Benefits of a Falling Wedge Pattern in Technical Analysis?
The five major benefits of a falling wedge pattern in technical analysis are frequent appearance, clear stop, entry, and limit levels, favourable risk-reward ratios, the ability to enter even after missing an initial move, increased accuracy and, price target.
- The falling wedge pattern occurs very often in financial markets, such as stock markets, commodities, forex and cryptocurrencies.
- The pattern provides clear stop, entry, and limit levels. The trading strategy enables traders to place stop-loss orders at predetermined levels to reduce possible losses. Normally, traders would set their stop-loss orders below the falling wedge pattern’s support line.
- It provides a favourable risk-reward ratio. A favourable risk-reward ratio indicates that the possible reward of a trade exceeds the possible risk.
- Traders enter a trending market using the falling wedge pattern, after missing the initial advance (continuation case).
- Traders set a price target for their long positions using a falling wedge pattern. The price target is often determined by an upward expansion from the breakout point to the height of the pattern at its widest point.
The falling wedge pattern is known for providing a favourable risk-reward ratio, which is an important factor for traders looking to make profitable trades. It also helps traders manage their risks and maximise their profit potential by offering clear stop, entry and limit levels.
What are the Limitations of a Falling Wedge Pattern in Technical Analysis?
The five major drawbacks of a falling wedge pattern in technical analysis are that it is ambiguous, requires additional confirmation, sends false signals, is often interpreted incorrectly, and placing incorrect stop-loss.
- The pattern is ambiguous for new traders. Traders must decide whether the convergent trendlines truly depict a falling wedge or if they are only a component of a larger consolidation period.
- The descending wedge pattern needs further verification using oscillators and other technical indicators.
- It often provides false signals. False signals occur when a pattern predicts a certain outcome, such as a bullish reversal, but the market behaves differently than expected.
- The falling wedge represents a continuation or reversal pattern (accurate identification is important).
- Incorrect stop-loss positioning could result in losses for a trader if the wedge reverses and breaks out. The flashback rate for this pattern is 62%, which indicates that it will fail after the breakout.
The descending wedge pattern frequently provides false signals and represent a continuation or reversal pattern. It is, therefore, essential to identify the pattern accurately. Experienced traders find the falling wedge pattern to be a useful tool, but new traders should use caution when it.
Is a Descending Wedge Pattern bullish?
Yes, a descending wedge pattern is bullish. It functions as a bearish pattern in a market when prices are falling. It is bullish when it forms during an uptrend in a bull market.
Can a Falling Wedge Pattern break down?
Yes, a falling wedge pattern can break down. A falling wedge pattern breaks down when the price of an asset falls below the wedge’s lower trendline, potentially signalling a change in the trend’s direction.
What is the difference between a Falling Wedge Pattern and Descending Triangle Pattern?
Falling wedges and descending triangles have a similar appearance, which is confusing for traders trying to identify the correct pattern. The descending triangle and falling wedge both have significance for the price, which helps investors comprehend what is going on in the market and what happen next. There are 2 key differences to understand and distinguish the pattern more clearly.
| Falling Wedge Pattern | Descending Triangle Pattern |
| A falling wedge pattern signals a bullish reversal and appears in a downtrend.The price of a falling wedge pattern breaks out in either direction before the two trend lines converge. | A descending triangle pattern occurs after a bearish trend with a potential breakdown continuation.A descending triangle appears when the price is trapped between the top and bottom trend lines and converges in a single place. |


 Previous Article


![15 Investing.com Alternatives [Free+Paid] You Should Use in 2026](https://www.strike.money/wp-content/uploads/2026/04/Investing.com-Alternatives.jpg "15 Investing.com Alternatives [Free+Paid] You Should Use in 2026 76")
![15 TradeStation Alternatives [Free+Paid] You Should Use in 2026](https://www.strike.money/wp-content/uploads/2026/04/TradeStation-Alternatives.jpg "15 TradeStation Alternatives [Free+Paid] You Should Use in 2026 77")
![15 Chartink Alternatives [Free+Paid] You Should Use in 2026](https://www.strike.money/wp-content/uploads/2026/04/Chartlink-Alternatives.jpg "15 Chartink Alternatives [Free+Paid] You Should Use in 2026 78")
: Overview, 10 Types of Indicators, Settings for Different Markets 79")


 : Definition, Formula, calculation, Uses, Advantages Vs limitations 82")


: How We Used This 70/30 Indicator in 6 High Win-rate Strategies 85")


No Comments Yet.