A wedge pattern is a price pattern identified by converging trend lines on a price chart. The wedge pattern is frequently seen in traded assets like stocks, bonds, futures, etc. The characteristic feature of the pattern is the narrowing price range between two trend lines that are converging towards each other, creating a wedge shape.
A contracting price range paired with either an upward price trend (known as a rising wedge) or a downward price trend (known as a falling wedge) defines the pattern.
The wedge pattern has three common elements observed in each scenario: firstly, the trendlines that are converging towards each other; secondly, the volume tends to decline as the price progresses through the pattern; and finally, there is a breakout from one of the trend lines. A rising or falling slant heading in the same direction defines this pattern.
Traders wait for a breakout to occur above or below the wedge, to enter the trade. They place stop-losses on the opposite side of the wedge. The height of the wedge pattern often plays an important role in placing the targets.
The benefits of using a wedge pattern in technical analysis include its ability to give traders a clear visual indication of a likely trend reversal, enabling them to initiate or exit positions at a suitable period.
What does a Wedge Pattern in Technical Analysis indicate?
A wedge pattern is a popular trading chart pattern that indicates possible price direction changes or continuations. The breakout direction from the wedge determines whether the price resumes the previous trend or moves in the same direction. Wedges are an easy-to-understand chart pattern, and when they diverge from a prior pattern, there are favorable risk/reward trading potentials.
Wedges, which are either continuation or reversal technical analysis chart patterns, indicate a pause in the current trend and signify that traders are still deciding where to take the pair next.
How does a Wedge Pattern in Technical Analysis work?
Technical analysts apply wedge patterns to depict trends in the market. The pattern represents a short and medium-term reversal in the market’s price movement. Price patterns represent key price movements and trends by creating an arrow shape using the wedge on a price chart.
Analysts identify the wedge pattern by looking at wedge characteristics which include being surrounded by two trend lines that are all pointing in the same direction; the price has to reach a trend line at least five times (three times on one and twice on the other) before a breakout; they frequently follow a panic (declining wedge) or bubble (rising wedge), and both exhibit below-average performance and frequent retracements.

Wedge patterns comprise support and resistance trend lines that move in the same direction as the channel narrows until one of the trend lines is broken and the current trend is reversed on a large scale.
Analysts use a wedge charting technique to show significant price fluctuations in the market. Technical analysts converge price trends as an arrow, using the wedge, just like a standard wedge. A bullish market is one in which a wedge moves higher; a bearish market is one in which the wedge moves downward.
What is the importance of Wedge Patterns in Technical Analysis?
Wedge patterns are important in technical analysis because they can give traders a clear picture of future trend reversals or continuations. Traders can choose the best time to buy or sell an asset by seeing these patterns. Wedge patterns should be used in conjunction with other technical indicators such as Moving average convergence/divergence (MACD) and volume to verify the momentum of the breakout.
Traders look at trading volume levels to verify a possible price reversal signalled by a wedge pattern. A price reversal is more likely when a rising wedge formation forms and trading volume decreases; this indicates that the market is losing momentum, leading to a price reversal.
Traders apply oscillators like the Relative Strength Index (RSI) to get evidence of a potential price reversal signalled by a wedge pattern. For instance, a rising wedge formation and overbought circumstances on the RSI indicate that a price reversal is more likely to occur. Similarly, a falling wedge formation and RSI that shows oversold conditions, signal towards an upcoming trend reversal.
What are the key features of a Wedge Pattern in Technical Analysis?
The 6 key features of a wedge pattern include converging trendlines, steepness of the trendlines, duration the wedge pattern takes to form, volume, breakout and target prices.
- Converging trend lines. A wedge pattern is created when 2 trend lines converge to form a triangle or wedge shape. These trend lines link the asset’s price’s higher highs and lower lows throughout time.
- The steepness of trendlines. A key aspect of wedge patterns is the slope of the trend lines. The slope of the lower trend line is steeper than the slope of the higher trend line in a rising wedge pattern. The slope of the upper trend line is steeper than the slope of the lower trend line in a falling wedge pattern.
- Duration. Wedge patterns can take a wide range of time to form, fluctuating from a few weeks to several months. These patterns appear only in the middle of a trend. So, be sure that there is a distinct trend in play before you begin looking for wedges to trade.
- Volume. Ensure the volume is decreasing after you have identified the wedge pattern. There is a significant possibility the pattern is invalid if the volume is not decreasing.
- Breakout. Watch for a definite breakout prior to getting involved in wedge patterns. Jumping in too soon results in losses because it could imply purchasing or selling before the trend has truly started.
- Target price. You must take a profit when the price approaches the trendline that signifies the end of the wedge pattern after you enter a trade. This is an excellent opportunity to lock in some profits before the price reaches the pattern’s top or bottom because it typically occurs before those points.
Trading using the wedge pattern requires careful consideration of where to set the
stop-loss orders. Put your stop below the lows of the pattern if you’re trading a breakout. You should set your stop above the pattern’s highs if you are reversal trading.
How to Identify a Wedge Pattern in a Chart?
There are four factors that one must consider to identify a wedge pattern in a chart. First is that the market should be in a trend. Secondly, two reversals are necessary. The third factor is that the reversals should be getting narrower and lastly, the volume must be declining.
- The market must be in a trend. You must first determine whether the market is trending because wedge formations only appear in the middle of trends. You might check for a definite direction by looking at the longer-term charts.
- Two reversals are necessary. There must be two reversals for a wedge pattern to be reliable. These reversals are typically denoted as peaks and troughs on the price chart.
- The reversals should be narrowing. The reversals should appear to be converging when they are plotted on a price chart. This narrowing creates a wedge shape.
- The volume must be declining. There must be a decline in volume as the pattern starts developing as the trend starts to reverse because fewer and fewer traders are participating in the market.
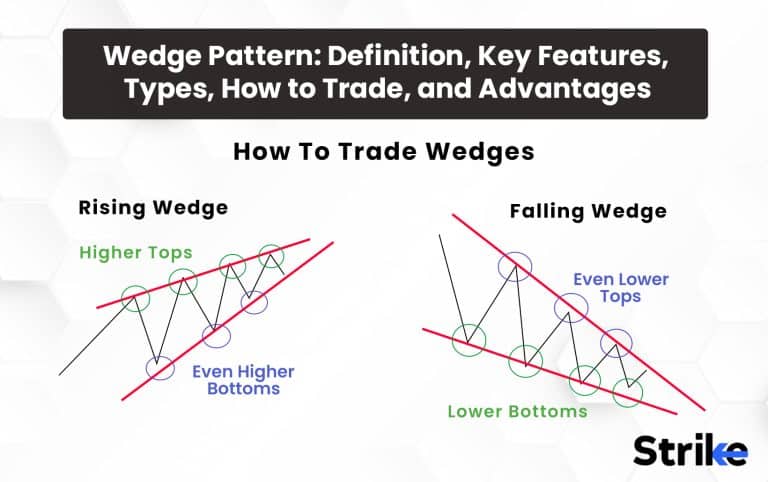
Two ascending trend lines that gradually converge as the market moves higher define rising wedges, which happen when the market is heading upwards. Falling wedges occur when the market is trending downward. They are characterized by two declining trend lines that slowly converge as the market trends downward.
How often does a Wedge Pattern in Technical Analysis occur?
Wedge pattern in technical analysis occurs in all the time frames. Traders mostly use them in shorter-term time frames, you can spot them on daily and weekly charts as well.
The falling wedge generally develops after a 3-6 months period and the preceding downtrend must be 3 months or more. The rising wedge indicates an intermediate or long-term trend reversal and typically develops over 3-6 months.
How Accurate is the Wedge Pattern?
Wedge patterns have a high degree of accuracy when it comes to trading. The falling wedge pattern has a 74% success rate in bull markets, with an average potential profit of +38%, according to published research. The descending wedge is a fairly dependable pattern that, when applied properly, can enhance your trading performance. The rising wedge pattern has a strong 81% success rate in bull markets, with an average potential profit of +38%, according to multi-year testing.
What are the Types of Wedge Patterns in Technical Analysis?
There are two types of wedges, A rising wedge and a falling wedge. The rising wedge has a bearish effect. The falling wedge has a bullish effect.
1. Falling Wedge Pattern
The falling wedge is regarded as a reversal pattern in a downtrend. This pattern is created when the price makes lower highs and lower lows, which results in the formation of two contracting lines. There are possible buying opportunities since the falling wedge comes before an upside reversal.

A falling wedge is a continuation pattern that develops when the market temporarily contracts in an uptrend. It signals the resumption of the upward trend, creating potential purchasing opportunities.
2. Rising Wedge Pattern
A rising wedge chart pattern occurs when there is an uptrend or when the prices rise. The rising wedge pattern’s trend lines continue to keep the price confined within them. This particular wedge pattern is bearish and suggests that the price is set to fall and trend downward. Higher highs and higher lows are seen in the rising wedge chart pattern.

This bearish pattern suggests that the price of security will probably decline. The rising wedge pattern denotes potential selling chances.
How to Trade a Wedge Pattern?
Wedge trading is done in one of two ways, breakout trading and reversal trading.
- Breakout trading requires taking a place at the point where the price breaks out of the wedge. This point is at the top or bottom of the pattern depending on which way the market is moving. Breakout trading is based on the concept that after the market breaks the pattern will continue in the same direction.
- Reversal trading, in contrast, involves entering a position when the price reverses at the end of the wedge pattern. This typically occurs following a period of consolidation, and it is sometimes an excellent opportunity to jump on a trend early.
Reversal trading means taking a position when the price reverses near the end of a wedge pattern, while breakout trading requires taking a position when the price breaks out of a wedge pattern.
What trading strategy works best with a Wedge Pattern?
The 4 trading strategies that work best with wedge patterns are breakout trading strategy, retracement trading strategy, continuation trading strategy and momentum trading strategy.
- Breakout trading strategy. The Wedge Pattern’s breakout point is used by traders as a signal to place a trade. Traders enter into a short position when the price breaks below the lower trendline in a rising wedge formation; similarly, traders enter into a long position when the price breaks above the higher trendline in a falling wedge pattern.
- Retracement trading strategy. The retracement following the breakout is used by traders to place a trade. The price retraced back to the lower trendline giving traders the chance to enter a short position at a better price.
- Continuation trading strategy. The Wedge Pattern is often used by traders as a signal for a likely continuation of the current trend. Traders use the breakout point to engage in a long position and carry on trading in the uptrend if a wedge Pattern emerges during an uptrend.
- Momentum trading strategy. Buying or selling assets based on their most recent price movements with the hope that the trend will continue in the same direction is known as momentum trading. Momentum traders search for possibilities to enter a trade when the asset’s price breaks out of patterns when it comes to trading wedge patterns.
The success of any trading strategy including a wedge pattern depends on the trader’s proficiency with technical analysis, experience, risk management skills, and ability to make wise trading decisions.
Can you trade Wedge Pattern with MACD?
Yes, the Moving Average Convergence Divergence is used to trade wedge patterns. You should keep an eye out for a bearish wedge pattern to develop below the MACD line provided the market is in a downtrend.
Watch for the formation of a bullish wedge pattern above the MACD line when the market is in an uptrend. This combination is a useful tool for verifying the pattern’s validity and the likelihood that the market will go forward in a similar direction.
Can you trade Wedge Pattern with Bollinger Bands?
Yes, Bollinger Bands can be very effective for trading wedge chart patterns. During the wedge, Bollinger Bands will taper inwards reflecting the consolidating price action. The breakout will be signaled when the price closes outside the upper or lower Bollinger Bands. Traders can then enter trades in the direction of the breakout with the bands used as dynamic support/resistance levels.
How effective is a Wedge Pattern in Trading?
Wedge patterns are considered highly effective trading chart patterns. Statistics show they can have a high probability of predicting the resumption of a prior trend after a consolidation period. Wedges are most reliable when confirmed with other indicators like volume and momentum. The clear-cut formations with converging trendlines also provide defined trade entry points, stop losses, and profit targets. Risk can be controlled and the pattern has clear invalidation/failure rules.
What is an example of a Wedge Pattern in Trading?
Here in the example, we have a falling wedge in an downtrend. The volume decreases as the wedge pattern is forming and then increases when it breaks out as you see in the chart below.

The volume decreases during the wedge and then grows as the market exits the pattern. The wedge pattern successfully manages to reverse the downtrend.
What are the advantages of a Wedge Pattern in Technical Analysis?
Trading with wedge patterns is highly beneficial in technical analysis. There are five major advantages of wedge patterns.
- Helps traders depict the price movement. Analysts use a wedge in technical analysis to represent price changes and important market trends.
- Easy to identify. Wedge patterns are accessible to new traders since they are reasonably easy to spot on a price chart. They are produced by two trend lines that converge towards the same direction, making it easier to identify potential trend reversal.
- Clear entry and exit points. Wedge patterns enable traders with clear entry and exit points.
- Used with other technical indicators. Wedge patterns are utilized with other technical indicators like oscillators or moving averages to support a probable trend reversal.
- Stop loss placements close to the entry-level. One of the advantages that this pattern has over other patterns is that your top loss placement will frequently be extremely close to your entry level, boosting your returns when the price achieves your target.
The wedge pattern is a helpful technical analysis technique that can offer traders insightful information about prospective trend reversals as well as clear entry and exit positions.
What are the disadvantages of a Wedge Pattern in Technical Analysis?
The 4 major disadvantages of wedge patterns in technical analysis include false breakouts, ambiguous direction, limited time frame, and lack of volume confirmation.
- False breakout. False breakouts, occasionally occur with wedge patterns where prices momentarily move above the wedge boundary before immediately changing course. Losses result for traders who place trades based on the breakout signal.
- Ambiguous direction. Wedge patterns are difficult to analyze because they can signal both bullish and bearish results.
- Limited time frame. Wedge patterns are frequently short-term price formations, thus traders seeking for longer-term trends or indications not find them beneficial.
- Lack of volume confirmation. Wedge patterns are good predictors of potential price movements, but the signal is not necessarily confirmed by an increase in trading volume.
Conclusively, traders should look out for false trading signals while using wedge patterns. False breakouts result in losses, and it is difficult to evaluate the market’s trend because of the pattern’s ambiguous direction.
Is a Wedge Pattern profitable?
Yes, wedge patterns can offer both large profits and precise entries to the trader who uses patience to his advantage. The profitability of a wedge pattern in technical analysis is influenced by some variables such as the market conditions, the time frame, and the trading approach.
Can a Wedge Pattern form in both bullish and bearish markets?
Yes, a wedge pattern can form in both bullish and bearish markets. A falling wedge is a bearish pattern and a rising wedge is a bullish pattern.
Can Wedge Patterns be used to predict the exact price movements of a stock?
No, wedge patterns cannot be used to predict the exact price movements of a stock. Technical analysis wedge patterns are not intended to forecast the precise price movements of a stock; instead, they give a picture of how the market is moving and can be used to spot possible price breakouts or reversals.
What is the difference between a Wedge Pattern and a Triangle Pattern?
| WEDGE PATTERN | TRIANGLE PATTERN |
| A wedge pattern is a price pattern that develops when two trendlines are converging towards each other. There are two typesof wedge pattern; rising wedge and falling wedge patterns. A wedge pattern shows a potential trend reversal or continuation. The price of a wedge breaks out in either direction before the two trend lines converge in this pattern. The volume decreases as the pattern develops in a wedge pattern. | A triangle is a chart pattern that denotes a pause in the current trend and is represented by trendlines along a converging price range. There are three types of triangle pattern; ascending triangle, descending triangle and symmetrical triangle patterns. A triangle pattern shows a potential trend reversal. The price is constrained between the top and bottom trend lines at one time in this pattern. Volume decreases as the pattern develops and increases on the breakout. |


 Previous Article


![15 Investing.com Alternatives [Free+Paid] You Should Use in 2026](https://www.strike.money/wp-content/uploads/2026/04/Investing.com-Alternatives.jpg "15 Investing.com Alternatives [Free+Paid] You Should Use in 2026 52")
![15 TradeStation Alternatives [Free+Paid] You Should Use in 2026](https://www.strike.money/wp-content/uploads/2026/04/TradeStation-Alternatives.jpg "15 TradeStation Alternatives [Free+Paid] You Should Use in 2026 53")
![15 Chartink Alternatives [Free+Paid] You Should Use in 2026](https://www.strike.money/wp-content/uploads/2026/04/Chartlink-Alternatives.jpg "15 Chartink Alternatives [Free+Paid] You Should Use in 2026 54")
: Overview, 10 Types of Indicators, Settings for Different Markets 55")


 : Definition, Formula, calculation, Uses, Advantages Vs limitations 58")


No Comments Yet.