The ascending triangle pattern is one of the widely followed chart patterns in technical analysis, especially in trending continuation setups in the market. The ascending triangle pattern highlights a phase of consolidation where the market prepares for a potential directional move.
Traders often look for breakouts from this pattern to manage their risks and align their strategies with the market’s strength before things really take off. It also clearly indicates when buyers are active and how much supply is being absorbed, helping traders predict when momentum might increase.
What is the Ascending Triangle Pattern?
An ascending triangle is a bullish continuation chart pattern in technical analysis that indicates a pause before a potential upward breakout. This pattern typically forms during an uptrend, showing the gaining strength of buyers against steady resistance.
What does an Ascending Triangle Pattern Indicate?
An ascending triangle pattern indicates a bullish accumulation, where traders gradually build buying positions at higher price levels while sellers continue to defend a fixed resistance, eventually leading to a potential upward breakout.
As the range tightens, supply gets absorbed by steady demand, signaling an approaching breakout. Once resistance is overcome, price typically moves upward, indicating continuation of the prior uptrend.
Structure and Psychology of an Ascending Triangle
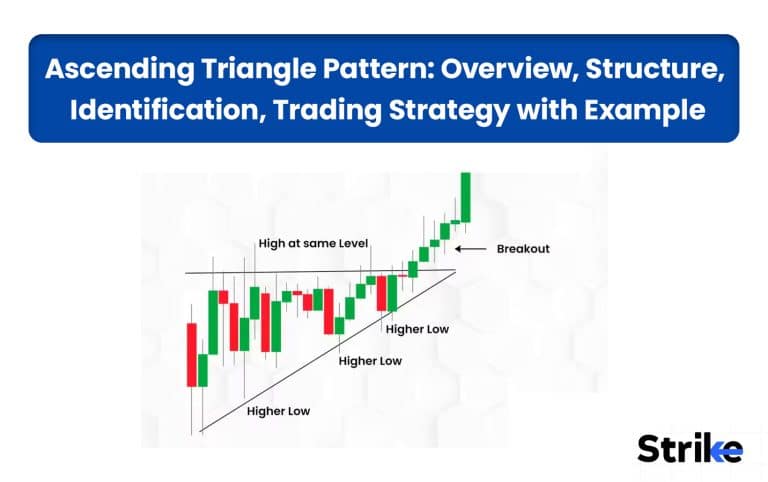
The structure of the ascending triangle pattern consists of 3 main components. These components are horizontal resistance, a rising support trendline, and a breakout point.

- Horizontal Resistance: A price level where the market faces resistance multiple times but fails to break initially. It represents a supply zone where sellers are active, but importantly, they are not pushing prices lower each time.
- Rising Support: The market forms consistently higher lows, creating an upward-sloping trendline. This indicates increasing demand, where buyers are entering at higher prices, showing growing strength.
- Breakout Point: The most critical component where the price breaks above the resistance to validate the ascending triangle pattern. This signals that buyers have finally absorbed the available supply and taken control.
This pattern reflects sellers’ attempts to maintain the price at a given level; however, they become weak since they are unable to push the price down any more. Meanwhile, buyers become more aggressive and confident, pushing higher prices every time. This puts pressure on the market. The sellers are finally overwhelmed by the buyers, and the breakout is strong.
Is Ascending Triangle Bullish or Bearish?
The ascending triangle pattern is primarily considered bullish, signaling a pause before the continuation of an uptrend. This pattern usually forms during an uptrend with a flat resistance line at the top with equal highs and a rising support line of higher lows, showing buyers gaining strength against fixed seller defense. This increasing buying pressure usually leads to a breakout above resistance, signaling a potential upward move.
When Does the Ascending Triangle Pattern Form?
There are three major scenarios where an ascending triangle pattern forms. The scenarios are an existing uptrend, during accumulation, and before a breakout.
- After an existing uptrend: This is the most common scenario after price has already moved upward. After a bullish move, prices often take a pause or consolidate, where buyers keep adding at higher lows while sellers defend the fixed resistance level.
- During Accumulation Phase: When smart money accumulates positions gradually, each dip gets bought faster, forming higher lows. Resistance stays constant because supply is still present.
- Before a Breakout: The pattern forms before price breaks resistance. Near resistance, buyers become more aggressive, absorbing the selling pressure, eventually breaking the resistance.
These scenarios show that the ascending triangle forms when buying pressure is gradually increasing, and understanding this helps traders anticipate potential breakouts with better confidence and timing.
How to Identify an Ascending Triangle Pattern
There are five major steps to identify an ascending triangle pattern. The steps are briefly discussed below.
- Look for a flat resistance level: Identify a flat resistance level where price has hit a similar high multiple times (more than 2 times), creating a horizontal ceiling. This level is constantly defended by sellers.

- Spot Higher Lows: Identify the higher lows where each dip is higher than the previous one. Draw a trendline connecting these higher lows (rising support trendline), which indicates increasing demand from buyers.

- Converging Shape: The flat resistance top and rising support trendline form a shape of a triangle squeezing price. During ascending triangle formation, the price range gets tighter and volatility contracts.
- Volume Behavior: During the formation of an ascending triangle formation, volume usually declines, indicating consolidation and absorption.

- Breakout Confirmation: Price should close above a resistance level with a strong volume to confirm the breakout and ascending triangle.
By following these steps, traders can accurately identify ascending triangle patterns and improve their chances of capturing strong breakout moves with proper confirmation.
How to Trade the Ascending Triangle Pattern [With Example]
In the stock market, the ascending triangle pattern can be traded either on an immediate breakout for momentum-based entries or after a pullback for better risk-reward and confirmation. This pattern is a popular tool among technical analysts for identifying potential upward trends within the stock market.
Breakout Trading Strategy using Ascending Triangle
In this Breakout Trading strategy, traders enter the trade immediately after price breaks and close above the horizontal resistance level, expecting price to continue its bullish trend after consolidation. There are three simple steps to trade using this Breakout Trading approach for ascending triangles, which are briefly discussed below.

- Entry Rules: Identify the ascending triangle pattern and wait for a strong candle close above resistance. Confirm the breakout using volume to avoid a false breakout.
- Stop loss: Put your stop loss below the recent swing higher low or below the rising support trendline.
- Target: Measure the height of the triangle and project it upward from the breakout point to set the target or use a 1:2 RR.
Pullback Entry Strategy using Ascending Triangle
In this strategy traders enter the trade after the retest of the breakout instead of entering immediately. This strategy increases confirmation of pattern breakout and has a tight stop loss.
There are three simple steps to trade using the ascending triangle breakout strategy, which often incorporates Pullback Trading for risk-averse entries, as briefly discussed below. Following these steps ensures that your Pullback Trading approach is both systematic and effective.

- Entry Rules: Identify the ascending triangle pattern and breakout of the ascending triangle pattern with a strong candle close above resistance. Wait for the price to retest the resistance level after the breakout and enter on a bullish candle or a candle with a rejected wick.
- Stop loss: Put your stop loss below the retest low.
- Target: Measure the height of the triangle and project it upward from the breakout point to set the target or use a 1:2 RR.
How to Calculate Price Target when Trading an Ascending Triangle
The price target in an ascending triangle is calculated using a measured-move approach. Measure the height of the triangle by measuring the distance between the horizontal resistance level and the lowest point of the rising trendline.

Project the same height upward from the breakout point to estimate the potential Profit Target. Traders often align this Profit Target with a minimum 1:2 risk-reward ratio, ensuring that the potential profit is at least twice the risk taken based on the stop-loss placement.
Where to Set a Stop-Loss When Trading an Ascending Triangle?
When trading the ascending triangle pattern, set your stop-loss to the most recent swing low of the triangle pattern or just below the ascending support trendline. For a more conservative Stop Loss, wait for the price to retest after the breakout and then place the Stop Loss just below the retest low. This reduces the probability of a false breakout.
How Accurate is an Ascending Triangle Pattern?
The ascending triangle pattern is considered moderately to highly accurate, but its reliability varies based on market conditions and confirmation.
According to research by the Encyclopedia of Chart Patterns, 63–64% of the time these Triangle Patterns show upward breakouts. In broader statistical studies by John Rowland (CMT), the overall success rate for such Triangle Patterns ranges between 65% and 75% with a failure rate of only 11% to 13%.
How Does Volume Affect Ascending Triangle Patterns?
Volume plays a critical role in confirming the valid ascending triangle pattern. During the formation of an ascending triangle pattern, volume declines gradually due to a temporary balance between buyers and sellers. However, despite the decreased volume, the price continues to make higher lows, indicating gradual accumulation of buyers.
A sharp increase in volume, ideally 1.5 – 2x or more above average, confirms the ascending triangle breakout, indicating demand has finally overpowered the supply. If the breakout happens on weak or low volume, it often leads to a false move, where the price quickly falls back into the pattern.
Which Indicators Work Best with the Ascending Triangle Pattern?
The indicators work best with the ascending triangle pattern to confirm the pattern includes volume, RSI, MACD, and moving averages.
- Volume: Volume helps to confirm whether the breakout is valid. During the ascending triangle formation, volume should be low to declining. Volume should rise sharply (more than 1.5X average) after the upside breakout, confirming the pattern.

- RSI (Relative Strength Index): Helps confirm the momentum. RSI above 50 or rising from oversold levels (near 30-40) during the higher low formation signals building bullish momentum before a breakout.

- MACD (Moving Averages Convergence Divergence): Helps confirm the momentum shift. Look for a bullish crossover near a breakout or an increasing histogram.

- Moving Averages: Help identify trend direction, as moving averages often act as dynamic support and resistance. Ascending triangle pattern forming above the moving averages increases the reliability of the pattern.

Using these indicators together helps traders confirm both trend strength and breakout validity, increasing the probability of a successful trade and reducing false signals.
Advantages vs Limitations of Ascending Triangle
The advantages vs. limitations of the ascending triangle pattern is mentioned below in the table.
| Advantages | Limitations |
| Easy to identify due to clear structure | Prone to false breakouts |
| Strong bullish bias in uptrends | Needs confirmation (volume, breakout close) |
| Defined entry, stop loss, and target levels | Less reliable in sideways markets |
| Works well for breakout trading | Can take time to form |
| Can be combined with indicators for accuracy | Breakouts may already be partially priced in |
In the field of Technical Analysis, the ascending triangle works best with proper confirmation and risk management to avoid false signals, making it a highly effective tool for traders using Technical Analysis.
Ascending Triangle vs Descending Triangle vs Symmetrical Triangle
All these types of triangle patterns represent market consolidation where price moves in a tightening range before a breakout. However, they differ in structure, market pressure, and breakout direction.

- Ascending Triangle: This pattern has a flat resistance with a rising support trendline (higher lows), indicating rising buying pressure. This pattern usually gives a bullish breakout.
- Descending Triangle: This pattern has flat support with a falling resistance trendline (lower highs), indicating rising buying pressure. This pattern usually gives a bearish breakout.
- Symmetrical Triangle: This pattern has a rising support trendline (higher lows) and a falling resistance trendline (lower highs) forming a symmetrical triangle pattern with converging trendlines. This pattern shows balance between both buyers and sellers, where a breakout can happen in either direction.
All are consolidation patterns, but ascending favors buyers, descending favors sellers, and symmetrical reflects a balance until a breakout decides the direction.
What are the Other Useful Chart Patterns?
Several other useful chart patterns help traders identify trend continuation, reversals, and breakout opportunities beyond triangles. Some of the most commonly used patterns are mentioned below.
| Pattern | Type | Indication |
| Head and Shoulders | Reversal | Bearish reversal after uptrend |
| Inverse Head and Shoulders | Reversal | Bullish reversal after downtrend |
| Double Top | Reversal | Resistance-based bearish reversal |
| Double Bottom | Reversal | Support-based bullish reversal |
| Cup and Handle | Continuation | Bullish continuation after consolidation |
| Flag | Continuation | Short-term continuation after strong move |
| Pennant | Continuation | Breakout after brief consolidation |
| Rectangle | Consolidation | Sideways range before breakout |
Each of these Chart Patterns reflects a different phase of market behavior, and combining such Chart Patterns with volume and trend analysis helps traders make more confident decisions.


 Previous Article


![15 Investing.com Alternatives [Free+Paid] You Should Use in 2026](https://www.strike.money/wp-content/uploads/2026/04/Investing.com-Alternatives.jpg "15 Investing.com Alternatives [Free+Paid] You Should Use in 2026 52")
![15 TradeStation Alternatives [Free+Paid] You Should Use in 2026](https://www.strike.money/wp-content/uploads/2026/04/TradeStation-Alternatives.jpg "15 TradeStation Alternatives [Free+Paid] You Should Use in 2026 53")
![15 Chartink Alternatives [Free+Paid] You Should Use in 2026](https://www.strike.money/wp-content/uploads/2026/04/Chartlink-Alternatives.jpg "15 Chartink Alternatives [Free+Paid] You Should Use in 2026 54")
: Overview, 10 Types of Indicators, Settings for Different Markets 55")


 : Definition, Formula, calculation, Uses, Advantages Vs limitations 58")


No Comments Yet.