A bullish harami candlestick is a price chart pattern that signals trend reversals in an ongoing bear market. A bullish harami candlestick pattern is a two-candlestick pattern with a long bearish candlestick and a small bullish candlestick, whose entire body lies within the body of the prior bearish candlestick. Investors and traders see the small-bodied bullish candlestick of the bullish harami as a sign of the bearish trend reversing.
Investors and traders identify the bullish harami using its distinct structure with a small-bodied bullish candlestick with its entire length inside the body of the prior bearish candlestick. The confirmation of trend reversal in a bullish harami pattern occurs in the third or fourth candlestick that follows the harami pattern.
Trading with the bullish harami candlestick involves making trade entries following the confirmation candlesticks. The ideal trading entry position while trading with a bullish harami pattern is during the closing hours of the third confirmation candlestick of the bullish harami. The entry positions are made above the high of the second candlestick of the harami pattern to gain maximum profits and stop losses can be used to prevent losses.
The three main advantages of the bullish harami pattern include the ease of spotting it, its comprehensibility and its ability to work well with different types of securities such as stocks, forex, indices etc. The two main disadvantages of the bullish harami include the need for trend confirmation while using it and its inability to be used in isolation. Other commonly used candlestick patterns include spinning top, shooting star, hammer, hanging man, and evening star.
What exactly is a Bullish Harami Candlestick?
A bullish harami candlestick is a price chart formation that signals bullish trend reversals. A bullish harami candlestick comprises two candlesticks including a long bearish candlestick and a short bullish candlestick. The name ‘harami’ traces its origin to the Japanese language where ‘harami’ means ‘pregnant’. The harami pattern with a short-bodied candlestick following a long-bodied candlestick resembles a pregnant woman holding a woman in her womb and that is how the pattern obtained its name. Harami patterns are of two kinds namely the bearish harami and the bullish harami. The image below depicts a bullish and bearish harami candlestick pattern.
The image above shows that both the harami patterns resemble a pregnant woman with a child in the womb. The first long candlestick represents the woman and the shorter second
Harami patterns are of two kinds namely the bearish harami and the bullish harami. The bearish harami patterns tell investors and traders about upcoming bearish trend reversals. Bullish harami patterns, on the other hand, tells traders about upcoming uptrends. The bullish harami candlestick pattern signals that the bulls are gaining control of the market and that asset prices are on the rise.
How is a Bullish Harami Candlestick Pattern structured?
The structure of a bullish harami candlestick pattern consists of a long bearish candlestick and a short bullish candlestick following it. The entire body of the second candlestick must fall inside the body of the prior bearish candlestick for the pattern to form a bullish harami pattern. The image below shows a bullish harami candlestick pattern.

The image above shows that the bullish harami candlestick pattern looks like a pregnant woman who is carrying a child in her womb. The red long bearish candlestick stands for the woman and the small green bullish candlestick represents the child in the womb. Investors and traders use this distinct shape of the pattern to identify the bullish harami pattern on price charts. The second candlestick in a bullish harami pattern is also sometimes a doji candlestick. A doji is a special candlestick pattern in which the open and close price of the security is practically equal, giving the candlestick just a horizontal line for a body.
When does the Bullish Harami Candlestick Pattern appear?
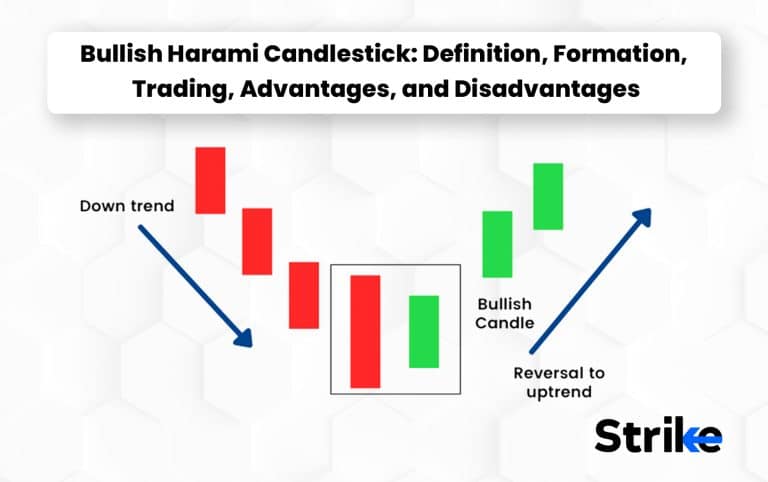
A bullish harami candlestick pattern appears at the end of a bearish trend. The appearance of the bullish harami candlestick pattern is a sign that is bearish trend is about to reverse. The image below depicts a price chart with a bullish harami pattern.

The image above shows an initial market downtrend as represented by the black downward arrow. The black downward arrow ends with the bullish harami pattern. The image shows the bullish harami pattern with the two candlesticks including the long bearish candle and short bullish candlestick following it. The image depicts that the bullish harami forms at the end of a prolonged bearish trend. The image above shows that the bullish harami signals a trend reversal from a bearish trend to a bullish trend. The prices show an increase and upward trend following the harami pattern, indicating that the bullish harami produces bullish trend reversal signals.
How common is the Bullish Harami Candlestick Pattern?
The bullish harami appears randomly frequently. The bullish harami has a frequency rank of twenty-five. The frequency rank of twenty-five implies that the pattern appears frequently enough to be spotted easily on price charts.
How to identify Bullish Harami Candlestick Pattern in Technical Analysis?
There are three main steps to keep in mind while identifying the bullish harami candlestick pattern in technical analysis. Firstly, investors and traders must look for the bullish harami at the end of a prolonged bearish trend. The bullish harami candlestick is always found a the end of a bearish trend and it signals a possible trend reversal. The image below represents the main steps in identifying bullish harami patterns.

The image above shows when bullish harami patterns appear. In the price chart above, the bullish harami appears after a prolonged bearish period.
Secondly, investors and traders must spot the two candlestick pattern formation that satisfies the conditions of the bullish harami. The image below shows what investors and traders need to look out for while spotting a bullish harami.

The image shows that the first candlestick in a bullish harami pattern is a long bearish candlestick and the second is a short bullish candlestick. The entire body of the bullish candlestick must fall inside the body of the bearish candlestick. The second bullish candlestick must make a jump from the low of the previous bearish candlestick to open at a higher position. The candlestick pattern is considered a bullish harami if it fulfils these conditions.
The third step for investors and traders is to confirm the trend that the bullish harami indicates. The bullish harami pattern, in most cases, gives a trend confirmation in the third or fourth candlestick. The image below depicts trend confirmation in a bullish harami candlestick pattern.

The image shows that the third candlestick of the pattern is a bullish candlestick confirming the trend reversal. The third or fourth candlestick is considered a bullish harami confirmation candlestick only if it closes above the prior bullish candlestick.
How accurate is the Bullish Harami Candlestick Pattern in Technical Analysis?
The bullish harami is considered an accurate indicator of trend reversals when used along with other technical indicators. The reliability and accuracy of the bullish harami pattern are not dependable when it is used in isolation as there are chances of false positives.
Can you able to improve the accuracy of a Bullish Harami Candlestick Pattern?
Yes, it is possible to improve the accuracy of bullish harami patterns. The accuracy of the bullish harami patterns can be improved using other technical indicators with them. Momentum indicators which indicate overbought and oversold levels work very well with the bullish harami patterns as the harami patterns are primarily trend reversal patterns. Examples of technical indicators which improve accuracy include the Moving Averages Convergence Divergence(MACD), the stochastic indicator and the Relative Strength Indicator(RSI).
Is a Bullish Harami Candlestick Pattern reliable in Technical Analysis?
Yes, the bullish harami candlestick pattern is reliable in technical analysis as long as it is used with other momentum-based technical indicators like the MACD or the RSI. These momentum-based indicators signal the overbought and oversold levels in the price chart which can be cross-checked with the trend reversals the bullish harami pattern predicts, to increase its reliability and reduce the risk of losses.
What is the Success Rate of the Bullish Harami Candlestick Pattern?
The success rate of the bullish harami candlestick pattern is approximately around 53%. It is because of the success rate of 53% that it is advisable to act on the bullish harami signal after confirming with other technical indicators such as the MACD or the RSI.
How Can I Trade the Stock Market Using the Bullish Harami Candlestick Pattern?
There are primarily three steps to trading in the stock market using the bullish harami pattern. The first is the identification of the pattern, the second is the confirmation and the third step involves trading based on the signals produced by the pattern. The three main steps are listed in detail below.
- Identification of the pattern
The first step to using the bullish harami pattern to trade in the stock market is identifying the pattern on the price chart. Investors and traders must look out for the bullish harami pattern with a first long bearish candlestick that is followed by a short bullish candlestick on the stock price chart. The entire body of the second candlestick must lie within the body of the prior bearish candlestick for the pattern to be a bullish harami formation.
- Confirmation of the pattern
The first step to using the bullish harami pattern to trade in the stock market is confirming the pattern on the stock price chart. The third or fourth candlestick in a bullish harami pattern usually confirms the upcoming bullish trend. The confirmation candlestick in a bullish harami is a bullish candlestick that closes above the prior bullish candlestick. The image below shows a trend confirming candlestick in a bullish harami pattern.
The image above shows that the confirmation candlestick closes above the second candlestick of the pattern. The trend is assumed to continue once the confirmation candlestick confirms the trend reversal. Investors and traders can also use other momentum-based indicators such as the MACD or RSI to confirm the predictions made by the bullish harami patterns.
- Deciding on trade entry and exit points
The third and final step to using the bullish harami pattern to trade in the stock market is entering the trade using the pattern signals. The confirmation candlestick which is usually the fourth or third candlestick in the bullish harami pattern is considered the best time to enter the trade. Investors and traders must aim to enter the trade just before the confirmation candlestick closes to maximize their returns. Investors and traders also commonly use stop losses to prevent losing a large sum of money. A stop-loss order is a pre-decided order that states that a security can be either bought or sold when it reaches a certain price known as the stop price. While trading using the bullish harami candlestick pattern, a stop loss must be placed below the low of the first bearish candlestick.
Apart from following the three main steps, investors and traders must also gauge the market conditions before trading in the stock market using the bullish harami pattern. Using indicators that confirm the trends as well as trading techniques such as stop loss order help to reduce the chances of risk.
What is the ideal time to trade utilizing the Bullish Harami Candlestick Pattern?
The ideal time to trade using the bullish harami candlestick pattern is after the bullish trend has been confirmed. The ideal time usually occurs in the third or fourth candlestick of the pattern when the trend gets confirmed. Investors and traders must enter the trade when the confirmation candle is about it close, to ensure good returns.
What Indicator is Best to Combine with Bullish Harami Candlestick Pattern?
The best indicators to combine with bullish harami candlestick patterns are momentum-based technical indicators like the Moving Averages Convergence Divergence(MACD), the stochastic indicator and the Relative Strength Indicator(RSI).
Momentum-based indicators work well with the bullish harami pattern as the trend reversals predicted by the harami patterns can be cross-checked with the overbought and oversold levels that the momentum-based indicators signal. The bullish trend is confirmed if the momentum-based indicators indicate an oversold level.
What is an example of a Bullish Harami Candlestick Pattern used in Trading?
The image below shows an example of a bullish harami candlestick pattern used in trading.

The image above shows the stock price chart of Godrej Industries Ltd. The price chart shows an initial downtrend with the prices declining. A long bearish candlestick forms at the end of the bearish downtrend. A short bullish candlestick follows the bearish candlestick and the image shows that the entire body of the bullish candlestick lies within the body of the bearish candlestick. The two candlesticks together form the bullish harami candlestick pattern. The confirmation of the upcoming trend in this case occurs in the fourth candlestick. The fourth candlestick is a bullish candlestick with its close above the previous bullish candlestick. The image shows that the trend moves upward after the appearance of the confirmation candlestick, indicating that the prices are on the rise and the bulls are gaining an advantageous position.
Is Bullish Harami Candlestick Pattern profitable?
Yes, the bullish harami candlestick pattern is profitable, especially when used along with other technical indicators. The bullish harami is not ideally used in isolation as there are chances of possible false positives. Bullish harami patterns are profitable if they are used with other indicators that confirm the trend reversals.
Is a Bullish Harami Candlestick Pattern a Bullish Reversal?
Yes, the bullish harami candlestick pattern is a bullish trend reversal indicator. The bullish harami candlestick signals trend reversals from a bearish trend to a bullish trend.
What are the advantages of a Bullish Harami Candlestick?
There are three main advantages of bullish harami candlestick patterns. All the advantages primarily revolve around the ease of spotting and identifying the bullish harami candlestick. Its distinctive shape which resembles a pregnant woman aids in its quick identification. All three main advantages of the bullish harami pattern are listed below.
- The ease of spotting
One of the main advantages of the bullish harami pattern is the ease of spotting it on a price chart. Investors and traders can easily identify the bullish harami pattern on a price chart using its unique shape that resembles a pregnant woman.
- The comprehensibility
Another key advantage of the bullish harami candlestick pattern is its comprehensibility. Being an easy pattern to both identify and understand, this pattern is highly useful to beginners as well as advanced traders. The trend reversal that the bullish harami signals is simple and can be understood by all.
- The ability to work well with different types of securities
The third main advantage of the bullish harami pattern is its ability to work well with different kinds of securities such as stocks, forex, indices etc. The bullish harami pattern is, thus, useful to a wide range of investors and traders across different security markets.
Other advantages of the bullish harami pattern include its ability to combine well with simple momentum-based technical indicators such as the MACD and the RSI. The bullish harami is also a pattern that frequently appears in price charts, making it easier to spot them.
What are the disadvantages of a Bullish Harami Candlestick?
There are two main disadvantages of the bullish harami including the need for trend confirmation while using it and its inability to be used in isolation. Both the disadvantages stem from the bullish harami pattern’s tendency to produce false positive signals from time to time. The two disadvantages are listed below in detail.
- The need for trend confirmation
The main disadvantage of the bullish harami candlestick is the need to wait for the trend reversal confirmation. The confirmation for the bullish harami pattern appears only in the third or fourth candlestick of the harami pattern, which means investors and traders have to wait for a day or two to get the confirmation.
- The inability to be used in isolation
The second main disadvantage of the bullish harami pattern is that it is not advisable to use this pattern in isolation. The bullish harami pattern can give false positive signals sometimes which could lead to losses if not used along with other technical indicators.
Investors and traders usually use the bullish harami candlestick pattern with technical indicators like the MACD and RSI to cross-check and confirm the signals the harami pattern produces. Using technical indicators along with the bullish harami candlestick pattern prevents incurring losses or limits the loss incurred.
What are other Types of Candlestick besides Bullish Harami?
There are more than 40 types of candlesticks including bullish candlestick patterns, bearish candlestick patterns and continuation candlestick patterns. Bullish candlestick patterns include those candlesticks patterns which signal bullish trend reversals such as hammer, piercing pattern, bullish harami, morning star, inverted hammer, tweezer bottom etc. Bearish candlestick patterns are patterns that signal bearish trend reversals, including hanging man, dark cloud cover, shooting star, evening star, bearish harami, tweezer top etc among other types of candlestick patterns.
Continuation candlestick patterns are those that represent the continuation of the existing active trend. Examples of continuation candlestick patterns include doji, spinning top, high wave, falling window, rising three methods, falling three methods etc.
Are a Bullish Harami Candlestick and a Shooting Star Candlestick Similar?
No, a bullish harami candlestick is not similar to a shooting star candlestick. There are primarily two differences between the two. Firstly, a bullish harami candlestick is a bullish trend reversal indicator whereas the shooting star is a bearish trend reversal indicator. Secondly, the bullish harami candlestick pattern is made up of two candlesticks while the shooting star pattern consists of a single candlestick.
What is the difference between a Bullish Harami Candlestick and a Bearish Harami Candlestick?
There are mainly three differences between the bullish harami and bearish harami candlesticks which are listed in the table below.
| Bullish Harami | Bearish Harami |
| It signals bullish trend reversals. | It signals bearish trend reversals. |
| The pattern consists of a long bearish candlestick followed by a short bullish candlestick. | The pattern consists of a long bullish candlestick followed by a short bearish candlestick. |
| It appears at the end of a bearish downtrend. | It appears at the end of a bullish uptrend. |


 Previous Article


![15 Investing.com Alternatives [Free+Paid] You Should Use in 2026](https://www.strike.money/wp-content/uploads/2026/04/Investing.com-Alternatives.jpg "15 Investing.com Alternatives [Free+Paid] You Should Use in 2026 70")
![15 TradeStation Alternatives [Free+Paid] You Should Use in 2026](https://www.strike.money/wp-content/uploads/2026/04/TradeStation-Alternatives.jpg "15 TradeStation Alternatives [Free+Paid] You Should Use in 2026 71")
![15 Chartink Alternatives [Free+Paid] You Should Use in 2026](https://www.strike.money/wp-content/uploads/2026/04/Chartlink-Alternatives.jpg "15 Chartink Alternatives [Free+Paid] You Should Use in 2026 72")
: Overview, 10 Types of Indicators, Settings for Different Markets 73")


 : Definition, Formula, calculation, Uses, Advantages Vs limitations 76")


No Comments Yet.