The Bearish Engulfing Candlestick is a technical chart pattern, which helps traders to analyse impending price declines. Bearish engulfing candlestick occurs in a price chart when a small(white/green) bullish candlestick is followed by a large(red/black) bearish candlestick that completely engulfs the previous candlestick. Bearish Engulfing Candlestick pattern is important as it helps traders to identify the situation where sellers have surpassed buyers, such situations cause a lowering of the price (down candle) more than what buyers could do (up candle).
The bearish engulfing candlestick pattern is used by traders as a signal to enter a short position or to exit a long position. Traders also use additional fundamental research and technical analysis tools, such as trend lines, support and resistance levels, or moving averages, Relative Strenght index etc. to validate the signal by the candlesticks and choose their entry and exit points for the trade.
What is a Bearish Engulfing Candlestick?
A bearish engulfing candlestick is a technical chart pattern that occurs when a small bullish candlestick is followed by a larger bearish candlestick that completely engulfs the previous candlestick, including its shadows, signaling a trend reversal. A bearish engulfing candlestick pattern indicates that the bears have taken control of the market and are likely to drive prices of the stock lower. It is frequently interpreted as a sign that the current trend will reverse. Bearish Engulfing Candlestick Pattern occurs during an uptrend.
The bearish engulfing pattern is important because it shows sellers of a particular stock have overtaken the buyers of the same stock and are pushing the price more aggressively down (black/red candle), than the buyers were able to push it up (white/green candle)
A bearish engulfing candlestick can be identified by its six distinct signals and characteristics, which include:
- Formation: The bearish engulfing pattern is formed by two candlesticks, with the first bullish stick being a smaller (white/green) bullish candlestick and the second (black/red) candlestick being a larger candlestick. The larger bearish candlestick completely engulfs the previous bullish candlestick, including its shadows.
- Colour: The first candlestick in the pattern is usually green or white, indicating bullishness, while the second candlestick is red or black, indicating bearishness.
- Size: The second bearish candlestick is typically larger than the previous bullish candlestick, indicating that the bears (sellers) have taken control of the market, indicating a decline in the value of the stock.
- Trend: The pattern usually appears during an uptrend, which means that the prices of the stock are going to fall and signals a potential reversal of the trend.
- Volume: The pattern is typically accompanied by high trading volume, which indicates a strong conviction from traders.
- Confirmation: Traders often look for confirmation of the pattern through additional technical analysis tools, such as trend lines, support and resistance levels, or moving averages, RSI etc.
The bearish engulfing candlestick is a pattern, which is a bearish reversal signal that suggests a potential shift in the trend and it helps market participants to discover new opportunities.
How Does Bearish Engulfing Candlestick Pattern Form?
The bearish engulfing candlestick pattern is formed by two candlesticks, with the first candlestick being a smaller bullish candlestick and the second candlestick being a larger bearish candlestick. This pattern can be identified with the help of only two candlesticks.

The pattern typically occurs during an uptrend and signals a potential reversal in the trend.
Following is a step-by-step explanation of how the bearish engulfing candlestick pattern is formed:
- An uptrend is in progress, and the market is in a bullish phase.
- The first candlestick in the pattern of a particular asset like stocks, gold etc. is a smaller bullish candlestick, which typically has a white or green body.
- The second candlestick in the pattern is a larger bearish candlestick, which typically has a red or black body. The bearish candlestick completely covers the length of the previous bullish candlestick, including its shadows.
- The second bearish candlestick opens higher than the previous bullish candlestick’s closing price, indicating that the bulls are still in control.
- The sellers of the security take control and push the price down during the session, causing the second (red/black) candlestick to close below the previous day’s low.
- The pattern is typically accompanied by high trading volume, indicating that there is strong conviction from traders.
The formation of the bearish engulfing candlestick pattern suggests a trend reversal, as it signals that the bears have taken control of the market and are likely to drive prices down. Such a situation indicates a fall in the price and upcoming growth in the demand of the stock.
When do Bearish Engulfing Candlestick Patterns occur?
Bearish engulfing candlestick patterns occur during an uptrend and signal a potential reversal in the trend. This means that the previous candlestick should have a bullish body, which means that the first candlestick in the pattern should be a smaller bullish candlestick.
The bearish engulfing pattern typically occurs when market sentiment shifts from bullish to bearish (buying trend to selling trend), which can happen for a variety of reasons. Following are the top three catalysts for the formation of a bearish engulfing pattern:
- Economic Data Releases: Negative economic data releases such as weaker than expected GDP growth or higher unemployment can cause a shift in market sentiment from bullish to bearish, leading to the formation of a bearish engulfing pattern. For example, a negative news about a particular stock would immediately cause a change in the market sentiment, changing people’s attitude from buying to selling.
- Geopolitical Events: Political events such as elections, wars, trade restrictions or geopolitical tensions can also cause a shift in market attitude and the formation of a bearish engulfing pattern.
- Technical Factors: Technical factors such as overbought conditions or a break of key support levels can also lead to a shift in market sentiment and the formation of a bearish engulfing pattern.
The bearish engulfing candlestick pattern can also occur due to reasons other than geopolitical, economic and technical, but it always signals a potential shift in the direction of the trend.
How to Identify Bearish Engulfing Candlestick Pattern?
Investors can identify a bearish engulfing candlestick pattern by following these six steps and use it as an indication of a possible trend reversal in future:
- Look for a potential uptrend: The bearish engulfing candlestick pattern must occur during an uptrend. This means that the previous candlestick should have a bullish body.
- Identify the first bullish candlestick: The first (white/green) candlestick in the pattern should be a smaller bullish candlestick.
- Identify the second bearish candlestick: The second (red/black) candlestick in the pattern should be a larger bearish candlestick that completely engulfs the previous bullish candlestick.
- Check the opening price of the second candlestick: The second candlestick should open at a higher price than the previous candlestick’s closing price.
- Check the closing price of the second candlestick: The second candlestick should close below the previous day’s low, indicating that the bears have taken control of the market.
- Confirm the pattern with trading volume: The pattern is typically accompanied by high trading volume, indicating a strong conviction from market participants.
Analysing a bearish engulfing candlestick pattern can be a useful tool for traders to identify entry and exit points in the market. It is highly important to understand that no trading strategy can assure 100% success, and it is always important to use additional technical and fundamental analysis tools to confirm any patterns.
Does the colour of Bearish Engulfing Candlestick Patterns matter?
Yes, the colour of the bearish engulfing candlestick pattern matters as it provides an indication of market sentiment and direction of the trend.
The first candlestick is usually green or white (indicating bullishness) in a bearish engulfing pattern. The second candlestick, which is larger and bearish, is usually red or black, indicating bearishness. The colour contrast plays a significant role in identifying trend reversal opportunities by the traders without getting confused. This colour contrast highlights the shift in market sentiment from bullish to bearish, signalling a potential reversal in the trend.
The colour of the bearish engulfing pattern is particularly important when considering its overall context in the chart.
The pattern suggests a strong bearish sentiment and a potential shift in the trend.
For example the pattern suggests a strong bearish sentiment and a potential shift in the trend, when the pattern occurs after a prolonged uptrend and the second candlestick is black. It can also be a weaker signal and may not lead to a significant reversal, when the second candlestick is only slightly bearish and doesn’t completely engulf the previous candlestick,
Traders need to pay attention to both the colour and size of the second candlestick in the pattern, as they provide important information about the market sentiment and potential trend reversal, so hence we can say that the colour of the bearish engulfing candlestick pattern is highly important.
How to use Bearish Engulfing Candlestick Patterns in Technical Analysis?
Following are six steps on how to use colour of the bearish engulfing candlestick pattern engulfing candlestick patterns in technical analysis:

- Identify the pattern: Look for a smaller bullish candlestick followed by a larger bearish candlestick that completely engulfs the previous candlestick, including its shadows. This pattern signals a potential reversal in the uptrend.
- Confirm the pattern: Look for confirmation of the pattern through other technical analysis tools such as trend lines, support and resistance levels, or indicators like the Relative Strength Index (RSI) or Moving Average Convergence Divergence (MACD).
- Consider the volume: A bearish engulfing pattern is often accompanied by high trading volume, indicating strong conviction from market participants. Higher trading volume also confirms the validity of the pattern.
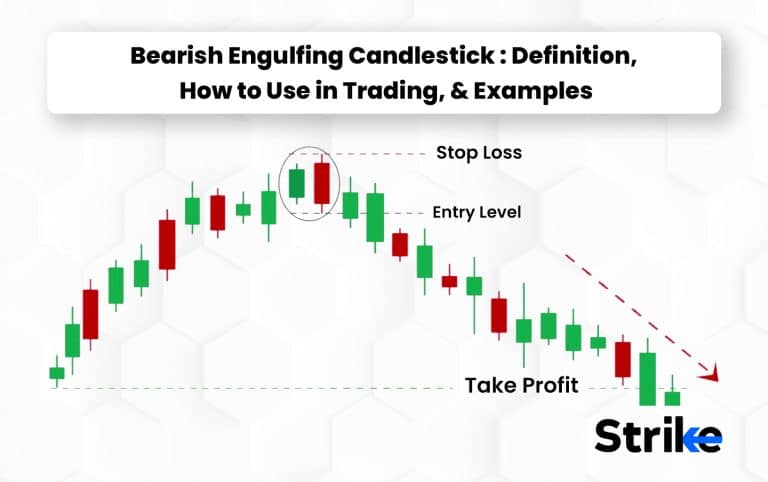
- Place a stop-loss order: Place a stop-loss order below the low of the bearish candlestick to manage risk. This will protect against any unexpected price movements that may occur.
- Take profits: Bearish engulfing patterns are often followed by a significant downtrend. Traders can consider taking profits at key support levels or using trailing stops to lock in profits as the price moves lower.
- Monitor other market factors: Traders should monitor other market factors such as economic data, geopolitical events, and news announcements that may impact the price action, even when the bearish engulfing pattern is a strong signal.
Bearish engulfing patterns can be useful in technical analysis to identify potential trend reversals and manage risk. Traders can better position themselves to succeed in the dynamic and ever-changing financial markets, by using Bearish engulfing patterns in combination with other technical indicators and sound risk management strategies.
How reliable are Bearish Engulfing Candlestick Patterns?
The reliability of the bearish engulfing candlestick pattern depends on three factors, involving the context of the pattern, the strength of the trend, and the confirmation from other technical analysis tools. The pattern, in general, is considered to be a strong reversal signal when it occurs after a prolonged uptrend and is accompanied by high trading volume. Traders should also look for confirmation from other technical indicators, such as moving averages or trend lines, to increase the reliability of the signal.
How accurate are Bearish Engulfing Candlestick Patterns?
The accuracy of the bearish engulfing candlestick pattern as a reversal signal depends on three factors, including the overall market conditions, the time frame being analysed, and the quality of the pattern itself.
The bearish engulfing pattern is considered to be a reliable and powerful reversal signal when it occurs during an uptrend and is accompanied by high trading volume. The pattern is seen as a signal that the bears have taken control of the market and are likely to drive prices down
It is important to note that the candlestick pattern can also be a false signal, particularly in choppy or volatile markets where prices may fluctuate rapidly. Traders should always use additional technical analysis tools and fundamental analysis to confirm the validity of the pattern and avoid making trading decisions based on one signal alone.
Studies have shown that the bearish engulfing pattern can be effective when combined with other technical indicators, such as trend lines, moving averages, or oscillators. The bearish engulfing pattern for example may provide additional confirmation of the reversal signal, when
appears at a resistance level.
Can you improve the Bearish Engulfing Candlestick accuracy?
Yes, the accuracy of the bearish engulfing candlestick pattern can be improved by incorporating additional technical analysis tools and factors into the analysis.
Traders should confirm the bearish engulfing pattern with other indicators and analysis tools, even when it is a strong reversal signal. This can help to filter out false signals and provide additional evidence to support the reversal.
Following are three technical analysis tools that traders commonly use in conjunction with the bearish engulfing pattern:
- Trend lines: Drawing trend lines can help to identify the overall trend and provide confirmation of a reversal signal.
- Moving averages: Using moving averages can help to identify the direction of the trend and provide additional confirmation of the reversal.
- Oscillators: Oscillators such as the Relative Strength Index (RSI) or the Stochastic Oscillator can help to identify overbought or oversold conditions and provide confirmation of the reversal.
Traders should also consider fundamental factors that affect the market’s direction as this would help them to confirm any patterns or trends for proper risk management.
What is the success rate of Bearish Engulfing Candlestick Patterns?
The success rate of bearish engulfing candlestick patterns can vary, no technical analysis tool or pattern can guarantee 100% accuracy in predicting market movements. The success rate of the bearish engulfing pattern depends on factors including the context in which it occurs and the trader’s skill in using it.
The bearish engulfing pattern is considered to be one of the more reliable reversal patterns, particularly when it occurs after a prolonged uptrend. A study conducted by Thomas Bulkowski, in his book “Encyclopedia of Candlestick Charts,” found that the bearish engulfing pattern had a success rate of 79% in predicting a downward price move in a sample of 895 patterns.
How to Trade using Bearish Engulfing Candlestick in the Stock Market?
The following five steps can be helpful for traders using Bearish Engulfing Candlestick in the Stock Market:
- Identify the pattern: Traders should look for a bearish engulfing pattern in the charts. a bearish engulfing pattern should occur during an uptrend and be accompanied by high trading volume.
- Wait for confirmation: Traders should look for additional confirmation signals before entering a trade. This can include support and resistance levels, trend lines, or other technical indicators.
- Enter the trade: The trader can enter a short position, once the trader has identified the bearish engulfing pattern and confirmed it with other technical indicators. This involves selling the stock with the expectation that its price will decrease.
- Place a stop-loss order: It is important to place a stop-loss order to exit the trade to manage risk, if the stock price moves against the trader. The stop-loss order should be placed above the high of the bearish engulfing pattern.
Traders should also consider other factors that may affect the stock’s direction, such as economic data, company-specific news , industry trends, and geopolitical events. This helps traders to get an overall idea about the position of the stock market, so that they can make informed decisions.
How Should Traders React to a Bearish Engulfing Candlestick?
Traders should pay close attention to the formation of a bearish engulfing candlestick pattern, as it is a strong signal of a potential reversal in the trend. Traders should consider reducing long positions or taking a short position during an uptrend, depending on market conditions.
Confirmation of the pattern through other technical analysis tools, such as trend lines, moving averages, and oscillators, can increase the reliability of the signal. It is also important to consider the market’s fundamental factors, such as economic data and geopolitical events, when making trading decisions.
Traders should also consider setting stop-loss orders to manage risk in case the pattern is a false signal, and should have a well-defined trading plan that includes entry and exit strategies. It is essential to use proper risk management techniques and not to risk more than they can afford to lose.
What are Examples of a Bearish Engulfing Candlestick Pattern?
The first candlestick is a small bullish candlestick, and the second candlestick is a larger bearish candlestick that completely engulfs the previous bullish candlestick.

The second candlestick opens higher than the previous day’s closing price, indicating that the bulls are still in control. The bears take control during the session, and push the price down, causing the second candlestick to close below the previous day’s low.The pattern is accompanied by high trading volume, indicating strong conviction from market participants.
Can You Trade Bearish Engulfing Candlestick Pattern with RSI?
Yes, traders can use the Relative Strength Index (RSI) indicator to trade the bearish engulfing candlestick pattern. The RSI is a popular momentum indicator that measures the strength of an asset’s price action and can help traders confirm the direction of the trend.
Traders can look for bearish divergence between the RSI and the price action, when using the RSI in conjunction with the bearish engulfing pattern. Suppose the RSI is making lower highs while the price is making higher highs, this suggests that the trend is losing momentum and is likely to reverse. This can confirm the bearish signal of the bearish engulfing pattern and increase the reliability of the trade.
Traders can also use the RSI to confirm oversold conditions when the bearish engulfing pattern occurs, when the RSI is below 30, this indicates that the asset may be oversold and due for a rebound. Traders may, in this case, consider waiting for a bullish reversal pattern or confirmation before entering a long position.
Can you trade Bearish Engulfing Candlestick Pattern with MACD?
Yes, traders can use the Moving Average Convergence Divergence (MACD) in conjunction with the bearish engulfing candlestick pattern to make trading decisions.
The MACD is a popular technical analysis indicator that measures the momentum of a security’s price action. It consists of two moving averages, a faster one and a slower one, and a histogram that shows the difference between the two moving averages.
It is considered a bearish signal, when the MACD line (the faster moving average) crosses below the signal line (the slower moving average), indicating that the momentum is turning negative.
Traders can use the MACD in combination with the bearish engulfing pattern to confirm a potential trend reversal.
Bearish engulfing patterns indicate that the bears are taking control of the market, and a potential trend reversal is imminent, Whenever the MACD line crosses below the signal line, for example, when a bearish engulfing pattern forms. This could be a signal for traders to consider taking a short position or exiting long positions.
What are the benefits of Bearish Engulfing Candlestick Pattern?
The bearish engulfing candlestick pattern has these five potential benefits for traders who use it as part of their trading strategy:
- Provides a clear signal: The bearish engulfing pattern is a straightforward and clear signal that indicates a potential trend reversal. Traders can easily identify that the bears are taking control, and the price is likely to go down, when this pattern occurs.
- High probability of success: The bearish engulfing pattern has a relatively high probability of success when it occurs in the right market conditions. Studies have shown that when the pattern forms after a prolonged uptrend, there is a higher likelihood of a trend reversal.
- Easy to identify: The bearish engulfing pattern is easy to identify on a price chart, making it accessible for traders of all levels of experience. Traders can use this pattern to help them spot potential trading opportunities without the need for complex technical analysis.
- Can be used in conjunction with other technical indicators: The bearish engulfing pattern can be used in combination with other technical indicators to increase the likelihood of success. Traders can use indicators such as the RSI, MACD, and moving averages to confirm the reliability of the pattern and make informed trading decisions.
- Provides a clear stop-loss level: Traders can use the high of the bullish candlestick as a clear stop-loss level, when a bearish engulfing pattern occurs. This helps traders manage risk and limit their potential losses in case the pattern fails to play out as expected.
The bearish engulfing pattern is a useful tool in a trader’s toolbox, providing clear signals and high probability of success when used correctly.
What are the limitations of Bearish Engulfing Candlestick Pattern?
The bearish engulfing pattern is a useful technical analysis tool for identifying potential trend reversals. Bearish Engulfing Pattern also does have its limitations (just like other trading indicators and methods) that traders should be aware of when using it to make trading decisions:
- Reliability: The bearish engulfing pattern is considered a reliable signal for drop of stock prices, when it occurs in the right market conditions, such as after a prolonged uptrend. It can,however, be less reliable in other market conditions, such as in a sideways market or after a short-term price move.
- Confirmation: Additional technical analysis tools are required to confirm the bearish engulfing pattern before making trading decisions. Traders may, for example, use volume analysis, trendlines, or other indicators to confirm the reliability of the bearish engulfing pattern. Depending solely on the bearish engulfing pattern can result in false signals and immediate trading losses.
- False Signals: It can still produce false signals of reversals that might not even occur, even when the bearish engulfing pattern is confirmed by other technical analysis tools and fundamental research. Traders should use proper risk management techniques and tools to avoid major losses.
- Time Frame Dependence: The bearish engulfing pattern is more helpful on longer timeframes, such as weekly charts, as it takes into account the overall trend of the market. The bearish engulfing pattern is not that much effective on shorter time frames, such as intraday charts, because the patterns can be influenced by short-term price movements and noises.
- Over-reliance: Traders should avoid heavy dependency on a single technique or tools, same is true in case of Bearish Engulfing candles.
They should use a combination of technical analysis tools and fundamental analysis to make informed trading decisions and manage risk appropriately.
Bearish Engulfing candles can provide useful insights into potential shifts in market sentiment and trends, it is important to recognize their limitations. These candles should not be relied upon solely as a trading signal, as they can be prone to false positives and can also indicate temporary market fluctuations rather than long-term reversals.
Is Bearish Engulfing Candlestick Profitable?
Yes, the bearish engulfing candlestick pattern can be profitable for traders of all experience levels, when used in the right manner and with proper risk management.
Traders can use the bearish engulfing pattern as a signal to enter short positions, with a stop loss placed above the high of the bullish candle. Profit targets can be set at key support levels or based on the trader’s risk-reward ratio. The Bearish Engulfing Candlestick can be easily and efficiently applied by traders to predict future market conditions and maximise profits.
Is the Bearish Engulfing Candlestick the Best Bearish Candlestick Pattern?
Yes, the Bearish Engulfing Candlestick pattern is considered one of the best bearish candlestick patterns by many traders and analysts all around the world, because of its easy application and effective results.
There are basically three reasons why the Bearish Engulfing Candlestick pattern is considered one of the best bearish candlestick patterns.
- Firstly, Bearish Engulfing Candlestick is a strong and clear signal of a trend reversal, indicating that the bulls (buyers) have lost control and that the bears (sellers) are taking over.
- Secondly, Bearish Engulfing Candlestick is a very easy pattern to spot using candlesticks, making it accessible and understandable to traders of all levels from beginners to experts.
- Finally, Bearish Engulfing Candlestick is an essential technical pattern that occurs frequently in the market, providing traders with many opportunities to enter profitable trades.
The Bearish Candlestick Pattern has been a famous technical indicator from its time of creation. The main advantages of this pattern is that it provides strong, clear and easy to spot signals.
Is Bearish Engulfing Candlestick a Double Candlestick Pattern?
Yes, the Bearish Engulfing Candlestick is a double candlestick pattern.
The first candlestick in the pattern is usually a green or white candlestick, indicating that the market is in an uptrend. The second candlestick is a red or black candlestick, showing that the market has turned bearish. Both these candlesticks are used by traders to find opportunities for trend reversals. The fact that the second candlestick completely engulfs the first one indicates that the bearish pressure in the security market has overpowered the bullish pressure, and the sellers have taken control of the market
The Bearish Engulfing Candlestick pattern is a double candlestick pattern that signals a potential trend reversal from bullish to bearish, other examples of double candlestick pattern include Bullish Candlestick pattern.
What is the difference between Bearish Engulfing Candlestick and Bullish Engulfing Candlestick?
Bearish Engulfing and Bullish Engulfing Candlesticks are two important chart patterns used by traders to find potential opportunities of trend reversals in the market. Bearish Engulfing and Bullish Engulfing Candlesticks both have a similar structure and working, they operate for different market conditions and have opposite indications for price direction.
Bearish Engulfing Candlestick Pattern: The Bearish Engulfing Candlestick Pattern is a two-candlestick pattern that happens during an uptrend. The first candlestick is a small green or white candlestick, indicating that the market is in an uptrend. The second candlestick is a large red or black candlestick that completely engulfs the previous candlestick. This pattern indicates that the bears (sellers) have taken control of the market, and the uptrend of securities being traded is likely to reverse.
Bullish Engulfing Candlestick Pattern: The Bullish Engulfing Candlestick Pattern is also a two-candlestick pattern that occurs during a downtrend. A bullish engulfing pattern can be contrasted with a bearish engulfing pattern, which is also used for finding trend reversal of securities. The first candlestick is usually a red or black coloured candlestick, indicating that the market is in a downtrend. The second candlestick is a large green or white candlestick that completely engulfs the previous candlestick. This pattern indicates that the bulls (buyers) have taken control of the market, and the downtrend of the securities being traded is likely to reverse.
Following are three major key differences between Bearish Engulfing and Bullish Engulfing Candlestick Patterns:
- Market conditions: The key difference between the market conditions of both the patterns is that, the Bearish Engulfing Candlestick Pattern occurs during an uptrend, while the Bullish Engulfing Candlestick Pattern occurs during a downtrend.
- Candlestick colours: In the Bearish Engulfing pattern the first candlestick is a small green or white candlestick, while in the Bullish Engulfing pattern, the first candlestick is a small red or black candlestick. The colour scheme for both candlestick patterns are opposite to each other.
- Implications for price direction: The Bearish Engulfing pattern indicates that the market is likely to reverse from an uptrend to a downtrend, where the sellers dominate the buyers, while the Bullish Engulfing pattern indicates that the market is likely to reverse from a downtrend to an uptrend, a scenario where buyers dominate sellers.
The Bearish Engulfing and Bullish Engulfing Candlestick both patterns have a similar structure and technical working, but they occur in different market conditions and have opposite implications for price direction depending on market inputs. Traders use both the Bearish Engulfing and Bullish Engulfing Candlestick patterns to identify potential opportunities of trend reversals and make trading decisions accordingly.


 Previous Article


![15 Investing.com Alternatives [Free+Paid] You Should Use in 2026](https://www.strike.money/wp-content/uploads/2026/04/Investing.com-Alternatives.jpg "15 Investing.com Alternatives [Free+Paid] You Should Use in 2026 40")
![15 TradeStation Alternatives [Free+Paid] You Should Use in 2026](https://www.strike.money/wp-content/uploads/2026/04/TradeStation-Alternatives.jpg "15 TradeStation Alternatives [Free+Paid] You Should Use in 2026 41")
![15 Chartink Alternatives [Free+Paid] You Should Use in 2026](https://www.strike.money/wp-content/uploads/2026/04/Chartlink-Alternatives.jpg "15 Chartink Alternatives [Free+Paid] You Should Use in 2026 42")
: Overview, 10 Types of Indicators, Settings for Different Markets 43")


 : Definition, Formula, calculation, Uses, Advantages Vs limitations 46")


No Comments Yet.