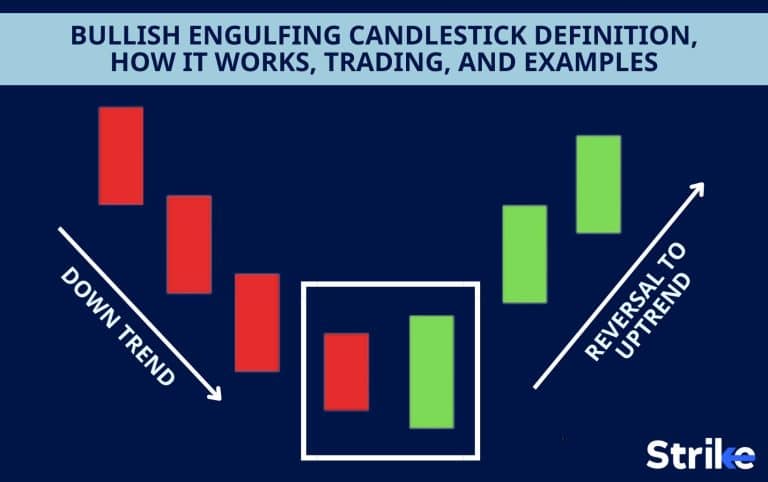
A Bullish Engulfing Pattern is a two-candlestick reversal pattern which forms when a small black or red candlestick is followed the next day by a large white or green candlestick. The bullish engulfing pattern occurs after a downtrend consisting of two candlesticks, the bullish candlestick that covers the bearish candlestick.
A bullish engulfing candlestick pattern signals traders that the market is about to enter an uptrend after a previous decrease in prices. This reversal pattern indicates that bulls are taking control of the market and may potentially drive prices much higher, indicating the ideal opportunity to initiate a long position.
Engulfing candles are one of the most popular candlestick patterns used to identify whether the market is under pressure to move upward or downward. Engulfing candles are a lagging technical indicator, which means they appear after the price activity. This is because they require the data from the preceding two candlesticks before issuing a signal.
What is a Bullish Engulfing Candlestick?
A bullish engulfing candlestick is a white candlestick that opens lower than the previous day’s close and ends higher than the previous day’s opening. It can be identified when a little black candlestick, which symbolizes a bearish trend, is followed the following day by a large white candlestick, which signifies a bullish trend.The body of the latter candlestick completely engulfs the former.

The bullish engulfing candlestick informs traders that buyers are fully in charge of the market, following a previous bearish run. A long position or buying the market is often interpreted as a signal to profit from the market reversal. The bullish pattern also signals short-term traders to think about closing their trade.
The bullish engulfing pattern appears in a downtrend. The price opens lower than the prior low on the second day of the pattern. The buying pressure however, causes it to rise to a level higher than the previous high resulting in a clear victory for the buyers.
How does Bullish Engulfing Candlestick Pattern Formed?
A bullish engulfing pattern is a candlestick pattern that forms when a little black candle is followed the next day by a massive white candle whose body completely overlaps or engulfs the body of the previous day’s candle.There must be a preceding trend to form a bullish engulfing pattern. The trend in this situation should be a downward trend. Below are the rules for identifying a Bullish Engulfing Candlestick Pattern.

- The first candle must be bearish and the second candle must be bullish.
- The second candle must open below the close of the first candle.
- The second candle must close above the open of the first candle.
- The range (high and low) of the second candle must completely engulf the range of the first candle.
Meeting these rules indicate that the bulls have taken control of the market and that a bullish trend reversal may be imminent. Traders often use this pattern as a signal to buy, as it suggests that prices may be heading higher.
When do Bullish Engulfing Candlestick Patterns occur?
The bullish engulfing pattern occurs when a black or red candlestick is followed by a green or white or hollow candlestick the next day in a graph. Black or red candlesticks indicate that the opening price was higher than the closing price. A green or white or hollow candlestick indicates that stocks closed higher than the opening prices.
Bullish Engulfing Candlestick Patterns occur in any market and on any timeframe, but they are most effective when they appear after a downtrend. This is because the pattern represents a shift in market sentiment from bearish to bullish. Pattern occurring after a downtrend suggests that the bears have lost control and that the bulls are taking over, which can lead to a trend reversal.
The pattern also occur during a period of consolidation, which can signal a potential break out to the upside. Traders often look for confirmation of the pattern with other technical indicators, such as volume and momentum, to increase the probability of a successful trade.
How to Identify a Bullish Engulfing Candlestick Pattern?
Bullish Engulfing Patterns can be recognized by identifying a downtrend in the graph. There should be a small black candle at the bottom of the downtrend. The black candle must be followed by a white candle whose body shall completely engulf the black candle. The top of the white candle must be higher than the top of the black candle, and its bottom must be lower than the bottom of the black candle.
Below are the steps to identify a Bullish Engulfing Candlestick Pattern.
- Look for a downtrend in the market.
- Identify a small bearish candle.
- Look for a larger bullish candle that follows the bearish candle.
- Check that the bullish candle opens below the close of the previous bearish candle.
- Check that the bullish candle closes above the open of the previous bearish candle.
- Ensure that the range (high and low) of the bullish candle completely engulfs the range of the previous bearish candle.
- Verify that the pattern occurs after a significant price decline.
- Look for confirmation of the pattern with other technical indicators, such as volume and momentum.
- Use the pattern as a signal to buy, but confirm with other technical analysis tools before making any trading decisions.
Traders can identify Bullish Engulfing Candlestick Patterns by following these steps,and use them as a signal to potentially enter a long position.
Does the color of Bullish Engulfing Candlestick Patterns matter?
Yes, the color of the Bullish Engulfing Candlestick pattern matters. The color of the candle displays whether the price direction is up (green) or down (red). A large green candle surrounds a small red candle to form the pattern during a downtrend. It shows that the buyers are overtaking the sellers and a trend reversal is expected.
How Does Bullish Engulfing Candlestick Patterns Work?
A Bullish Engulfing Pattern is a trend reversal pattern that consists of two candles. The first candle indicates that the market has been controlled by the bears. The second candle opens lower than the first one. Current upward pressure of the market pushes the prices higher, often to the point where the second candle is twice the size of the first.
The bullish candle signals to traders that after a previous negative run, buyers are back in full control of the market. It is sometimes interpreted as a buy signal to profit from the market reversal, and also serves as a signal to end a short run.
How to use Bullish Engulfing Candlestick Patterns in Technical Analysis?
In technical analysis, the analysts first identify and confirm the downtrend by using a bullish engulfing candlestick. They enter the trade and consider the long position after confirming the downtrend. The bullish engulfing candlestick pattern helps the traders to spot the trend reversals that indicate trend continuation and also assists them with exit signals. During technical analysis the bullish candlestick patterns can quickly and easily identify when the price is looking to move higher.
Analysts should also take a close look at the types of candlestick patterns that preceded the two candlesticks that form the bullish engulfing pattern. It is easier to determine if the Bullish Engulfing pattern is a true trend reversal if analysts also consider the preceding candlesticks. A trend reversal is expected when a second white candlestick closes higher than the bullish engulfing candlestick, which is confirmed by the number of previous black candlesticks engulfed by the bullish candlestick.
How reliable are Bullish Engulfing Candlestick Patterns?
The bullish engulfing pattern is a reliable reversal pattern, especially when it occurs after an elongated downtrend. The pattern is reliable because of its significant reversal in market sentiment, with bulls taking control of the market following a period of bearish control. This change in market attitude is sufficient to raise prices. The bullish engulfing pattern is a trustworthy sign of a possible price reversal.
How accurate are Bullish Engulfing Candlestick Patterns?
The bullish engulfing candlestick is quite accurate. It has a 63% reversal rate.This means the price closes above the candlestick pattern’s peak 63% of the time. The drawback is that the post breakout performance is not that good with an overall performance rank of 84.
A closer look at the numbers shows that downward breakouts are where this pattern performs extraordinarily. A dip of 1.18% is the best move 10 days after an upward breakout. You can observe a rise generally after ten days of an uptrend, but not in this candlestick. Downward breakouts are thus more favorable in case of bullish engulfing candlestick patterns.
How to improve Bullish Engulfing Candlestick accuracy?
There are 3 ways that are most frequently used by the traders to enhance the accuracy of a bullish engulfing candlestick. These 3 methods are volume, the market volatility and considering other indicators.
- Use volume:- Volume is a remarkable indicator of market sentiment that offers more details about the market. The volume reveals the conviction behind the market’s swings, while a price chart only shows you what the market has done.
One sensible strategy to relate the idea of volume to the bullish engulfing pattern would be to demand that the pattern’s volume be greater than the volume of the neighboring bars. Substantial volume indicates that the bullish engulfing was executed with accuracy by the market, which could increase the pattern’s profitability.
Compare the volume of the candles that makes the pattern.
The pattern will be more accurate when the volume of the second bullish candle is visibly higher than the first bearish candle; it refers to the buyers acting with greater conviction than the sellers.
- Account for volatility:- The overall market volatility sometimes can have a great impact on the results of a specific pattern. You can decide against making a deal, if the market is volatile lately. Markets that are more volatile have larger swings, which boosts the probability that they will, by accident, engage in a bullish engulfing than those that are less volatile.
- Consider other indicators:- Bullish engulfing pattern is an impressive tool on its own, however no technical indicator is 100% accurate. Using other indicators like RSI and MACD along with a bullish engulfing pattern can provide more effective results.
These methods help to improve the efficiency of the engulfing pattern.Traders often rely on other technical indicators and constantly monitor the market volatility before trading.
What is the success rate of Bullish Engulfing Candlestick Patterns?
The success rate of the bullish engulfing candlestick pattern is quite promising with a 63% reversal rate according to Bulkowski.
The interpretive power of the Bullish Engulfing Pattern comes from the remarkable change of sentiment from a bearish gap down in the morning to a large bullish candle that closes at the highs of the day.
How to Trade using Bullish Engulfing Candlestick in the Stock Market?
The bullish engulfing candlestick is used by the traders in the stock market to predict trend reversals. Traders identify the bullish engulfing pattern and plan to trade accordingly. This might involve setting a stop loss. Stop loss is designed to limit a trader’s loss in the security position and to limit the losses if the trade doesn’t go as planned.
The traders monitor the market closely to ensure the trade is moving in the expected direction and avoid any false signals.
How Should Traders React to a Bullish Engulfing Candlestick?
Traders’ reaction to a bullish engulfing candle depends on whether they have a long or short position in the market. Most traders sell the stock in the bearish phase because the bearish phase occurs before a downtrend.
The bullish engulfing candle recommends traders to take a long position. It means that traders should acquire the stock and hold on to it, with the idea of selling it in the future at a higher price.
Since stock prices continue to rise after the candle, it is profitable for traders to buy the stock now. Traders can in fact, make the most profit by buying at the lowest intraday price on the second day of the candle.
The occurrence of a bullish candle cannot always guarantee an upward trend. Candle body is narrow when the difference between the opening and closing price of the red candle is insignificant. Sometimes, the trend reversal fails to occur even if the candle is engulfed by a green candle the following day. It is because the closing price of the green candle can be slightly higher than the opening price and still completely cover the preceding red candle.
In this case, the engulfing candle appeared due to minor fluctuations in the trading volume. For prices to rise steadily in the future, the closing price should be significantly higher than the opening price. Some traders prefer to wait for a day before deciding to go long to ensure a definite change in trend. Traders give up a day’s profits in exchange for a guarantee that the market trend has indeed changed.
Can RSI work well with the Bullish Engulfing Candlestick Pattern?
Yes, Relative Strength Index (RSI) and bullish engulfing patterns work well together. Both RSI and bullish engulfing patterns are used to recognize trend reversals. Some traders use RSI to confirm the strength of the bullish engulfing pattern.
What other Indicators work well with Bullish Engulfing Candlestick?
Bullish engulfing patterns work well with certain technical indicators like moving averages, volume, trendlines, etc to confirm trend reversals and identify trading opportunities.
- Moving averages: A moving average is a tool used by technical analysts to track the price movements of a security, to identify direction of a trend. The moving average is usually overlaid onto a candlestick, which depicts average prices over a specified time period. The price information for each period is displayed by these candlesticks.
- Volume:CandleVolume charts combine volume into candlesticks. This allows chartists to dissect both price action and volume with one look at the price chart..Increasing volume on the chart can confirm the strength of the bullish candlestick pattern.
- Trendlines: A traditional price action trading approach combines candlestick patterns with trend lines. Trend lines are used to identify trends. Drawing trendlines on a chart helps to identify support and resistance levels. A potential trend reversal can be seen in case a bullish candlestick pattern is formed near a trendline.
There are a variety of technical market indicators that are used with bullish engulfing patterns to make an informed decision and identify potential trading opportunities.
What are the benefits of the Bullish Engulfing Candlestick Pattern?
The bullish engulfing candlestick pattern has several benefits. The 4 major benefits are confirming trend reversal, providing potential entry and exit points, stop loss placement, identifying risk-reward ratio.
- Confirmation of the trend reversal: The bullish engulfing pattern is an indication of the potential trend reversal. It signifies that buyers are fully in control of the market following a previous bearish run.
- Potential entry and exit points: The pattern helps the traders to identify potential entry points to invest in stocks and exit points to sell them.
- Stop loss placement: The candlestick pattern also helps the investors to determine where to set stop loss levels, to limit the loss.
- Risk-reward ratio: The risk-reward ratio is applied by traders and investors to control their capital and risk of loss. Bullish engulfing candlesticks are used to determine potential risk-reward ratios for trades.
Bullish engulfing candlesticks is a beneficial trading strategy, yet it is not foolproof. It should be used with other technical analysis tools like moving averages, trendlines etc, to get detailed information.
What are the limitations of the Bullish Engulfing Candlestick Pattern?
The bullish engulfing patterns have major advantages, however, they are not completely reliable. There are 4 drawbacks of bullish engulfing patterns like false signals, challenging to determine the possible rewards, backtesting is required, and volume considerations.
- False signals: The engulfing pattern is not always accurate and can generate false signals.
- Challenging to determine possible rewards: Engulfing patterns can make it difficult to predict the potential payoff, because candlesticks don’t offer a price goal.
- Backtesting: It is important to backtest the bullish engulfing pattern before combining it into any other trading strategy.
- Volume considerations: Low volume during the occurrence of the pattern can reduce the reliability of the signal.
It is therefore important to consider the limitations of the pattern and manage the risk appropriately.
What is an Example of a Bullish Engulfing Candlestick Pattern?
Let’s imagine that Michael was looking at the candlestick chart of the XYZ stock to determine where to enter. The last two weeks had seen a decline in the stock’s price. He noticed a bullish engulfing candlestick pattern in the declining phase. He decided to wait one more day to check if the prices would continue to rise. He discovered that the bulls were in charge the following day. Therefore, at a price of $10 per unit, he bought 500 shares of company XYZ.
The stock’s price jumped further, and it was clear to him that the two-candlestick pattern at the bottom of the downtrend triggered the bullish reversal. Shortly after, he made a profit of $ 1500 by selling the stock at $ 13 per share.
Is Bullish Engulfing Candlestick Profitable?
Yes, Bullish Engulfing Candlestick Patterns is profitable when used in conjunction with other technical analysis tools and risk management strategies. The pattern itself is not a guarantee of profitability, as the market can always change direction unexpectedly.
Is Bullish Engulfing Candlestick a Double Candlestick Pattern?
Yes, the bullish engulfing candlestick is a double candlestick pattern because it contains two candlesticks, a bearish candlestick and the bullish candlestick. The bearish candlestick is completely engulfed by the bullish candlestick.
What is the difference between Bullish Engulfing Candlestick and Bearish Engulfing Candlestick?
Bullish engulfing candlestick pattern occurs when a small bearish candlestick is completely covered by a bullish candlestick indicating a trend reversal. This pattern implies that buyers have complete control in the market overpowering the sellers. Traders often see the occurrence of this pattern as an opportunity to enter a long position.

Bearish engulfing candlestick pattern occurs when a small bullish candlestick is followed by a larger bearish candlestick. The sellers over power the buyers in this pattern. Traders often enter a short position when this pattern occurs.


 Previous Article


![15 Investing.com Alternatives [Free+Paid] You Should Use in 2026](https://www.strike.money/wp-content/uploads/2026/04/Investing.com-Alternatives.jpg "15 Investing.com Alternatives [Free+Paid] You Should Use in 2026 40")
![15 TradeStation Alternatives [Free+Paid] You Should Use in 2026](https://www.strike.money/wp-content/uploads/2026/04/TradeStation-Alternatives.jpg "15 TradeStation Alternatives [Free+Paid] You Should Use in 2026 41")
![15 Chartink Alternatives [Free+Paid] You Should Use in 2026](https://www.strike.money/wp-content/uploads/2026/04/Chartlink-Alternatives.jpg "15 Chartink Alternatives [Free+Paid] You Should Use in 2026 42")


 : Definition, Formula, calculation, Uses, Advantages Vs limitations 46")


No Comments Yet.