Bull Put Ladder represents a sophisticated options strategy combining bullish sentiment with downside protection. Bull Put Ladder involves selling one at-the-money put option while buying two out-of-the-money put options at different strike prices. Traders deploy this approach to generate income while maintaining protection against significant market downturns.
The strategy evolved from traditional bull put spreads in the 1990s as options markets matured globally. Indian traders began widely adopting the strategy after NSE introduced weekly options.
Companies like Bharat Electronics Limited, Hindustan Aeronautics, and IRCTC frequently serve as underlying securities for this strategy due to their moderate volatility and strong fundamentals. The strategy performs optimally during periods of moderate bullishness in market sentiment while keeping downside protection intact.
What is a Bull Put Ladder?
Bull Put Ladder represents an advanced options strategy constructed with three put options at different strike prices to create a risk-defined position with unlimited profit potential. Bull Put Ladder combines elements of a bull put spread with an additional long put at a lower strike price.
The strategy involves simultaneously selling one at-the-money put option, buying one out-of-the-money put option, and buying another put option even further out-of-the-money. This specific structure creates a net credit position in most instances, meaning the trader receives premium upfront when establishing the trade.
The additional long put transforms the strategy from a simple bull put spread into a ladder structure, providing extra protection against significant market declines.
Traders implement this approach to express a moderately bullish view while maintaining defined risk parameters and keeping potential for substantial profits if the market moves significantly lower.
How Does a Bull Put Ladder Work?
Bull Put Ladder works through a specific combination of put options creating asymmetric profit potential with defined risk. Bull Put Ladder utilizes the premium received from selling an at-the-money put to offset the cost of purchasing two out-of-the-money put options at different strike prices.

The strategy requires executing three distinct options trades simultaneously.
- Selling one at-the-money put option generates premium income
- Buying one out-of-the-money put option provides initial downside protection
- Buying another further out-of-the-money put creates additional profit potential on sharp declines
This configuration typically results in a net credit position, meaning the trader collects premium upfront. The maximum loss occurs between the two long put strikes, creating a defined risk zone. Above the short put strike, the position profits as the options expire worthless. Below the lowest strike, profits increase as the market falls due to the extra long put.
The nuanced arrangement transforms risk-reward dynamics compared to simpler strategies. Traders often implement this structure on index options like Nifty or Bank Nifty to capitalize on directional views while maintaining protection against unexpected market reversals. The unique configuration provides flexibility across various market conditions.
Why Use a Bull Put Ladder Strategy?
Traders utilize the Bull Put Ladder strategy to generate immediate income while maintaining both upside profit potential and downside protection.
This advanced approach offers several advantages over basic options strategies. The initial credit received reduces the overall cost basis of the trade, potentially allowing profitable outcomes across a wider price range.
The strategy shines during volatile markets with an upward bias, offering income generation while preserving unlimited profit potential if prices rise significantly.
The additional long put at the lowest strike creates a unique benefit—protection against severe market declines. This distinguishes the ladder from a simple bull put spread, making it particularly valuable during uncertain market periods.
Traders frequently implement this strategy before major economic data releases or corporate events when volatility expectations run high.
The flexibility to profit in both strongly bullish and strongly bearish scenarios makes the ladder uniquely adaptive. The defined risk zone between the long put strikes establishes clear risk parameters.
Experienced options traders appreciate the strategy’s versatility when dealing with stocks showing significant momentum potential in either direction. The strategy offers superior capital efficiency compared to outright stock ownership while providing multiple paths to profitability.
When to Use a Bull Put Ladder?
Traders optimally deploy Bull Put Ladder strategies during moderately bullish market phases with potential for significant price movement in either direction. Below is a similar situation.

Market environments exhibiting specific characteristics create ideal conditions for this strategy. Periods preceding major corporate announcements, particularly earnings releases, present prime opportunities as implied volatility typically rises, enhancing the credit received.
The Indian options market frequently displays elevated implied volatility before quarterly results, creating advantageous entry points.
Technical breakout setups provide another excellent scenario for implementation. Stocks consolidating near support levels with potential for upside breakouts but uncertain short-term direction benefit from this approach. Sectors experiencing positive fundamental shifts while facing short-term headwinds present perfect candidates.
The strategy performs exceptionally during mid-volatility environments rather than extremely low or high volatility periods. Medium-duration trades spanning 15-30 days allow sufficient time for directional movement while minimizing time decay effects on the long options.
Companies in transformative industries like renewable energy or electric vehicles often present compelling setups for this strategy due to their enhanced movement potential.
Examining volatility term structures helps identify ideal entry timing, with slight volatility skews to the downside creating optimal conditions for establishing the position.
How Option Greeks Affects Bull Put Ladder?
Option Greeks significantly influence Bull Put Ladder performance through their combined impact on the three-legged position throughout its lifecycle.
Delta creates a predominantly bullish position at inception, with the short at-the-money put contributing negative delta while the two long puts add positive delta.
The net position maintains positive delta bias while the underlying trades above the short put strike, benefiting from upward price movement. This delta profile aligns perfectly with the strategy’s bullish orientation.
Gamma exposure proves particularly influential as expiration approaches. The position’s gamma remains positive overall, creating accelerated profitability during sharp price movements. This characteristic distinguishes the ladder from simpler strategies, providing enhanced responsiveness to significant market shifts.
Theta impact varies across the position lifecycle. Initially, theta works mildly in the trader’s favor as time decay affects the short put more significantly than the long puts. This advantage diminishes as expiration approaches, potentially turning negative in the final weeks.
Vega exposure creates mixed effects depending on strike selection and market conditions. Rising implied volatility benefits the long puts more than it hurts the short put, creating a net positive vega position in most configurations.
This provides valuable protection during market sell offs when volatility typically spikes.
The interplay between these Greeks requires careful monitoring throughout the trade duration, with adjustment thresholds established beforehand.
How Implied Volatility Affects Bull Put Ladder?
Implied volatility influences Bull Put Ladder profitability through its differential impact on the short and long put components across various market scenarios.
Moderate implied volatility environments create ideal entry conditions, providing sufficient premium on the short put while keeping long put costs reasonable. The strategy benefits from specific volatility conditions – slightly elevated implied volatility at entry followed by subsequent decreases.
Volatility skew dynamics play crucial roles in strike selection. Markets typically price downside puts with higher implied volatility compared to upside calls, creating advantageous entry opportunities for put ladder structures. Traders exploit these skews by positioning the short put at strikes where implied volatility appears relatively overpriced.
Post-event volatility contractions generally benefit the overall position through greater impact on the short put than the long puts. Rising implied volatility produces mixed effects – helping the long puts while hurting the short put. The net impact depends on position structuring and relative strike distances.
Volatility term structure analysis helps optimize trade entry timing. Examining volatility curves across different expirations reveals optimal positioning opportunities when near-term implied volatility exceeds longer-term readings.
Indian index options frequently display these characteristics before major market events, creating strategic advantages for well-timed ladder implementations.
How to Trade using Bull Put Ladder?
To trade using a Bear Put Ladder, the trader must be confident that the underlying asset—here, Nifty Bank—has the potential for a strong one-sided move on the downside.
This strategy performs poorly if the price consolidates or remains stagnant, as that would lead to a loss. The advantage of the Bear Put Ladder is that it involves two buying legs, which reduces the margin requirement and also helps protect against significant upside losses.

This dual protection makes the strategy relatively safer, especially if the price unexpectedly rises. Minor profits can still be earned even if the underlying closes above the short strike. However, for the strategy to be profitable, the price must not remain stuck in a narrow range.

To structure this trade, the trader identifies strike prices that are in-the-money (ITM), out-of-the-money (OTM), and farther OTM. In this example, a put is sold at ₹55,500 (ITM), while puts are bought at ₹54,700 (OTM) and ₹54,300 (farther OTM).

This combination creates a Bear Put Ladder. The premiums are ₹712 for the short put, ₹316 for the first long put, and ₹200 for the second long put. The net credit from this setup is ₹712 − ₹316 − ₹200 = ₹196.
With a lot size of 30, the total net credit becomes ₹196 × 30 = ₹5,880. This amount is the maximum profit if the underlying moves sharply downward and lands below the lowest strike.
Maximum loss occurs if the price remains between the first long put and the short put, i.e., between ₹54,700 and ₹55,500. This is calculated using the formula: (Short Put – First Long Put) – Net Credit.
In this case, it becomes (₹55,500 − ₹54,700) − ₹196 = ₹800 − ₹196 = ₹604 per unit. With a lot size of 30, the total maximum loss equals ₹604 × 30 = ₹18,120.
The breakeven levels help define the range within which the strategy neither makes nor loses money. The upper breakeven is the short put strike minus the net credit, which is ₹55,500 − ₹196 = ₹55,304.
The lower breakeven is calculated as the lowest strike minus the max profit per unit. This comes to ₹54,300 − ₹196 = ₹53,696. Thus, the breakeven range lies between ₹53,696 and ₹55,304.
What is the Maximum Profit & Loss, Breakeven on a Bull Put Ladder?
The Bull Put Ladder creates distinct profit and loss profiles with multiple breakeven points that vary based on strike selection and premium received.
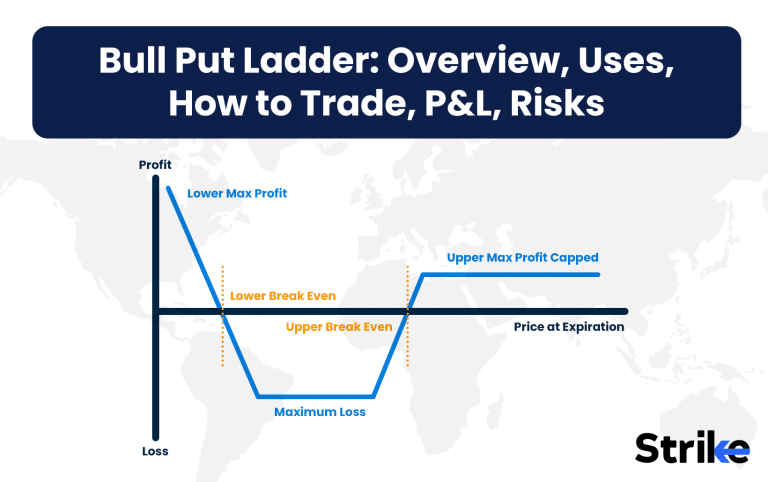
Maximum profit in this strategy comes in two forms – limited profit potential if the underlying closes above the short put strike at expiration and unlimited profit potential if the price falls significantly below the lowest long put strike.
Above the short put strike, all options expire worthless, allowing the trader to retain the entire initial net credit received. Below the lowest long put strike, the additional long put generates increasing profits as the underlying continues falling.
Maximum loss occurs between the two long put strikes, specifically at the first long put strike. This maximum loss equals the difference between the short put and first long put strikes, minus the net credit received. This creates a defined risk parameter for position sizing.
The strategy typically features two breakeven points. The upper breakeven equals the short put strike minus the net credit received. The lower breakeven involves a more complex calculation: short put strike minus distance between first two strikes plus distance between long put strikes minus net credit.
For example, with a 17,500 short put, 17,300 first long put, 17,000 second long put, and ₹70 net credit.

- Upper breakeven: 17,500 – 70 = 17,430
- Lower breakeven: 17,500 – 200 + 300 – 70 = 17,530
This configuration creates a risk-defined structure with multiple profit opportunities.
What are the Risks of Bull Put Ladder?
Bull Put Ladder contains several critical risk factors requiring careful management despite its defined-risk structure and favorable risk-reward characteristics.
Risk concentration emerges primarily between the two long put strikes, particularly near the first long put strike where maximum loss occurs. Sharp downward moves stopping precisely at this level create worst-case scenarios.
Liquidity risk impacts trade execution and management, especially for individual stock options rather than indices. Wider bid-ask spreads on the further OTM long put sometimes necessitate paying more than theoretical value, degrading overall position economics. This proves particularly relevant for mid and small-cap stocks with developing options markets.
Greek risks intensify as expiration approaches, especially gamma exposure near the short put strike. Rapid underlying price changes during this period dramatically alter position profitability before adjustment opportunities arise.
Vega exposure creates additional complexity during volatility spikes, with the position benefiting from some volatility increases while suffering from others depending on magnitude and timing.
Assignment risk emerges if the underlying trades near the short put strike near expiration. Early assignment, though rare in Indian markets, necessitates careful monitoring during the final trading week. Settlement discrepancies between options and underlying securities occasionally create unexpected outcomes during expiration processing.
Implementing proper position sizing mitigates these risks, typically limiting exposure to 3-5% of trading capital per position.
Is Bull Put Ladder Strategy Profitable?
Yes, the Bull Put Ladder strategy demonstrates profitability through multiple paths to positive returns across diverse market scenarios.
The strategy generates consistent profits in moderately bullish markets through premium decay of the short put option. Profitability extends to both strongly bullish markets (through complete premium retention) and strongly bearish markets (through appreciation of the lowest long put).
Is Bull Put Ladder Bullish or Bearish?
Bullish characterizes the primary directional bias of the bull put ladder, though with unique properties across different price ranges. The strategy profits most reliably from upward price movements that keep the underlying above the short put strike at expiration.
The position exhibits traditional bullish characteristics above the short put strike, neutral to bearish behavior between the first and second long puts, then returns to bullish sentiment below the lowest strike. This multi-directional profile creates an unusual risk-reward structure compared to simpler directional strategies.
The strategy delivers superior risk-adjusted returns compared to outright long stock positions during volatile bullish phases, explaining its popularity among sophisticated retail traders using platforms like Upstox and Angel One.
What are Alternatives to Bull Put Ladder Strategy?
The main alternative of bull put ladder strategy is bull put spread. Below are the explanation and more such strategies.
| Strategy | Key Differences | Best Used When |
| Bull Put Spread | Simpler with two legs, capped profit & loss, lower margin | Moderately bullish with limited volatility expected |
| Call Ratio Backspread | Uses calls instead of puts, unlimited upside, debit structure | Strongly bullish with rising volatility expected |
| Put Ratio Spread | Bearish bias, short multiple puts against one long put | Moderately bearish with falling volatility |
| Iron Condor | Four-legged neutral strategy, profits in range-bound markets | Expecting minimal price movement with high IV |
The selection depends primarily on expected price movement magnitude, direction, and anticipated changes in implied volatility.


 Previous Article


![15 Investing.com Alternatives [Free+Paid] You Should Use in 2026](https://www.strike.money/wp-content/uploads/2026/04/Investing.com-Alternatives.jpg "15 Investing.com Alternatives [Free+Paid] You Should Use in 2026 28")
![15 TradeStation Alternatives [Free+Paid] You Should Use in 2026](https://www.strike.money/wp-content/uploads/2026/04/TradeStation-Alternatives.jpg "15 TradeStation Alternatives [Free+Paid] You Should Use in 2026 29")
![15 Chartink Alternatives [Free+Paid] You Should Use in 2026](https://www.strike.money/wp-content/uploads/2026/04/Chartlink-Alternatives.jpg "15 Chartink Alternatives [Free+Paid] You Should Use in 2026 30")
: Overview, 10 Types of Indicators, Settings for Different Markets 32")

 : Definition, Formula, calculation, Uses, Advantages Vs limitations 34")


No Comments Yet.