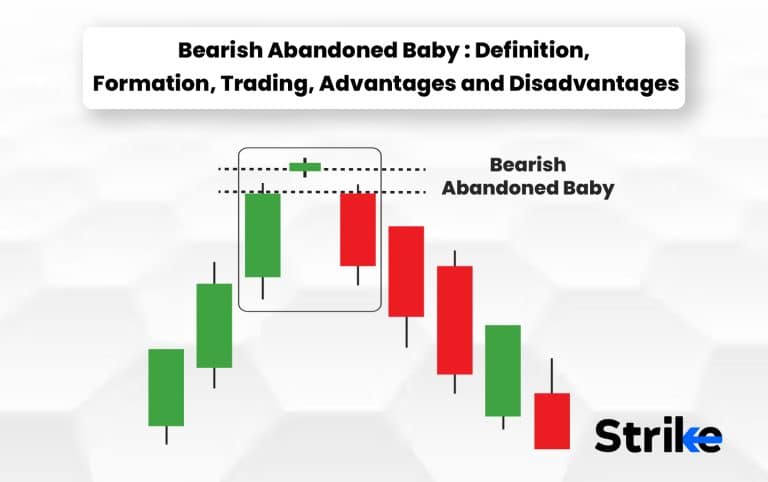
Bearish Abandoned Baby is a type of candlestick pattern consisting of three candles, one with rising prices, a second with holding prices, and a third with falling prices. A Bearish Abandoned Baby is a rare pattern that has a reasonably strong track record for forecasting a short term downward trend. The first candlestick is a large bullish candle that is followed by a Doji candle that gaps up.
The key item of the bearish abandoned baby is the middle day, which should have a gap in front of it and which closes the session with price unchanged. The bearish abandoned baby pattern indicates reversal to the downtrend and is used by the traders to exit a buy position and enter a short position. Traders expect that the price will continue to move down and bears are back into action after the formation of this pattern. The doji candle becomes a significant signal for traders and technical analysts attempting to identify a bearish reversal of a bullish trend in this pattern.
Traders who observe this pattern interpret it as a bearish signal and consider taking short positions in the market. The bearish abandoned baby pattern gets its name from the fact that the Doji candlestick is “abandoned’’ between the two large bullish and bearish candlesticks, which are like the “parents’’ of the doji.The pattern suggests that the buying pressure from the first candlestick was followed by a period of indecision and then selling pressure, resulting in a bearish reversal.
The bearish abandoned baby pattern have some advantages including, giving early warning signs that a bullish trend will come to an end, providing confirmation that a trend reversal is taking place, giving potential profit opportunity to the traders, and the traders can manage their risk more effectively. There are also disadvantages to consider even though the bearish abandoned baby pattern is very useful.
Limited timeframes and emotional biases are the main two disadvantages of bearish abandoned baby patterns. The pattern is also not 100% accurate at times when the pattern appears but the trend does not actually reverse. This will lead to false signals and losses for traders. The bearish abandoned baby pattern is open to subjective interpretation.
What is the Bearish Abandoned Baby Candlestick Pattern ?
The bearish abandoned baby candlestick pattern is a three candlestick pattern that appears on a chart and is considered as a bearish reverse signal. The first candle is a long white candlestick which represents a bullish market trend. The second candle is a doji which indicates indecision in the market. The third candle is a long black candlestick which represents a bearish market trend.

The pattern begins with a long bullish candlestick which is formed by a small doji candlestick that gaps up from the first candle. The doji candlestick represents indecision in the market as the opening and closing prices are very close to each other and the candlestick has a small or no real body. The pattern is completed by a third long bearish candlestick that gaps down from the second candle. The gap down from the second candlestick is important, as it informs that the bears have taken control and are likely to push prices lower.
The triple candlestick pattern signals a shift in sentiment from bullish to bearish and is seen as a strong signal for traders to sell or short the asset being traded. Traders should always consider other technical indicators and market conditions before making any trading decisions. Traders interpret this pattern as a signal to sell their positions or to open short positions.
The price trends lower over the next 20 days about 65% of the time, with a median return of -3.00% when this pattern occurs. The pattern is called “abandoned baby” because the doji candlestick appears to be isolated or “abandoned” between two candles.
What traits define the Bearish Abandoned Baby pattern ?
The bearish abandoned baby pattern is a three candlestick pattern that usually appears at the end of an uptrend and signals a potential reversal to a downtrend. The pattern is defined by three traits:
- The first candlestick is a long white candlestick, indicating a strong uptrend.
- The second candlestick is a doji, which represents indecision in the market. The doji opens and closes at or near the same price levels, but it will have a long upper or lower shadow.
- The third candlestick is a long black candlestick, indicating a strong downtrend. The black candlestick opens below the previous day’s doji and closes well into the white candestick’s real body.
The pattern suggests that the bulls or buyers are losing control, and the bears or sellers are taking over, as signaled by the long black candlestick. The doji represents a period of indecision and uncertainty caused by the market’s reaction to news or events that create doubt about the previous trend’s sustainability.
It is viewed as a bearish signal when the pattern appears indicating that the market is likely to move lower in the near future. Traders and investors use this pattern to help them make trading decisions, such as selling long positions or entering short positions in anticipation of a downward move.
How is Bearish Abandoned Baby Candlestick Formed ?
A bearish abandoned baby is a signal for a downward reversal trend in the price of a security. This pattern is formed when a doji like candle is preceded by a gap between its lowest price and that of the previous candlestick. The previous candlestick is a tall white candlestick with small shadows. The doji is followed by a gap between its lowest price and the highest price of the next candle.
The doji candle becomes an important signal for traders and technical analysts seeking to identify a bearish reversal of a bullish trend in the tall red candlestick. The volume of trading activity during the formation of the bearish abandoned baby pattern can provide additional context. A high volume during the pattern formation can indicate a strong bearish sentiment, while a low volume can indicate a lack of conviction among traders.

The white candlestick shown in the graphics above occurs when a security’s price closes higher than its open. This type of candlestick is white or green on a trading chart. The red or black candlestick shown in the above graphics occurs when a security’s price closes lower than its open. A doji candlestick occurs when a security has the same open and closing price. This will be represented by some form of a plus sign on a trading chart, or a dash with a vertical line moving away from the dash.
Together these three candlesticks suggest that the market is going through a period of indecision but that the sellers are ultimately winning out over the buyers. This is because traders are losing confidence in the uptrend and are beginning to sell off their positions. Therefore the bearish abandoned baby pattern signals that the market will turn bearish.
What does Bearish Abandoned Baby Candlestick tell ?
The bearish abandoned baby candlestick predicts a reversal of the downward trend and is used as a signal to exit a long position and sell the securities by traders and analysts. It is both profitable and reliable for identifying a major trend reversal. The pattern needs to be confirmed either by breaking the trendline or the nearest trend zone. The first and last candlestick ought to be significantly large to complete the pattern.
The bearish abandoned baby candlestick remains invalid when the third candlestick does not send the price lower than the half body of the first candle. The bearish abandoned baby pattern appears very rarely on the charts hence its practical application is rather low and it appears only about 50 times over the past two decades.
It is essential to note that the bearish abandoned baby pattern is not a standalone trading signal and should be used with other technical and fundamental analysis tools. As with any trading strategy, conducting thorough research and implementing risk management techniques is essential to ensure success.
What does the color of the Bearish Abandoned Baby Candlestick mean ?
The color of a bearish abandoned baby candlestick is black or red indicating a bearish trend in the market. It is the tallest candle with shadows. The pattern has three candlesticks. The first is a green candle.
The second candle, the abandoned baby is also green whose opening and closing prices are above the first candle. A close below an open indicates bearish market sentiment. This is denoted by a red candle and is called a bear candle.
When does Bearish Abandoned Baby Candlestick happen ?
The bearish abandoned baby candlestick pattern occurs at the end of an uptrend.A bearish abandoned baby is a signal for a downward reversal trend in the price of a security. The pattern begins with a long bullish candlestick, followed by a doji candlestick that gaps up above the previous day’s close. A long bearish candlestick gaps down from the doji finally , creating a pattern that looks like a baby being left alone after a bullish trend, only to be abandoned by a sudden bearish reversal.

This pattern is formed when a doji like candle is predated by a gap between its lowest price and that of the previous candlestick. The previous candlestick is a tall white candlestick with small shadows.This pattern is considered a strong signal of a potential trend reversal, as it suggests that bullish momentum has been exhausted and bearish traders are taking control of the market. Traders use it as a trigger to enter short positions or close out long positions.
How important is the color of the Bearish Abandoned Baby Candlestick ?
The color of a bearish abandoned baby candlestick is important in interpreting which means the color of the long bullish candlestick and the long bearish candlestick in the pattern can provide some additional context. A bearish abandoned baby with a red or black bearish candlestick is more significant than one with a green or white bearish candlestick because the former indicates more selling pressure.
The color of a bearish abandoned baby candlestick is important insofar as it provides additional information about the market trend. But it’s worth noting that the color of the candlestick alone is not enough to determine the significance of the pattern. Other technical indicators and market factors such as volume, momentum, support and resistance levels should be analyzed to confirm the potential trend reversal and make informed trading decisions.
How often does Bearish Abandoned Baby Candlestick occur?
The bearish abandoned baby candlestick pattern does not occur very frequently compared to other candlestick patterns.
How to read Bearish Abandoned Baby Candlestick in Technical Analysis ?
The bearish abandoned baby candlestick pattern is a three candlestick pattern that indicates a potential reversal from an uptrend to a downtrend. There are mainly 3 steps to read the candlestick.
- The first candlestick in the pattern is a long bullish candlestick that signals a strong buying trend.
- The second candlestick is a small doji candlestick which indicates that the buying pressure is weakening and there is indecision in the market.
- The third candlestick is a long bearish candlestick that opens below the previous day;s low and closes below the low of the first candlestick signaling a strong selling trend and a reversal from the previous uptrend.
The pattern is complete when the third candlestick closes below the low of the first candlestick. This indicates that the bears have taken control of the market and the uptrend is reversing. The confirmation of the bearish abandoned baby pattern occurs when the third candlestick closes below the low of the first candlestick.
The larger the bearish candlestick, the stronger the reversal signal. During technical analysis this pattern indicates at least a short term reversal in a currently upward trending price.
How accurate are the Bearish Abandoned Baby Candlestick in Technical Analysis ?
The bearish abandoned baby pattern is known to be a reliable and effective tool in identifying potential trend reversals. The accuracy of this pattern depends on the market conditions, the time frame of the chart being analyzed, and other technical indicators being used in conjunction with the pattern.
The pattern was a reliable indicator of reversals at both short term and long term horizons. Like all other technical analysis tools, the bearish abandoned baby candlestick is not always 100% accurate. The accuracy of any technical analysis tool depends on the skill and experience of the trader in interpreting and using it.
When is the best time to Trade using Bearish Abandoned Baby Candlestick ?
Bearish Abandoned Baby is a candlestick pattern that is considered a strong bearish reversal signal. The best time to trade using the bearish abandoned baby pattern is when it occurs after a prolonged uptrend, as this suggests that the bullish momentum will be weakening and that the beers are gaining control.
Traders can use this pattern to enter short positions or to exit long positions, as it indicates a potential trend reversal. Traders normally wait for the pattern to be confirmed by a bearish candlestick closing below the first candle’s open. This can indicate a potential trend reversal and provide a sell signal for traders who are long in the market.
Traders who use candlestick patterns, including the Bearish Abandoned Baby often use them in unification with other technical indicators such as moving averages, momentum indicators, or trendlines to make trading decisions.
How to Trade with Bearish Abandoned Baby Candlestick in Stock Market ?
Trading the bearish abandoned baby pattern mainly involves 6 steps:
- Identify the pattern: Look for the bearish abandoned baby pattern on the daily or weekly chart of a stock. It consists of three candles so that the pattern is easy to identify.
- Confirm the pattern: Confirm that the pattern has formed by ensuring that the second candle is a doji, which means the opening and closing prices are the same.
- Enter a short position: Trader would wait for the third candlestick to close below the previous day’s close and then sell the stock or asset to take a short position in this pattern.
- Set a stop loss: A stop loss in trading is an essential tool of the bearish abandoned baby pattern should be placed above the high of the third black candlestick. These steps help to limit potential losses. The price was to move above the high of the third candlestick indicating that the bears have lost control and the pattern will no longer be valid. So it is important to set a stop loss.
- Set a profit target: Setting a profit target is an important part of any trading strategy as it helps traders to define their goals and take profits at a predetermined level. A trader should place the profit target just above the support level at a level that is acceptable in terms of risk reward. This level should reflect desired profit and should be based on your trading plan.
- Monitor the trade: Monitoring a trade in bearish abandoned baby pattern is essential for traders to manage their risk and make informed decisions. Monitoring the price action is an important step in this level. Once a trader enters the trade keep an eye on the price action. Make sure they are reasonable and align with the risk reward ratio.
Based on the trader’s trading style should decide to enter the market at the current market price (CMP), set a limit order, ora stop order. A trader should hold onto your position when the price continues to decline. And want to consider closing positions to limit losses when the price starts to rise. It’s essential to note that the bearish abandoned baby pattern is not always reliable, and to confirm it with other technical indicators and fundamental analysis.
Where does the Bearish Abandoned Baby commonly used ?
The bearish abandoned baby pattern is commonly used in technical analysis which is applied to financial markets such as stocks, currencies, commodities and indices. This pattern is used by traders and investors to identify potential trend reversals and to make buying or selling decisions. It is a three day pattern that occurs at the top of an uptrend and signals a possible trend reversal to the downside.
Traders use this pattern to make trading decisions and take advantage of potential price movements that occur after the pattern formation. The pattern helps to identify potential selling opportunities and to place stop-loss orders to limit potential losses. The bearish abandoned baby pattern is used in conjunction with other technical analysis tools such as trendlines, support and resistance levels and other candlestick patterns to confirm the validity of the signal and increase the probability of making profitable trades.
Is the Bearish Abandoned Baby in an Uptrend a Sell Signal ?
Yes, the bearish abandoned baby pattern in an uptrend is considered as a sell signal by traders and technical analysts. This pattern occurs in an uptrend, it suggests that the bullish trend will be running out of steam and that a bearish reversal will be imminent. Traders use this pattern as a signal to sell their long positions or open short position to take advantage of the expected downtrend.
What are the advantages of Bearish Abandoned Baby Candlestick Pattern ?
The bearish abandoned baby candlestick pattern is the rarest candlesticks to appear on a price chart and has a history of forecasting a short term downtrend. The pattern was a reliable indicator of reversals at both short term and long term horizons. This indicates that this pattern is a useful tool for traders looking to identify potential reversals in the stock market. The main advantage of the pattern is that it is a very early warning sign that a bullish trend is coming to an end.
Traders who are able to recognize the pattern and act on it quickly is able to exit long positions before the prices start to fall significantly. The bearish abandoned baby pattern is considered to be a highly reliable pattern, especially when it appears after a prolonged uptrend. This is because it signifies a sudden shift in market sentiment and a potential reversal of the trend. The pattern is comparatively easy to recognize, even for traders who are a beginner.
The pattern is distinct and is identified with a faster visual inspection of a price chart. Traders who are able to identify the bearish abandoned baby pattern and act on it by opening short positions is able to profit from the subsequent decline in prices. This is particularly profitable trade, the trend reversal is significant and prices fall sharply. The bearish abandoned baby pattern is a powerful tool for traders to identify potential bearish reversals in the market and take advantage of them to make profitable trades.
What are the disadvantages of Bearish Abandoned Baby Candlestick ?
The bearish abandoned baby pattern has certain risks and limitations that traders should be aware of when using it as a trading signal like any other candlestick pattern. The pattern can give false signals in some cases. It looks like a bearish abandoned baby but it will not lead to a bearish reversal. This will lead to unsuccessful trades when the market does not follow the expected trend.
Traders should consider using additional technical indicators and fundamental analysis to confirm the pattern’s validity to mitigate this. Traders should not solely rely on the bearish abandoned baby candlestick pattern to make trading decisions. It requires confirmation from other technical indicators or chart patterns is necessary to increase the likelihood of a successful trade. Although the bearish abandoned baby pattern is a popular reversal pattern, it is not always reliable. Market conditions, news events, and other factors can influence the price action and invalidate the pattern.
The pattern is relatively rare and does not frequently appear on charts, which can limit its usefulness as a trading signal. As such traders cannot always rely on its formation to identify potential bearish runs. The pattern signals a trend reversal but it does not specify when the reversal will occur. Traders must exercise caution and wait for confirmation before entering a trade based on this pattern. Although the bearish abandoned baby candlestick pattern is a useful tool for traders, but it should be used in conjunction with other technical analysis tools and strategies to increase the likelihood of a successful trade.
What is the opposite of Bearish Abandoned Baby Candlestick ?
The opposite of a bearish abandoned baby candlestick is a bullish abandoned baby candlestick pattern. A bearish abandoned baby pattern is a bearish reversal pattern and a bullish abandoned baby pattern is a bullish reversal pattern. A bullish abandoned baby pattern forms during a downtrend and is characterized by a long red candlestick followed by a doji candlestick which has a very small real body and gaps down to open below the previous candlestick’s low.
This gap down creates a separation between the previous trend and the new trend signaling that bears have lost control and bulls have taken over. This pattern indicates a bullish reversal with buyers gaining control and pushing the price higher. The bullish abandoned baby candlestick pattern acts strictly opposite of the bearish abandoned baby candlestick pattern.
What are the other types of Doji Candlestick patterns besides Bearish Abandoned Baby ?
There are mainly 5 other types of doji candlestick pattern besides bearish abandoned baby.They are:
- Neutral doji: This pattern occurs when the opening and closing prices are very close to each other and the candlestick has a very small or nonexistent body. A neutral doji can indicate indecision in the market, with neither buyers nor sellers having a clear advantage.
- Gravestone Doji: The Gravestone doji occurs at the top of an uptrend and shows a reversal to the downside. It consists of a long bullish candle, followed by a doji that opens and closes at or near its low that indicates indecision and then a long bearish candle that closes below the midpoint of the previous bullish candle.
- Dragonfly Doji: This doji pattern occurs at the bottom of a downtrend and presents a reversal to the upside. The pattern consists of a long bearish candle followed by a doji that opens and closes at or near its high signaling indecision and then a long bullish candle that closes above the midpoint of the previous bearish candle.
- Long-Legged Doji: This is a doji pattern with long upper and lower shadows. It signals that there was a lot of indecisions and volatility during the trading session.
- Four price Doji: This is a rare doji pattern where the open, high, low and close prices are all the same. The pattern indicates that there is indecision in the market and the trade will be about to reverse.
Doji candlesticks are candlestick patterns that occur when the opening and closing prices of an asset are very close resulting in a very small real body. It is important that these patterns should be confirmed by other technical indicators before making trading decisions.
What Candlestick Pattern is Similar to Bearish Abandoned Baby Candlestick?
A similar bearish reversal pattern to the bearish abandoned baby is the bearish evening star pattern. This pattern also occurs at the top of an uptrend and consists of a long bullish candlestick followed by a small candlestick, which is doji, spinning top, or a small bullish or bearish candlestick, and then a long bearish candlestick with a gap down from the previous candlestick.
The evening star pattern also suggests a shift in market sentiment from bullish to bearish. The two patterns are similar in terms of their overall shape and the bearish reversal signal they provide. But the difference lies in the second candlestick. The second candlestick is a doji or spinning top in the bearish abandoned baby pattern and it is a variety of candlestick shapes in the evening star pattern.
Can the Bearish Abandoned Baby pattern be used with Elliott Wave Theory or other advanced technical analysis techniques ?
Yes, the bearish abandoned baby pattern is used in concurrence with Elliott wave theory and also other advanced technical analysis techniques. The pattern is used as a confirmation of a possible top in the market based on the Elliott wave theory. The pattern appears at the end of a fifth wave of an impulse wave; it is a sign that a correction is likely to occur as an example for the bearish abandoned baby pattern to be used with elliott wave theory.
A trader with Elliott wave interpretation has a long term bearish outlook with a short term bullish outlook. Other advanced technical analysis techniques such as Fibonacci retracement and extensions also be used in conjunction with the abandoned baby pattern to identify the price levels for a reversal.
Is the pattern of the Bearish Abandoned Baby a bullish reversal ?
No, the bearish abandoned baby pattern is not a bullish reversal pattern. It is a bearish reversal pattern that appears at the top of an uptrend. The first candlestick indicates that the buyers are in control and the second indicates indecision in the market and the third indicates that the sellers have taken control and are pushing prices lower.
This pattern suggests a sudden shift in marketing sentiment from bullish to bearish and traders will interpret it as a signal to sell or take profits. Therefore the bearish abandoned baby is a bearish reversal pattern and not a bullish reversal pattern.
What is the difference between a Bearish Abandoned Baby and a Bullish Abandoned Baby ?

The major difference between bearish and bullish abandoned babies is the direction of the trend they signal. The bearish abandoned baby occurs at the end of an uptrend and indicates a reversal to a downtrend. The pattern consists of a long white candlestick, followed by a doji candlestick that gaps up from the first candle, and then a long black candlestick that gaps down from the doji.
The bullish abandoned baby occurs at the end of a downtrend and signals a reversal to an uptrend. This pattern also consists of a long black candlestick followed by a doji candlestick that gaps down from the first candle and then a long white candlestick that gaps up from the doji. But both the patterns are considered to be strong reversal signals.


 Previous Article


![15 Investing.com Alternatives [Free+Paid] You Should Use in 2026](https://www.strike.money/wp-content/uploads/2026/04/Investing.com-Alternatives.jpg "15 Investing.com Alternatives [Free+Paid] You Should Use in 2026 28")
![15 TradeStation Alternatives [Free+Paid] You Should Use in 2026](https://www.strike.money/wp-content/uploads/2026/04/TradeStation-Alternatives.jpg "15 TradeStation Alternatives [Free+Paid] You Should Use in 2026 29")
![15 Chartink Alternatives [Free+Paid] You Should Use in 2026](https://www.strike.money/wp-content/uploads/2026/04/Chartlink-Alternatives.jpg "15 Chartink Alternatives [Free+Paid] You Should Use in 2026 30")
: Overview, 10 Types of Indicators, Settings for Different Markets 31")


 : Definition, Formula, calculation, Uses, Advantages Vs limitations 34")


No Comments Yet.