Hammer Candlestick serves as a key tool for traders to identify potential shifts in market momentum and buying interest. Hammer Candlestick highlights moments when sellers lose control and buyers assert influence, providing a clear visual of market psychology.
Traders use it to refine entry timing, set precise risk levels, and confirm setups when aligned with support zones, trend structure, and volume, making it an effective instrument for strategic decision-making rather than a standalone signal.
What is a Hammer Candlestick?
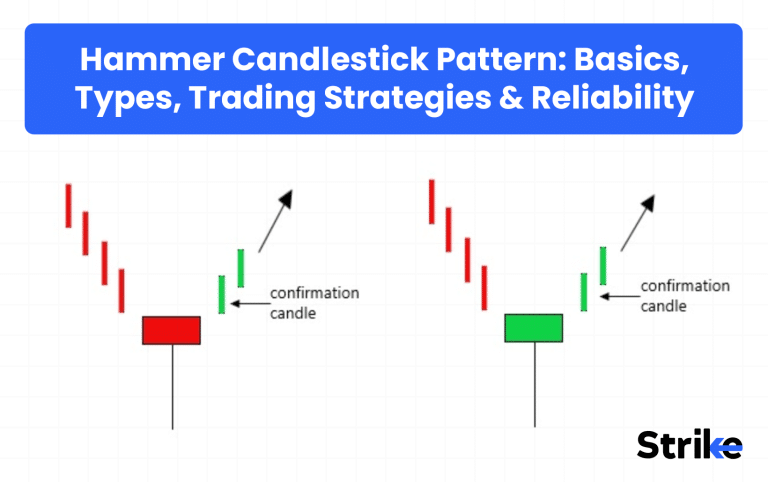
Hammer Candlestick pattern is a single-candle bullish reversal pattern in technical analysis which indicates exhaustion of selling pressure and initiation of buying pressure. The Hammer Candlestick pattern typically appears at the end of the downtrend and resembles the shape of a hammer.

What Does the Hammer Candlestick Indicate?
Hammer Candlestick indicates a potential bullish reversal after a downtrend, where initial sellers control is now being controlled by buyers. This shift suggests the weakening of bearish momentum and initiation of buying momentum.
Let’s understand this psychological shift using the structure of Hammer Candlestick. The Hammer candlestick has a very specific structure that reflects rejection of lower prices, resembling the shape of a hammer.

- Small real body: Located near the top of the candle’s range, showing that the price closed near its opening.
- Long lower shadow (wick): At least 2-3 times the length of the real body, indicating a strong buying interest after a sharp selling pressure.
- Little or no upper shadow: Shows that buyers maintained control till the close.
Psychologically, the long lower wick indicates that sellers were in control early, pushing the prices downwards. However, buyers intervened at lower levels, absorbed the selling pressure and restored prices to their previous highs. This reflects the failed selling pressure and new buyer dominance, signalling early accumulation.
How to Identify a Valid Hammer Candlestick Pattern
To identify a valid Hammer Candlestick pattern, the structure must align with the right market context mentioned below.
- Appears after a declining trend: A Hammer is meaningful only when it forms after a clear downtrend or market correction. Without prior weakness or downtrend, Hammer loses its significance.
- Lower wick at least 2-3 times the body: This long lower shadow indicates a big rejection of lower prices and strong buying from the lows.
- Small real body near the candle’s high: This close near the top indicates that the buyers re-took control at the end of the session.
- Little or no upper shadow: This is a confirmation that there was no selling pressure on the price after the recovery.
The Hammer is an indication of trend exhaustion rather than a trend creation. It works best near support zones, areas of demand or oversold condition.
Does the Color of a Hammer Candlestick Matter?
No, the colour of a Hammer Candlestick does not significantly matter for its validity. What matters most is the structure and the location of the candle. However, a green Hammer Candlestick is slightly more bullish than red one, as it has closed above the opening price. A red Hammer still remains valid if the structure and trend context are correct.

Types of Hammer Candlestick Patterns
The Hammer Candlestick pattern primarily has two major types based on market context. The types are Bullish Hammer Candlestick pattern and Bearish Hammer Candlestick pattern.
Bullish Hammer Candlestick Pattern

Forms at the end of a downtrend with a small body near the high and long lower shadow (2-3x body length), signaling seller exhaustion and potential upward reversal. Buyers reject lows aggressively, ideal for call options in Nifty downtrends.
Bearish Hammer (Hanging Man)
Appears after an uptrend with identical structure, but indicates weakening bulls as sellers test lows successfully, hinting at downward reversal. Confirmation via the next red candle is crucial for short positions.

Although both patterns look structurally the same, the meaning of the Hanging Man depends entirely on the prior trend.
When does the Hammer Candlestick Pattern Occur?
The Hammer candlestick pattern occurs after sustained selling pressures, where the market has been continuing to fall. It usually occurs around critical areas of support including past swing bottoms, demand areas, trendline support or moving averages.
With a hammer, the hammer occurs most often following several consecutive bearish candles, in oversold markets (i.e. RSI below 30-40) or unusual above-average volume. The hammer does not have any previous downtrend or support structure and therefore is no longer relevant as a reversal signal but must be considered a neutral candle.
How Often does the Hammer Candlestick Pattern Happen?
The Hammer Candlestick pattern appears frequently on the chart, but the reliable Hammer pattern statistically appears less frequently. On daily charts of actively traded stocks or indices, Hammer pattern appears 8–12% of all candles. After applying a right market context to identify Hammer pattern, the frequency of Hammer Candlestick drops to 3-5%.
Based on the timeframe, Hammer pattern appears once in 2-4 weeks on daily timeframe, whereas, on weekly timeframe, it appears every 2-4 years.
How do you Trade with a Hammer Candlestick Pattern in the Stock Market? [With Example]
There are five major steps to trade with the Hammer candlestick pattern in the stock market. The steps include recognizing the appropriate market situation, validating Hammer structure, entry, target and stoploss.
Step 1: Recognize the Appropriate Market Situation.
Look for Hammer in a clear downtrend or a sharp correction, ideally around important areas of support, such as past lows, trend lines or key moving averages. Avoid sideways markets or low-volume markets.

As the above chart shows, Dixon Technology is in uptrend, trading above 50 and 200 EMA. Stock took a pullback and formed a Hammer pattern near 50 EMA forming the possible higher low.
Step 2: Hammer Structure validation.
Make sure that the candle includes a small real body at the high, and long lower shadow (at least 2-3 times a body), which demonstrates a strong rejection of the lower prices.

As we can see, Dixon took support from 50 EMA and formed a hammer with a small body near top and lower wick two times longer than body size.
Step 3: Entry
Enter long position once the high of the Hammer candle is taken out
If confirmation is met, enter the long position break of the high of the Hammer candle.

Step 4: Target
Set a target for the nearest level of resistance, moving averages or try to achieve a minimum ratio of1;2 risk-reward.
Step 5: Stop-Loss
Stop-loss should be placed below the low of the hammer, offering a logical and easy-to-understand risk limit—something every Stock Market trader should follow for disciplined risk management.
Intraday Trading with Hammer Pattern
Intraday trading with a hammer pattern involves capturing a short-term bullish reversal after a sharp sell within the same session. Effectiveness of intraday hammer depends on location and immediate follow-through, as intraday price action is fast and noisy. This is suitable only for quick mean-reversion moves.
| Factor | Details |
| Timeframe | 5-min, 15-min |
| Best Location | VWAP, day’s low |
| Entry | Break above hammer high |
| Stop-Loss | Hammer low |
| Target | VWAP or nearby resistance |
| Holding | Same day |
Hammer trades only work intraday when they occur fast with confirmation, and the risk is carefully managed; otherwise, procrastination or overtrading is likely to ruin the advantage.
Swing Trading & Positional Trading with Hammer
For swing and positional trading, the Hammer indicates a possible trend reversal or the end of the correction after the long term downward pressure. At broader time scales, Hammer captures structural shifts in demand, and is more predictable and appropriate to traders of larger risk reward changes.
| Factor | Details |
| Timeframe | Daily, Weekly |
| Best Location | Major support, trendline |
| Entry | Close above hammer high |
| Stop-Loss | Below hammer low |
| Target | Prior swing high |
| Holding | Days to weeks |
In swing and positional setups, the hammer offers a low-risk entry near demand, allowing traders to participate in sustained moves with patience and discipline.
Forex Trading with Hammer Pattern
The Hammer in forex markets indicates institutional buying absorption at the important price levels. Since forex is open twenty-four-hour, the pattern can only be useful when it is conducted during high-liquid sessions and when they are in alignment with the larger structure of the market.
| Factor | Details |
| Timeframe | 15-min, 1-hr, 4-hr |
| Best Location | Support, range lows |
| Entry | Break & close above hammer high |
| Stop-Loss | Below hammer low |
| Target | Nearest resistance |
| Holding | Hours to days |
In forex trading, the hammer works best as a confirmation of support, not as an independent trade trigger.
Best Market Conditions for the Trading Hammer Pattern
The best market condition to trade the Hammer candlestick pattern involves downtrending markets, oversold markets and markets near the support zone.
- Sustained Downtrend: After clear lower lows and lower highs or after a 5-10% correction, signaling exhaustion.
- Support Zones: Support Zone, such as trendline support, moving averages (50/200-day), Fibonacci retracements, or prior lows are best areas to trade Hammer Candlestick pattern.
- Oversold Momentum: Stock forming Hammer at RSI below 30 or oversold zone confirming buyer entry.
Elevated volume on the Hammer candle validates buying pressure. Avoid ranging or uptrending markets. In Indian indices like Nifty, it excels during post-correction phases on daily/4H charts.
How Reliable Is the Hammer Candlestick Pattern in Technical Analysis?
The Hammer Candlestick pattern is moderately reliable on its own, but its effectiveness increases when used with proper market context. The reliability of Hammer Candlestick pattern is around 45-50% without market confirmation or context. Under the right market context the probability of success increases to 60-70%.
However, the reliability of the Hammer candlestick pattern also depends on the trading timeframe. Higher timeframes, such as daily or weekly, are typically more reliable, while shorter timeframes can produce more false signals due to short-term market noise—an important point in Technical Analysis.
Is Hammer Candlestick Pattern Profitable?
Yes, the Hammer Candlestick pattern is profitable only when used with the right market context and confirmation. Although the Hammer candlestick may appear anywhere on the chart, its presence alone is not a buy signal, it is just an indication of selling exhaustion and emerging demand.
Barry D. Moore, CFTe, says that the Hammer candlestick pattern alone does not provide much statistical advantage. Long term tests on potential components of the DJIA have a win rate of only 52.1% and average profit of only 0.18% per trade with a holding period of 10 days. More importantly, the strategy has a negative Sharpe ratio of -0.05 which shows poor risk adjusted returns and high volatility.
According to Thomas Bulkowski’s Encyclopedia of Candlestick Charts, the hammer pattern shows a 60.3% success rate in bullish reversals when confirmed by a breakout above the high.
How to Backtest Hammer Candlestick Pattern?
There are five major steps to backtest the success rate of Hanging Man. The steps are
1. Rules Definition
Start by defining the exact criteria for identifying a Hanging Man.
- Candle structure: Candles should have a small real body at the top of the candle with a long lower shadow at least 2× the body size and very small or no upper shadow.
- Context: It must appear after a downtrend (e.g., previous 3–5 candles bearish).
- Confirmation rule: Next candle must close below the Hanging Man high to trigger a buy signal. With stop loss below Hammer pattern and take profit of 2R or trailing stop.
2. Datasets & Tools
Use backtesting platforms or coding tools suited for historical data testing:
- TradingView Pine Script: Easiest for visual strategy creation and forward validation.
- Python (pandas + Backtrader): For professional quantitative backtesting with custom rules and metrics.
- Amibroker: For fast historical scans and large dataset backtests.
You’ll need OHLCV data for your target asset (e.g., stocks, forex, crypto) across multiple timeframes.
3. Metrics to Report
After running the backtest, focus on key performance metrics to gauge pattern effectiveness:
- Win rate (%): Proportion of profitable trades.
- Average win/loss: Mean gain vs. mean loss per trade.
- Profit factor: Ratio of gross profit to gross loss (above 1.5 is solid).
- Expectancy: Average expected return per trade = (Win% × Avg Win) – (Loss% × Avg Loss).
- Max drawdown: Largest peak-to-trough equity drop.
- Average holding period: Helps identify if the pattern works better short-term or swing.
4. Regime Testing
Evaluate the pattern under different market regimes and conditions to understand consistency
- Market trends: Use moving averages or ADX filters to filter bullish, bearish, and sideways markets.
- Asset classes: Equities, forex, commodities, or crypto
- Timeframes: Test from 5-min to daily or weekly to see where reliability peaks.
This ensures the Hanging Man isn’t just curve-fitted to one condition.
5. Robustness Testing
Finally, validate the stability and reliability of your results
- Walk-forward testing: Re-train and test your parameters on new data segments.
- Out-of-sample (OOS) validation: Hold back part of your data to verify true predictive power.
- Parameter sensitivity: Adjust body/wick ratio thresholds to see if performance remains consistent.
Robustness checks prevent false confidence and reveal whether the Hanging Man’s edge holds across markets and timeframes.
Which Trading Indicators Works Best with Hammer Pattern?
The Hammer candlestick becomes far more reliable when combined with indicators that confirm momentum shift, trend exhaustion, and buyer strength. The indicators are
RSI (Relative Strength Index)
Best used when RSI is oversold (below 30) or below 40 in an uptrend, signaling selling exhaustion and potential reversal.

Stochastic Oscillator
Bullish crossover from below 20 aligns with buyer entry post-Hammer.

Moving Averages (20 EMA / 50 EMA)
Hammers forming near key moving averages indicate dynamic support and improve reversal probability.

MACD (Histogram or Divergence)
Bullish divergence or rising histogram shows momentum shifting upward after a decline.

Support & Demand Zones
Not an indicator but critical—Hammers near horizontal support, or demand zones work best.

Indicators should confirm the Hammer, not replace it. The highest-probability trades occur when price action (Hammer) aligns with momentum, volume, and structure.
What are Other Types of Candlestick Besides Hammer?
The other types of bullish reversal candlestick besides Hammer include Inverted Hammer, Bullish Engulfing, Morning Start, Dragonfly Doji, and Shooting Star. Characteristics and success rate of these candlestick patterns are mentioned below in the table.
| Pattern | Type | Avg. Success Rate | Key Characteristic / Condition |
| Inverted Hammer | Bullish Reversal | 54% – 70% | Forms after a downtrend; long upper wick indicates early buying pressure. |
| Bullish Engulfing | Bullish Reversal | 63% – 67% | A strong bullish candle fully engulfs the previous bearish candle, showing demand dominance. |
| Morning Star | Bullish Reversal | 52% – 75% | Three-candle pattern signaling a transition from selling pressure to buying strength. |
| Dragonfly Doji | Bullish Reversal | 50% – 60% | Open and close at the same level with a long lower wick, indicating rejection of lower prices. |
| Shooting Star | Bearish Reversal | 54% – 71% | Appears after an uptrend; long upper wick signals buyer exhaustion and potential reversal. |
The above mentioned data on the Shooting Star is taken from the WR trading platform written by Dominikas Pupkevicius and Johannes Gresham, whose research highlights the historical performance of the Shooting Star candlestick.
Difference between a Hammer and an Inverted Hammer Candlestick
The difference between a Hammer and Inverted Hammer is mentioned below in the table.
| Aspect | Hammer | Inverted Hammer |
| Candle Structure | Small real body near the top with a long lower wick | Small real body near the bottom with a long upper wick |
| Trend Context | Forms after a downtrend | Forms after a downtrend |
| Market Psychology | Sellers push price lower but fail; buyers regain control | Buyers attempt to push price higher but face selling pressure |
| Signal Meaning | Rejection of lower prices (buyer strength at lows) | First sign of buying interest after decline |
| Reversal Strength | Stronger reversal intent | Weaker, needs stronger confirmation |
| Confirmation Needed | Break above hammer high | Strong bullish follow-through required |
| Reliability | Higher with support & volume | Lower without confirmation |
| Ideal Location | Major support / demand zone | Near support but after sharp sell-off |
Both patterns appear after a downtrend, but the hammer shows clear demand at lower levels, while the inverted hammer reflects an early buying attempt that has not yet fully succeeded.
Difference between a Hammer Candlestick Pattern and Hanging Man
The difference between a Hammer Candlestick Pattern and Hanging Man is mentioned below in the table.
| Aspect | Hammer | Hanging Man |
| Appearance | Small real body with long lower wick | Small real body with long lower wick |
| Trend Context | Forms after a downtrend | Forms after an uptrend |
| Market Meaning | Seller exhaustion and buyer absorption | Buyer weakness and potential distribution |
| Signal Type | Bullish reversal | Bearish reversal |
| Location Importance | Near support or demand zone | Near resistance or after extended rally |
| Confirmation | Bullish follow-through required | Bearish follow-through required |
| Entry Bias | Look for long setups | Look for short / exit-long setups |
| Reliability | Moderate with confirmation | Moderate with confirmation |
Although the hammer and hanging man look identical, their meaning is completely different because of trend context. A hammer warns that selling pressure is failing, while a hanging man warns that buyers may be losing control.
Difference between Hammer vs Doji vs Spinning Top Candlestick Pattern
The difference between Hammer vs Doji vs Spinning Top Candlestick Pattern is mentioned below in the table.
| Aspect | Hammer | Doji | Spinning Top |
| Candle Structure | Small real body near the top with a long lower wick | Open and close almost equal | Small real body with upper and lower wicks |
| Market Psychology | Sellers exhausted; buyers absorb supply | Indecision between buyers and sellers | Temporary balance after a move |
| Trend Requirement | Must appear after a downtrend | Can appear in any trend | Can appear in any trend |
| Signal Type | Potential bullish reversal | Neutral → needs confirmation | Neutral / pause |
| Reliability | Moderate (improves with context) | Low alone | Low alone |
| Best Use Case | Reversal near support | Trend pause or possible reversal | Consolidation or pause |
| Trading Action | Look for long setup after confirmation | Wait for direction | Wait for breakout |
The hammer hints at reversal intent, while doji and spinning top mainly signal uncertainty. Traders should treat all three as context-driven clues, not standalone entry signals.


 Previous Article


![15 Investing.com Alternatives [Free+Paid] You Should Use in 2026](https://www.strike.money/wp-content/uploads/2026/04/Investing.com-Alternatives.jpg "15 Investing.com Alternatives [Free+Paid] You Should Use in 2026 160")
![15 TradeStation Alternatives [Free+Paid] You Should Use in 2026](https://www.strike.money/wp-content/uploads/2026/04/TradeStation-Alternatives.jpg "15 TradeStation Alternatives [Free+Paid] You Should Use in 2026 161")
![15 Chartink Alternatives [Free+Paid] You Should Use in 2026](https://www.strike.money/wp-content/uploads/2026/04/Chartlink-Alternatives.jpg "15 Chartink Alternatives [Free+Paid] You Should Use in 2026 162")
: Overview, 10 Types of Indicators, Settings for Different Markets 163")


 : Definition, Formula, calculation, Uses, Advantages Vs limitations 166")


No Comments Yet.