The Inverted Hammer is a powerful early warning signal for traders looking to catch trend reversals at market bottoms. Inverted Hammer reflects a moment when buyers begin to challenge selling pressure, hinting at a potential shift in sentiment. Traders use it to identify exhaustion in downtrends and position themselves before a possible upside move, especially when confirmed by volume or momentum indicators.
What is an Inverted Hammer Candlestick?
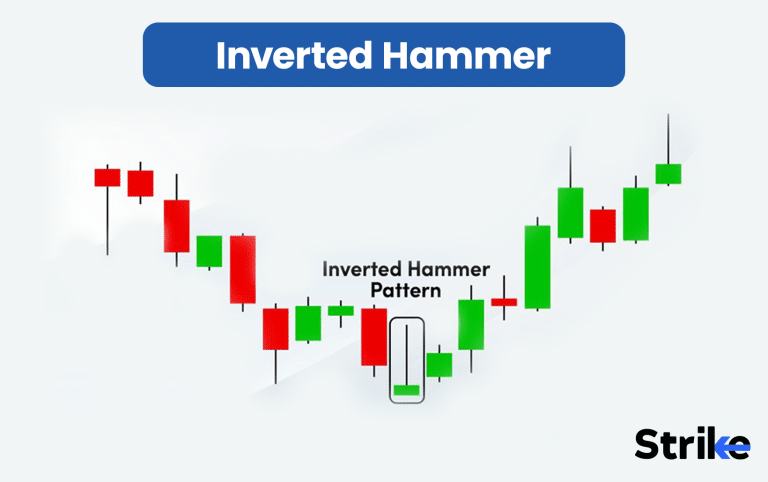
The Inverted Hammer candlestick pattern is a bullish reversal pattern used for technical analysis that forms during a downtrend and signals a trend reversal from bearish to bullish. The Inverted Hammer Pattern reflects a battle between buyers and sellers, with buyers showing strength in pushing the price higher despite initial selling pressure from sellers. The volume of the assets being traded increases significantly during the formation of this pattern.

The Inverted Hammer candlestick pattern, just like all the other candlestick patterns, was invented in the Japanese rice trading markets during the 17th and 18th centuries. A very famous Japanese rice trader named Homma Munehisa developed the foundation of the Inverted Hammer candlestick pattern, which later gained popularity worldwide after the 19th century.
Structure of Inverted Hammer Candlestick
The structure of an Inverted Hammer candlestick pattern consists of three main components. The components are a small real body, long upper shadow and short or no lower shadow.

- Small Real Body: The body of the candle is small and appears near the bottom of the candle range.
- Long Upper Shadow: The long upper shadow or wick that is at least twice the length of the body. This upper shadow represents buyers initially pushing the price higher during the session but closes near the open.
- Short or No Lower Shadow: The lower wick is very short or sometimes absent, showing that sellers couldn’t drive prices much below the opening level.
The colour in Inverted Hammer Candlestick is not crucial, but green Inverted Hammer Candlestick is considered more powerful.
Is An Inverted Hammer Bullish or Bearish?
Yes, an Inverted Hammer is a bullish pattern when it forms after a downtrend, hinting that sellers are losing control as buyers step in. However, the Inverted Hammer on its own is not a confirmed buy signal. It is confirmed by a strong bullish candle in the next session to increase reliability. High volume or support zone presence adds strength to the reversal signal.
How to Identify an Inverted Hammer Candle?
To identify an inverted hammer candle, look for the following 4 main characteristics. The 4 characteristics are previous trend, shape of candle, positioning, confirmation.

- Look for a downtrend: Ensure that the pattern must appear after a clear down trend, as Inverted Hammer is a bullish reversal signal that matters only at the bottom of a falling market.
- Check the candle’s shape: The candle should have a small body forming at the bottom of the candles range. There should be a big upper wick or shadow at least twice the length of the body, while the lower shadow should be very small or absent
- Position in Trend: Inverted Hammer candle should appear near the support zone or after a prolonged selling pressure makes it more significant.
- Confirm the Reversal: Wait for the next candle for the confirmation, if the next closes above the high of the inverted hammer, that confirms that buyers have taken control and the reversal is valid.
You can use different screening software to filter out the stocks and indices forming inverted hammers quickly. These tools help traders identify specific Types of Candlesticks patterns, and a few of the software include Strike Money, Charting, CandleScanner, etc.
Psychology behind Inverted Hammer
The market psychology behind an Inverted Hammer candlestick reveals a tug of war between sellers and buyers during a downtrend.
- Dominating sellers keep pushing price down initially, But mid session buyers step in aggressively and push the price higher.
- Despite buyers’ strength, sellers manage to pull the price back down near the opening price suggesting a momentary equilibrium between buyers and sellers, a pause before a potential reversal.
- This shift in imbalance reflects the weakening of sellers and emergence of buyers, indicating the potential trend reversal.
Confirmation from following candles is crucial, as the pattern alone signals only the possibility of change, not certainty.
Inverted Hammer in Uptrend
When an Inverted Hammer forms in an uptrend, its meaning changes completely. It is no longer an Inverted Hammer, it becomes a Shooting Star, a bearish reversal candlestick pattern.

Visually they both look the same, the difference lies in the trend context. It usually signals potential exhaustion of buying momentum. Here, sellers have managed to push the price back down after buyers initially drove it higher, indicating possible weakness among bulls.
Inverted Hammer in Downtrend
When Inverted Hammer forms in Downtrend, it acts as a bullish reversal signal. The pattern significance improves with the increasing volume during the formation of inverted hammer,showing strong buying and market participation

Use technical support levels or indicators such as MACD or RSI for RSI divergence to increase the accuracy.
What does Red Inverted Hammer Indicate?
A red inverted hammer still indicates a buyer’s strength, but it is generally considered weaker than the green inverted hammer. But why? In a red inverted hammer, sellers managed to push the price below the opening level, causing the candle to close red.

This suggests that while buying pressure existed, sellers were still able to exert some control, making the reversal signal less confident. It requires strong confirmation from the next bullish candle closing above the high of the red inverted hammer.
What does the Green Inverted Hammer Tell?
The Green Inverted Hammer is also known as a Bullish Inverted Hammer indicates stronger buyer strength and a clearer potential for a bullish reversal compared to a red Inverted Hammer. The candle’s green body means that buyers managed to close higher than the opening price indicating buyers strength.

Traders see green inverted hammer as a strong trend reversal signal and often combine it with rising volume and other technical factors.
Where Does the Inverted Hammer Appear in a Chart?
Inverted Hammer typically forms at the end of the prolonged downtrend, near key support levels, demand zones, or oversold RSI regions adds more reliability to the reversal signal. This pattern is relevant and works effectively across various markets including equities, forex, commodities, and cryptocurrencies.
However, the inverted hammer is less effective in sideways or choppy markets where no clear trend exists, as many Chart patterns tend to produce unreliable signals in the absence of a strong trend.
How Often does the Inverted Hammer Candlestick Pattern Happen?
The Inverted Hammer is considered a relatively common candlestick pattern, primarily because it appears during downtrends, which are very common in financial markets. The frequency with which the Inverted Hammer Candlestick Pattern happens depends on factors such as the market’s volatility, the timeframe being analysed, and the assets being used for trading.
The Inverted Hammer Candlestick Pattern occurs much more frequently for shorter time frames as compared to longer timeframes. This happens because the occurrence of a continuous downtrend is more common in shorter time frames, such as 15 min charts, as compared to daily and weekly charts.
Research from Quantified Strategies shows the Inverted Hammer ranks 11th most frequent among 75 candlestick patterns on the daily chart for the SPY (S&P 500 ETF) from 1993 to 2024.
What Timeframe is Best for Inverted Hammer?
Higher timeframe is best for inverted hammer as higher timeframe filters out noise and gives clear trend reversal signal. Intraday timeframes may generate more frequent Inverted Hammer patterns due to higher volatility, but these can be less reliable without strong confirmation.
| Timeframe | Reliability | Best Use Case | Trader Type | Remarks |
| Weekly | High | Major trend reversals | Positional traders | Works best near long-term support or RSI divergence; signals multi-week trend change. |
| Daily | High | Swing reversals | Swing traders | Most reliable timeframe for identifying bullish reversals with volume confirmation. |
| 4-Hour (4H) | Moderate | Short-term reversal setups | Swing / Short-term traders | Good balance of signal strength and frequency; needs a confirmation candle. |
| 1-Hour (1H) | Medium | Quick reversal trades | Intraday / Short-term traders | Useful for identifying pullbacks within a larger trend; confirm with volume or RSI. |
| 15-Min / 5-Min / 1-Min | Low | Minor intraday reversals | Scalpers / Day traders | Too frequent; prone to false signals due to market noise; rely on strong confirmation. |
How to Confirm an Inverted Hammer Signal
To confirm an Inverted Hammer signal, traders typically look for the following.
- Next Candle’s Bullish Close: The next candle after inverted hammer should close above the high of the inverted hammer. This indicates buyers have taken control and the trend may reverse upward.
- Volume Confirmation: A rise in Volume after or during the formation of an inverted hammer signals strength. Higher Volume shows genuine buying interest and increases the reliability of the pattern.
- Support Zone Alignment: Appearing near a key support level, trendline, or Fibonacci retracement adds reliability. It indicates the pattern is forming where the buyers are likely to defend prices.
- RSI or Momentum Divergence: A bullish divergence between price (lower lows) and RSI (higher lows) further validates the reversal.
Using these confirmation methods in combination with the pattern identified after a clear downtrend helps in making better-informed entry decisions.
How Successful is the Inverted Hammer?
Inverted Hammer ranked among the most reliable single-candle bullish reversal patterns in various backtests, with many traders using it in combination with other technical tools to maximize accuracy.
A research by Barry D. Moore on 30 Dow Jones stocks over 20 years, found the Inverted Hammer had a win rate of 60% with an average return per trade of 1.12% when exited after 10 days.
The pattern’s effectiveness is enhanced when it occurs near support zones or during oversold conditions indicated by oscillators like RSI, which is a common confirmation approach used in Technical Analysis.
How to Trade Using the Inverted Hammer Candlestick Pattern
There are three main steps to trade using the Inverted Hammer candlestick pattern. The steps are entry, profit target and stoploss.

Entry
Identify the inverted hammer pattern at the bottom of the downtrend. Wait for confirmation from a bullish candle closing above the inverted hammer. Enter a long position after this confirmation that the bearish pressure is weakening and buyers are gaining control.
Profit Target
Set the target near recent resistance or favourable risk to reward ratio of 1:2 or 1:3. Another method is to aim for the next significant swing high
Stop-Loss
Place the stop-loss below the low of the Inverted Hammer candle to limit downside risk if the reversal fails. Use trailing stops if the price moves favorably to lock in gains while allowing for further upside.
This structured approach helps traders effectively utilize the Inverted Hammer pattern for potential bullish reversals while managing risk properly.
Is an Inverted Hammer Candlestick Pattern Profitable?
Yes, the inverted hammer candlestick pattern is a profitable pattern when used with proper context and confirmation. A backtest result by Barry D. Moore of 1,702 trades over 20 years across multiple markets shows that it has a success rate of about 60%, where this pattern yields profit of about 1.12% per trade.
It is regarded as one of the most reliable and lucrative candlestick patterns for predicting bullish reversals in downtrends. However, as with all technical patterns, it is not foolproof and should be combined with proper risk management and other technical indicators for optimal results.
Common Mistakes to Avoid with Inverted Hammer
There are five common mistakes to avoid with an inverted hammer. The mistakes are mentioned below.
- Entering before confirmation: False entries are mostly caused by traders rushing to join the trend immediately they spot the pattern without an additional bullish candle to verify the trend.
- Trading in sideways markets: When a clear downtrend is obtained then the Inverted Hammers can be applied. The signal becomes unreliable in choppy or range bound markets.
- Ignoring volume or indicator confluence: As the volume is low or not supported by such indicators as RSI or moving averages, the strength of the pattern is undermined. Always seek confirmation.
- Excessive leverage without a stop-loss: Over-leveraging increases risk, and a failed reversal can lead to large losses. Always manage position size and use stop-loss protection.
- Confusing Shooting Star with Inverted Hammer: Both appear the same, however, context is important, Inverted Hammer is the formation that appears on the bottom of a downtrend (bullish) whereas Shooting Star is the formation that appears on the top of a downtrend (bearish).
Traders should wait for confirmation candles, trade only in clear downtrends, consider volume and indicator confirmation, use proper risk management with stop-losses, and correctly identify the pattern based on trend context to avoid common pitfalls with the Inverted Hammer.
Is Shooting Star the Opposite of Inverted Hammer?
Yes, the Shooting Star is essentially the opposite of the Inverted Hammer, but the difference lies mainly in where they appear in the trend, not in their shape. The key difference is the market context in which they appear and what they imply is mentioned below in the table.

| Feature | Inverted Hammer | Shooting Star |
| Appearance | Small real body near the bottom with a long upper wick | Small real body near the bottom with a long upper wick (same look) |
| Trend Context | Appears after a downtrend | Appears after an uptrend |
| Signal Type | Bullish reversal — suggests buyers are fighting back | Bearish reversal — suggests sellers are taking control |
| Psychology | Buyers push price up after a sell-off → sign of possible bottom | Buyers push price higher but fail to hold gains → sign of exhaustion |
| Confirmation Needed | Next candle should close above the inverted hammer high | Next candle should close below the shooting star low |
Despite having the same shape, their trend context differs, the Inverted Hammer appears in a downtrend (bullish reversal), while the Shooting Star forms in an uptrend (bearish reversal).
Difference Between Inverted Hammer vs Hammer Candlestick
The difference Between Inverted Hammer vs Hammer Candlestick is mentioned in the table.
| Feature | Inverted Hammer | Hammer |
| Shape | Small body with a long upper wick and little to no lower wick | Small body with a long lower wick and little to no upper wick |
| Location in Trend | Appears after a downtrend | Appears after a downtrend |
| Indicates | Potential bullish reversal showing buyers trying to take control | Potential bullish reversal showing rejection of lower prices |
| Market Psychology | Buyers tested strength but couldn’t sustain it; confirmation needed next day | Sellers pushed price down, but buyers stepped in strongly |
| Confirmation Candle | Next candle should close above the Inverted Hammer’s high | Next candle should close above the Hammer’s high |
| Resemblance | Looks like an upside-down hammer | Classic hammer shape with the head on top |
Both patterns signal potential bullish reversals, but the Hammer shows stronger buyer control, while the Inverted Hammer needs confirmation to validate the reversal.
Difference Between Inverted Hammer & Other Bullish Candlesticks
The Difference Between Inverted Hammer & Other Bullish Candlesticks is mentioned below in the table.
| Feature | Inverted Hammer | Hammer | Bullish Engulfing | Piercing Pattern | Morning Star |
| Shape | Small body with a long upper wick | Small body with a long lower wick | Large bullish candle engulfs the previous bearish candle | Bullish candle closes above midpoint of prior bearish candle | Three-candle pattern: bearish → indecision → bullish |
| Location in Trend | After a downtrend | After a downtrend | After a downtrend | After a downtrend | After a downtrend |
| Signal Type | Single-candle bullish reversal | Single-candle bullish reversal | Two-candle strong reversal | Two-candle moderate reversal | Three-candle strong reversal |
| Confirmation Needed | Yes, next candle must close higher | Yes, next candle must close higher | Usually not, strong on its own | Preferred, for reliability | Yes, final bullish candle confirms |
| Psychology | Buyers tested strength but need follow-through | Buyers defended support sharply | Bulls overpowered bears decisively | Buyers regained control midway | Momentum shifted gradually from bears to bulls |
The Inverted Hammer is a subtle single-candle reversal signal that needs confirmation, while other bullish patterns like Engulfing or Morning Star provide stronger, multi-candle evidence of a trend reversal.


 Previous Article


![15 Investing.com Alternatives [Free+Paid] You Should Use in 2026](https://www.strike.money/wp-content/uploads/2026/04/Investing.com-Alternatives.jpg "15 Investing.com Alternatives [Free+Paid] You Should Use in 2026 38")
![15 TradeStation Alternatives [Free+Paid] You Should Use in 2026](https://www.strike.money/wp-content/uploads/2026/04/TradeStation-Alternatives.jpg "15 TradeStation Alternatives [Free+Paid] You Should Use in 2026 39")
![15 Chartink Alternatives [Free+Paid] You Should Use in 2026](https://www.strike.money/wp-content/uploads/2026/04/Chartlink-Alternatives.jpg "15 Chartink Alternatives [Free+Paid] You Should Use in 2026 40")
: Overview, 10 Types of Indicators, Settings for Different Markets 42")

 : Definition, Formula, calculation, Uses, Advantages Vs limitations 44")


: How We Used This 70/30 Indicator in 6 High Win-rate Strategies 48")


No Comments Yet.