The shooting star candlestick is very popular among traders to identify trend exhaustion and to catch early signs of downside reversal after a strong bullish trend. A shooting star helps traders to understand the shift in power from initial buyers’ dominance to strong sellers’ entry, indicating slowing momentum and a build-up of supply.
This pattern is used by traders to exit positions, identify short-selling opportunities, or manage risk when approaching resistance. It was developed by Japanese candlestick chartist Munehisa Homma in the 18th century and widely adopted in contemporary markets across the world as a convenient method of reading the market psychology through price behavior.
What is a Shooting Star Candlestick Pattern?
A shooting star is a single-candle bearish reversal candlestick pattern that suggests exhaustion of an uptrend and potential downward reversal. It appears at the peak of the rally and has a very distinct shape, which features a small real body near the bottom, a long upper shadow (at least 2–3 times the body), and little or no lower shadow.

What is the Meaning of Shooting Star Candle?
The shooting star candlestick pattern means the exhaustion of buyers, where buyers lost control at a higher level and sellers took over. The long upper shadow of the shooting star tells that the buyers tried to push the price higher, but sellers stepped in aggressively and pushed the price back near the opening level. This indicates the psychological shift in momentum from bullish to bearish.
Is Shooting Star a Reversal Candlestick Pattern?
Yes, a shooting star is a bearish reversal candlestick pattern because it forms after an uptrend and shows strong rejection from a higher price level. It suggests failure of buyers, which leads to a shift in market sentiment from bullish to bearish.
However, the reversal only gets confirmed when the next candle after the shooting star closes below it.
Is Shooting Star & Falling Star Candlestick Same?
Yes, a shooting star and a falling star are the same candlestick pattern. “Falling star” is just an informal synonym for “shooting star” that describes the same candle pattern with a small real body at the bottom with a long upper shadow.
How to Identify a Valid Shooting Star Candlestick?
To identify a valid shooting star candlestick pattern, it is important to focus on market context along with the pattern structure. There are five main steps to identify the valid shooting star candlestick pattern.

- Prior Uptrend: A shooting star should appear after a sustained uptrend. Shooting stars appearing in sideways markets hold very little reliability.
- Small Real Body: The candle should have an opening and close very near to form a small real body. The body should form near the lower end of the candle. The color of the candle does not matter.
- Long Upper Shadow: The upper shadow of the candle should be 2 – 3 times the body size. This shows the strong price rejection from higher levels.
- Little or No Lower Shadow: The lower wick should be very small or absent. This shows the seller’s dominance till the end.
- Confirmation Candle: The next candle should be bearish, closing below the low of the shooting star. This confirms the entry of sellers and trend reversal.
A shooting star appearing near a key resistance level is an even more powerful signal, as it reflects trapped buyers.
Types of Shooting Star Candlesticks
There are four major types of shooting star candlesticks based on the closing price relative to its opening price. These Types of Candlestick Patterns are essential for identifying potential bearish reversals, and these specific types of Candlestick Patterns are briefly discussed below.
1. Bearish (Red/Black) Shooting Star
A shooting star is considered to be the bearish (red/black) shooting star when the price closes below the opening price, making the candle red in color. It is considered to be the strongest and most reliable type of shooting star.

It shows that, though the buyers initially pushed the price higher, the seller stepped in aggressively to form one of the strongest Bearish Candlesticks; they not just rejected the highs but also forced the price to close lower, indicating a clear dominance of Bearish Candlesticks.
2. Bullish (Green/White) Shooting Star
A shooting star is considered bullish (green/white) when the price closes slightly above its opening price. Although the structure remains the same, it is considered weaker compared to a bearish shooting star.

It shows that, despite sellers rejecting the higher price strongly, the price still closed slightly positive, indicating buyers still have some control as seen in certain Bullish Candlesticks. This pattern requires stronger confirmation from the next candle compared to more definitive Bullish Candlesticks.
3. Doji Shooting Star
The doji shooting star is a variation of the shooting star that has no real body. The opening and closing of the candle are the same. It still has the long upper shadow, maintaining the classic shooting star structure.

This specific Doji shows that the price moved higher, faced strong rejection at the top, and closed exactly at the point of opening, indicating indecision with a bearish bias. This Doji pattern is considered stronger than a bullish shooting star but weaker than a bearish shooting star.
4. Double Shooting Star
Double Shooting Star is a pattern where two consecutive shooting stars form near the top of an uptrend. This back-to-back rejection makes the signal stronger than a single shooting star.

It shows that the price tried to move higher twice, but the attempts were rejected by sellers at higher levels. It is more reliable than the single shooting star. Still requires confirmation (break of low or bearish candle)
Is Shooting Star Bullish or Bearish?
The shooting star is a bearish candlestick pattern that forms after a sustained uptrend and signals a potential trend reversal to the downside. This pattern suggests that the buying pressure is exhausted after an overextended price move and the trend is likely to reverse.
How to Trade with Shooting Star Candle?
There are five major steps for trading the shooting star candlestick pattern. These steps are identification, entry, profit, loss, and exit.
- Identification: Identify the shooting star candlestick pattern after a sustained uptrend or near a key resistance level.

- Entry: Enter a trade after a confirmation candle closes below the low of the shooting star candlestick pattern.

- Profit Target: Place your profit target at the nearest support level or go for 1:2 RR.
- Stoploss: Place your stoploss above the pattern’s high (above the high of the shooting star).
- Exit: Exit if the profit target or stop loss, either of them, gets hit. You can also consider exiting if prices start showing bullish reversal signs.
The real edge lies in waiting for confirmation, as it ensures you’re trading actual selling pressure, not just a visual pattern.
Stocks Trading Example with Shooting Star
Let’s look at one simple example of trading a shooting star in stocks. The image below demonstrates the trade taken based on a shooting star in Hindustan Zinc stock on a daily timeframe.

On a daily chart, price rose sharply in an upward direction, which led RSI into an overbought zone—a common indicator used in various Trading Strategies. Stock then forms a shooting star, a bearish reversal candlestick pattern in an RSI overbought condition, which further validates the effectiveness of these trading strategies. This increased the likelihood of a bearish reversal.
Forex Trading Example with Shooting Star
Forex trading with shooting stars involves identifying shooting star patterns on a preferred timeframe and trading them with proper risk management. As forex pairs are highly liquid compared to stocks, fake price moves are common. Therefore, prefer trading on higher timeframes like 4 hrs and daily.

Above is the daily chart of GBP/USD, a common example found in Forex Trading, where it can be clearly seen how price rose sharply and RSI went overbought. After a strong rally, GBP/USD forms a doji shooting star, indicating exhaustion of the uptrend. In the world of Forex Trading, the price reversed its trend from bullish to bearish after the confirmation candle closed below the doji shooting star, ultimately hitting a profit target of at least 1:2.
Can Shooting Star Candle be Used for Day Trading?
Yes, a shooting star candlestick pattern can be used for day trading by applying it to intraday charts like 5-min, 15-min, or 1-hour timeframes. However, intraday setups are more prone to false signals; they should be traded with proper context and confirmation.
- Trade only when it forms after a strong intraday upmove.
- Enter below the candle’s low after confirmation
- Use higher timeframe resistance or trend direction for better reliability
This arrangement is most effective in the area of intraday resistance levels, a key component of successful intraday trading. Using it together with a volume spike or overbought signals such as RSI provides additional strength to the signal within an intraday trading setup.
Do Shooting Stars Always Guarantee a Trend Reversal?
No, a shooting star does not always guarantee a reversal in established Market Trends. During a strong market, price often continues moving up even after the formation of a shooting star because primary market trends can remain dominant. A shooting star is just a warning signal of exhaustion of an uptrend; the reversal is more probable when the next candle closes below the low of the shooting star.
How to Confirm a Shooting Star Signal?
There are four important parameters to confirm a shooting star signal. These parameters are briefly discussed below.

- Bearish Confirmation Candle: The next candle formed should be bearish. Ideally, it should close below the low of the Shooting Star candle. It is one of the most important confirmations.
- Volume Confirmation: A high volume on a shooting star or confirmation candle confirms the participation of sellers.
- Indicator Support: The RSI overbought zone or bearish divergence adds more confluence to a valid shooting star signal.
- Location: A shooting star forming near an important resistance level increases the probability of reversal.
Even after the confirmation, patterns can still fail. Hence, it is important for traders to trade with risk management even after confirmation.
How Reliable is the Shooting Star Candlestick?
The shooting star candlestick pattern is moderately reliable on its own. However, its reliability increases when used in the right market context and condition, such as key resistance, overbought, and volume. A backtested study by Quantifiedstrategies shows a win rate of 55-65%, highlighting its value when used alongside confirmation signals.
In Which Market Conditions, Shooting Star Works Best?
The shooting star works best in three major market conditions, which are the uptrend, near key resistance, and an overbought market.
- Strong Uptrend: It performs well in overextended markets where the trend has already overextended.
- Near Key Resistance Level: A shooting star works best near key resistance levels like a previous high, a supply zone, or any psychological level. At these levels, selling naturally increases, making the pattern more effective.
- Overbought Condition: An overbought condition suggests overstretched price momentum where the trend is likely to reverse. This can be observed using RSI above 70.
Mentioned above are the best market conditions where Shooting Star works best, but it is important to confirm the pattern by confirmation as well.
How to Avoid False Signals with Shooting Star?
There are six important points to remember while trading the shooting star candlestick pattern. These points are briefly discussed below.
- Don’t Trade Without Confirmation: Always wait for a confirmation by the next bearish candle that closes below the pattern’s low. Avoid entering immediately after the pattern formation.
- Check the Trend First: Trade the shooting star pattern only when it appears after a strong uptrend. Ignore the pattern in a sideways market.
- Focus on Key Levels: Consider entering only near key resistance or supply zones. Don’t enter if a shooting star forms randomly anywhere on the chart.
- Use Volume as a Filter: Look if the shooting star or its confirmation candle has good volume. High volume during pattern formation suggests the good participation of sellers, while low volume may give you a less reliable signal.
- Indicator Confirmation: Add indicators like RSI or Bollinger Bands to confirm the shooting star reversal. These indicators help in confirming the exhaustion of the uptrend.
- Align with Higher Timeframe: Check if the higher timeframe is also showing resistance or weakness. Avoid trading against the bigger timeframe.
When you combine confirmation, trend, key levels, volume, and higher timeframe alignment, the Shooting Star shifts from a random signal to a high-probability trading setup.
Which Indicators Work Best with Shooting Star?
There are four main indicators that work best to confirm the shooting star candlestick pattern. These indicators are RSI, volume, bollinger bands, and MACD.
- RSI (Relative Strength Index): A shooting star formed during an RSI overbought condition increases the reliability of the pattern. An RSI above 70 suggests the price of the underlying is overstressed and likely to reverse. The longer upper shadow of the shooting star, along with the RSI overbought, confirms the exhaustion of buyers and a possible trend reversal.

- Volume: Volume indicators help to identify the real sellers’ participants. A volume spike during a shooting star or confirmation candle increases the reliability of the pattern.

- Bollinger Bands: When a shooting star forms near the upper band (+2 standard deviations) of the Bollinger Bands, it suggests the price is overextended on the upside and facing a strong rejection. This interaction with the Bollinger Bands leads to a bearish reversal based on the concept of mean reversion.

- MACD (Momentum Confirmation): A shooting star formation supported by a MACD bearish crossover or weakening histogram confirms the momentum shift from bullish to bearish.
What Timeframe is Best for Shooting Star?
Higher timeframes, such as daily or weekly, are considered to be the best timeframes to trade the morning star pattern. This timeframe helps filter market noise, making reversals more significant and reducing false signals.
| Timeframe | Reliability | Frequency | Best Use Case |
| 1-min / 5-min | Low | High | Scalping (very noisy, lower accuracy) |
| 1-Hour | Medium | Medium | Intraday/Day trading |
| 4-Hour / Daily | High | Medium | Swing trading |
| Weekly | Highest | Low | Position trading / Long-term reversal |
In most cases, traders consider the daily charts as the most effective timeframe for trading the shooting star, as they provide a good balance between reliability and trading opportunities for position trading. This approach allows those focused on position trading to capture significant reversals while minimizing the impact of short-term market noise. Selecting the correct timeframe for trading is vital for any trader looking to capitalize on this specific reversal signal while avoiding market noise.
Is Shooting Star a Profitable Candlestick?
Yes, a shooting star is a profitable candlestick pattern, but only when used with the right market context. It has less reliability when used alone without a confirmation candle and market context.
According to Thomas Bulkowski’s comprehensive candlestick research, which is highly regarded in the field of Technical Analysis, shooting star patterns have a success rate of more than 60%. However, this success rate dropped to 53% when traded randomly without the confirmation or context typically required in sound Technical Analysis.
Benefits vs Limitations of Shooting Star Candlestick
The benefits and limitations of shooting stars are mentioned below in the table.
| Benefits | Limitations |
| Easy to identify visually on charts | Not reliable as a standalone signal |
| Signals potential trend reversal early | High chance of false signals in strong uptrends |
| Works well at resistance levels | Needs confirmation (next candle) |
| Can provide good risk-reward setups | Low accuracy in sideways/range markets |
| Useful for spotting market exhaustion | Performance drops on lower timeframes |
| Combines well with indicators (RSI, volume) | Doesn’t indicate magnitude of reversal |
| Helps in timing exits for long positions | Can be mistaken for similar patterns |
The shooting star is a good warning tool but not a complete trading system. Its strength lies in context and confirmation, while its weakness is over-reliance without supporting factors.
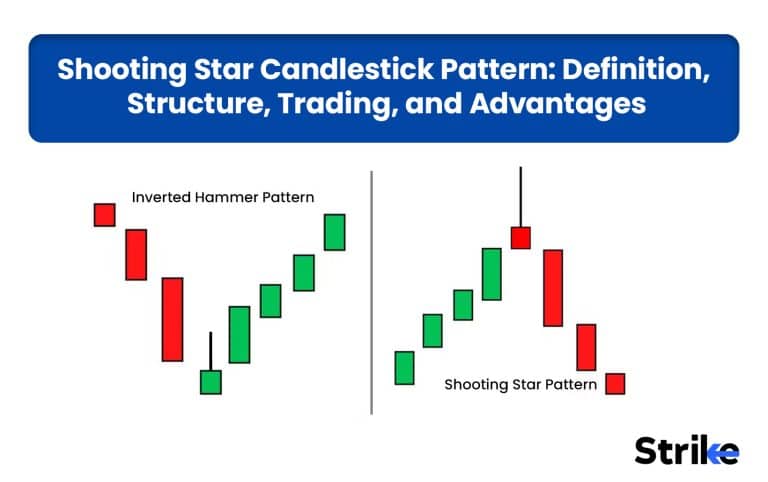
Is Shooting Star in Uptrend Same as Inverted Hammer?
A shooting star and an Inverted Hammer are similar only in terms of structure, but they differ in context. An Inverted Hammer has a small real body at the lower end of the candle with a long upper shadow, just like a typical shooting star, but unlike a shooting star, an inverted hammer appears at the bottom of a downtrend and suggests a bullish reversal.
Which Candlestick Patterns are Similar to Shooting Star?
There are four similar bearish reversal candlestick patterns apart from the shooting star. These patterns are inverted hammer, gravestone doji, hanging man, and bearish evening star.
- Inverted Hammer: The inverted hammer is similar to the shooting star in terms of a long upper wick, but it differs in market context. A shooting star suggests a bearish reversal, whereas an inverted hammer suggests a bullish reversal.

- Gravestone Doji: It is an extreme version of a shooting star. It has no real body with a long upper shadow. A gravestone doji considered stronger than a shooting star.

- Hanging Man: Hanging Man is visually different from Shooting Star, but psychologically they are similar. Instead of a long upper shadow, a hanging man has a long lower shadow, indicating selling pressure entering the market.

- Bearish Evening Star: It is a three-candle pattern that forms after an uptrend and signals a bearish trend reversal. The core idea of a bearish evening star is similar to a shooting star, but a bearish evening star is more reliable, as it has more data.

The above-mentioned patterns might differ structurally from shooting stars, but the core psychology remains the same: an exhaustion of the uptrend and a reversal to bearish.


 Previous Article


![15 Investing.com Alternatives [Free+Paid] You Should Use in 2026](https://www.strike.money/wp-content/uploads/2026/04/Investing.com-Alternatives.jpg "15 Investing.com Alternatives [Free+Paid] You Should Use in 2026 76")
![15 TradeStation Alternatives [Free+Paid] You Should Use in 2026](https://www.strike.money/wp-content/uploads/2026/04/TradeStation-Alternatives.jpg "15 TradeStation Alternatives [Free+Paid] You Should Use in 2026 77")
![15 Chartink Alternatives [Free+Paid] You Should Use in 2026](https://www.strike.money/wp-content/uploads/2026/04/Chartlink-Alternatives.jpg "15 Chartink Alternatives [Free+Paid] You Should Use in 2026 78")
: Overview, 10 Types of Indicators, Settings for Different Markets 79")


 : Definition, Formula, calculation, Uses, Advantages Vs limitations 82")


No Comments Yet.