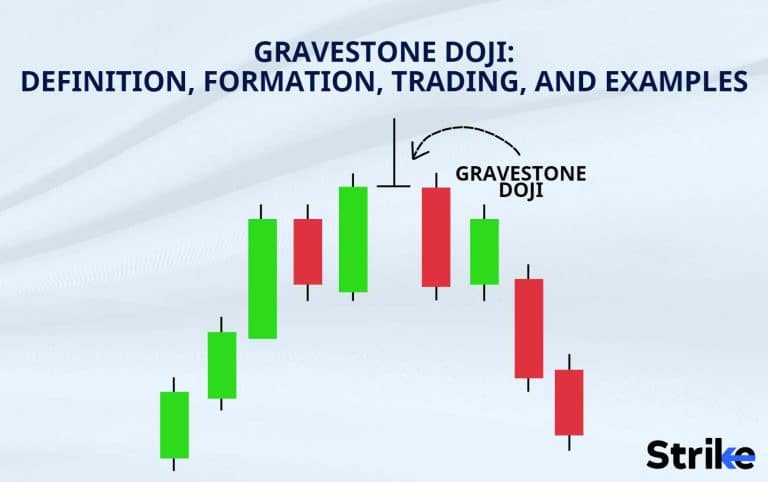
Gravestone Doji is a bearish candlestick used by traders for technical analysis. Gravestone Doji is a candlestick pattern observed when the opening and closing value of the asset is equal, which occurs at the low of the day. The longer the upper shadow of the Gravestone Doji, the more bearish the pattern is considered to be, as it suggests that the selling pressure was strong and overwhelmed the buying pressure.
Doji is a commonly found candlestick pattern in which the price of the asset closes and opens at the same point. Doji is represented with the help of a small candle having a relatively very small real body on the charts. The shapes of these candles are then analysed by traders to make decisions about price movements.
On May 22nd, 2015, an Indian company called Adani Ports formed a Gravestone Doji in its daily charts. This pattern is commonly seen in the stock market. The Gravestone Doji was formed with an initial dominance of bears with an uptrend from the levels of 300 to 348. The market experienced a 16% increase on this day but later dropped from 350 to 298 as the Gravestone Doji formed. This was another drop of about 15 percent. Gravestone Doji can be clearly observed in the below chart, it is formed at the top of the uptrend and denotes a bearish reversal of trend. The general property that defines this Japanese candlestick is a small real body with an extremely long upper shadow (similar to an inverted ‘T’).
What does a Gravestone Doji mean?
The Gravestone Doji is a bearish Doji, which is observed when the opening and closing price of a security is equal during a trading session. The Gravestone Doji is initiated with an uptrend, which is denoted with a long upper shadow. The Gravestone Doji got its name because the pattern resembles a gravestone with an unusually long shadow pointing upwards.

The Gravestone Doji is considered one of the most significant Doji, which indicates a shift in the market sentiments from bearish to bullish. It is typically seen as a bearish reversal pattern and occurs after an uptrend. The pattern is formed when the security market opens up at a higher price than the previous day’s close, but prices start to fall after the uptrend and close at or near the same level as the open, with a long upper shadow. This Doji indicates the change in the market sentiment, where at first the market was dominated by buyers, because of which an uptrend was followed.The price fell later on because the market was dominated by sellers, because of which this pattern is known as the bearish reversal pattern. The long upper shadow of the candlestick indicates that there was significant selling pressure during the trading session.
The reason why Gravestone Doji is considered as one of the most significant Doji is because it represents the balance between Bears and Bulls during a trading session. The history of gravestone doji dates back to the early 1700s, it was developed by the Japanese for analysing rice trading. Candlestick charts were created by the Japanese as a tool for market analysis, which offered a visual representation of price action and enabled traders to spot patterns and trends. This method was used by Japanese traders to find trends, in order to maximize their profit by the price movement. The Gravestone Doji was one of the many Doji’s developed by the Japanese traders for trading goods.
The Gravestone Doji became famous in the modern-day trading during 1980s because of the efforts of Steve Nison. Steve brought Japanese candlestick charting to Western traders in his book “Japanese Candlestick Charting Techniques,” candlestick charting and the use of patterns like the Gravestone Doji became more common in the West during this time. Traders from all over the world have started to use candlestick charting as a common technical analysis instrument, after Steve’s contribution.
The Gravestone Doji has developed into one of many candlestick formations that traders employ when examining the markets. Candlestick charting may have started more than 300 years ago in Japan, but it is still a vital tool for traders of all types today. It is constantly evolving and adapting to shifting market conditions.
How is a Gravestone Doji Candlestick Formed?
The Gravestone Doji is a kind of candlestick formed when the opening and closing price of a security in the market is equal, which signifies indecision in the market. The reason it is named a “gravestone” is that the candlestick’s general shape, which has a long upper shadow but no lower shadow, is similar to a gravestone. This can simply be observed at the top of the charts in the form of an inverted ‘T’.

It’s critical to comprehend the fundamental elements of a candlestick in order to comprehend how the gravestone doji candlestick is constructed. The body of each candlestick symbolises the spread between the open and close prices, and the wicks or shadows stand in for the high and low prices.

A gravestone doji candlestick has a very small or nonexistent body because the open, high, and close prices are all the same or very near to one another. The upper shadow, which is typically long, represents the candlestick high, while the lower shadow, which is either very tiny or nonexistent, represents the candlestick’s low.
A gravestone doji candlestick forms after an extended uptrend and is regarded as a bearish reversal indicator. The long upper shadow shows that sellers ultimately took control and drove the price back down to the open level after buyers attempted to drive it higher but were unable to maintain the momentum. The lack of a lower shadow suggests that there is little support for the asset at the current price level.
Sellers begin to join the market as the price hits its peak, ultimately driving it back down to the open level, which is symbolized by the absence of a lower shadow, and the price declines from there. The outcome of this struggle between buyers and sellers is a candlestick with a tiny or nonexistent body, signifying market uncertainty.
What does Red Gravestone Doji Candlestick tell?
A particular variety of candlestick pattern called the Red Gravestone Doji Candlestick is frequently seen in technical analysis of financial markets like stocks, bonds, and forex. Traders frequently use this candlestick pattern to forecast possible trend reversals or to validate current trends.
The long upper shadow of the Red Gravestone Doji Candlestick is one of its distinguishing features, which is usually at least twice as long as the candlestick’s actual body The candlestick’s actual body, which is tiny and situated close to its lower end, gives the impression that it is a gravestone.
The Red Gravestone Doji Candlestick is created when a security’s opening and closing prices are identical or very similar, the day’s high price is reached early in the trading session, and the price declines throughout the day to finish relatively close to the day’s low. Buyers were initially in charge of the market, this pattern suggests that although sellers ultimately overpowered buyers and drove the price lower.
What does Green Gravestone Doji Candlestick mean?
Green Gravestone Doji is a particular form of candlestick pattern, frequently seen in technical analysis of financial markets like stocks, bonds, and forex. Traders frequently use this candlestick pattern to forecast possible trend reversals or to validate current trends.
The Green Gravestone Doji Candlestick is distinguished by a lengthy upper shadow that is ordinarily at least twice as long as the candlestick’s actual body. The candlestick’s actual body gives the impression that it is a gravestone, which is tiny and situated close to its lower end.
The Green Gravestone Doji Candlestick is created when a security’s opening and closing prices are identical. The day’s high price is reached early in the trading session. It then declines throughout the day to finish relatively close to the day’s low. This pattern suggests that although sellers ultimately overpowered buyers and drove the price lower, buyers were initially in charge of the market.
The Green Gravestone Doji Candlestick is interpreted by traders as a bearish indicator, pointing to a change in market sentiment from bullish to bearish and a potential reversal. The tiny real body at the bottom indicates that sellers were able to take control and drive prices lower, while the long upper shadow suggests that buyers tried to drive prices higher but ultimately failed. The candlestick’s proximity to the day’s low indicates that selling pressure will probably persist during the following trading session.
Does It Matter if A Gravestone Doji Candlestick Is Red or Green?
Yes, the color of a Gravestone Doji Candlestick can be significant in technical analysis as it indicates the direction of the price movement.
An impending reversal is indicated by a red Gravestone Doji Candlestick. It is a bearish indicator and indicates that the market sentiment has changed from bullish to bearish. This candlestick pattern appears when a security’s opening and closing prices are identical or very close to one another. The day’s high price is reached early in the trading session, and the price declines throughout the day to finish relatively close to the day’s low.
A green Gravestone Doji Candlestick is a bearish signal as it shows that the market sentiment has changed from bearish to bullish, suggesting that a possible reversal may be close at hand. The only distinction between this candlestick pattern and the red Gravestone Doji Candlestick is that it closes in green.
When does Gravestone Doji Candlestick happen?
Gravestone Doji Candlestick happens in a technical analysis when an asset’s opening and closing prices are identical or very close to one another, and the candlestick’s high price is not far from the asset’s high for the time under consideration. The resulting candlestick resembles a gravestone because it is vertical and has a long top shadow but no lower shadow.
This pattern usually signifies indecision in the market and potential reversal in the trend, especially when it appears after a bullish trend. It is seen as a bearish signal, suggesting that the buyers have lost control and the sellers may take over.
How often does Gravestone Doji Candlestick occur?
Gravestone Doji Candlestick patterns can appear more frequently or less frequently based on the asset being traded and the timeframe of the chart being examined. Gravestone Doji Candlesticks are generally regarded as being extremely uncommon, particularly when compared to candlestick patterns like the Hammer, Shooting Star, and Doji.
The Gravestone Doji Candlestick pattern is extremely uncommon, due to the particular requirements that must be fulfilled for it to form. A specific combination of an open and close that are close to or at the period low, a long upper shadow, and a tiny or nonexistent lower shadow are necessary for the pattern to appear. The Gravestone Doji Candlestick pattern is rarely observed in the market because these circumstances are not always met.
How to read Gravestone Doji Candlestick in Technical Analysis?
The Gravestone Doji candlestick is interpreted in technical analysis as a possible reversal indicator that might point to a change in the market’s sentiment from bullish to bearish. Consider the following five important details when interpreting the Gravestone Doji candlestick:
- The long upper shadow and lack of a lower shadow on the Gravestone Doji candlestick indicate that the bulls have lost momentum and the bears are gaining dominance.
- The fact that the opening and ending prices are near or at the low of the time period under consideration suggests that sellers were successful in driving the price down from the peaks.
- A bullish trend typically ends with the Gravestone Doji candlestick, which indicates that the market may be overbought and due for a correction or reversal.
- Gravestone Doji can indicate a stronger bearish trend and potentially a good opportunity for short selling or exiting long positions, the Gravestone Doji candlestick is followed by a bearish candlestick or a series of bearish candlesticks.
- Traders may use additional technical indicators, such as support and resistance levels, moving averages, and trend lines, to verify the possible reversal indicated by the Gravestone Doji candlestick,
Traders who are active take part in technical analysis should always take into account the wider market circumstances and news stories that could affect the price of the asset being studied.
How accurate is the Gravestone Doji Candlestick in Technical Analysis?
The accuracy of the Gravestone Doji (or any other candlestick pattern) can be affected by market conditions and the timeframe being analysed. It can be more reliable in certain markets or time frames than in others.
The Gravestone Doji is a candlestick pattern in technical analysis that is typically interpreted as a potential bearish reversal signal. It forms when the opening and closing prices are near the low of the candle, and there is a long upper shadow that indicates significant selling pressure during the session.
It is important to note that no technical analysis tool is completely accurate or reliable on its own. The Gravestone Doji should be used in combination with other technical indicators and analysis techniques to confirm potential trading opportunities like any candlestick pattern.
How Reliable is a Gravestone Doji Candlestick in Technical Analysis?
The reliability of the Gravestone Doji candlestick pattern in technical analysis depends on three factors, including the market conditions, timeframe, and other technical indicators used in conjunction with it.
The Gravestone Doji pattern is considered a bearish reversal signal when it occurs after an uptrend, indicating that selling pressure has increased and that a potential trend reversal is imminent. The pattern is not foolproof and can sometimes produce false signals, especially in choppy or range-bound markets.
It is also important to note that candlestick patterns, including the Gravestone Doji, should be used as part of a comprehensive trading strategy rather than as a standalone signal.
How to Trade with Gravestone Doji Candlestick in Stock Market?
Trading with the Gravestone Doji candlestick in the stock market can be done in the following ways depending on the trading style and strategy of the trader. Here are five general guidelines on how to trade with the Gravestone Doji candlestick:
- Look for the pattern: The Gravestone Doji pattern forms when the opening and closing prices are near the low of the candle, and there is a long upper shadow that indicates significant selling pressure during the session. Traders should look for this pattern on the charts of the stocks they are interested in trading.
- Confirm with other indicators: Traders should confirm the Gravestone Doji pattern with other technical indicators and analysis techniques. They may look for additional bearish signals such as a bearish divergence in the RSI or a breakdown in price below a key support level.
- Plan the trade: Traders should plan their trade accordingly, Once the Gravestone Doji pattern is confirmed. They may consider entering a short position with a stop loss above the high of the Gravestone Doji candlestick, anticipating a potential trend reversal and price decline.
- Manage risk: Traders should always manage their risk when trading with the Gravestone Doji pattern. They may use a trailing stop loss or a take-profit order to lock in profits and minimise potential losses.
- Monitor the trade: Traders should monitor their trade and adjust their position if necessary, based on new price action and market conditions.
It is important for traders to have a comprehensive trading plan with the proper application of Gravestone Doji, to achieve long-term success in the stock market.
What Momentum Indicator Works with Gravestone Doji Candlestick?
Momentum indicators are used to measure the strength of a trend and identify potential trend reversals. Momentum indicators can help traders confirm potential trading opportunities, when combined with the Gravestone Doji candlestick pattern . Here are three momentum indicators that can be used with the Gravestone Doji candlestick:
- Relative Strength Index (RSI): The RSI is a popular momentum indicator that measures the speed and change of price movements. Traders can look for a bearish divergence between the RSI and the price, when combined with the Gravestone Doji pattern. This may indicate that the stock is losing momentum and a potential trend reversal is likely.
- Moving Average Convergence Divergence (MACD): The MACD is a trend-following momentum indicator that shows the relationship between two moving averages. Traders can look for a bearish crossover between the MACD line and the signal line, which may indicate a potential trend reversal.
- Stochastic Oscillator: The Stochastic Oscillator is a momentum indicator that compares the current closing price of a stock to its price range over a set period of time. Traders can also look for the Stochastic Oscillator to cross below the overbought level, which may indicate a potential trend reversal.
The momentum indicator and Gravestone Doji should both be used simultaneously to predict trends. Momentum Indicator and Gravestone Doji have a high rate of success when used together.
When is the best time to Trade using Gravestone Doji Candlestick?
The Gravestone Doji candlestick pattern is a bearish reversal pattern, which means it can be a signal for traders to consider selling or shorting an asset. It is best used in combination with other tools and should not be relied on as the sole indicator for trading decisions
It’s also important to note that trading using candlestick patterns, including the Gravestone Doji, can involve risks and losses. Traders should always practise proper risk management techniques, such as setting stop-loss orders and taking profits at reasonable levels.
The best time to trade using the Gravestone Doji candlestick pattern is when it is confirmed by other technical indicators and aligns with a trader’s overall strategy and risk management plan.
What is an example of a Gravestone Doji Candlestick used in Trading?
This candlestick pattern is rarely observed in the securities market. One Illustration of the Doji pattern is shown in this Andhra Bank monthly chart. It made a Doji at level 73 after having been in an earlier uptrend of about 7% from level 68, and then it reversed its trend to return to level 69. The Doji pattern is highlighted in the following chart, it forms on the top of the uptrend and denotes trend reversal.

Is a Gravestone Doji Candlestick a Bullish Reversal?
No, a Gravestone Doji candlestick is not a bullish reversal pattern. In fact, it is in fact, a bearish reversal pattern that can potentially indicate a shift in momentum from bullish to bearish.
A Gravestone Doji forms when the open, close, and high prices of a candlestick are very close or equal, and the low of the candlestick is significantly lower than the open, close, and high. This pattern suggests that bulls may have initially pushed prices up, but bears eventually took control and pushed prices back down
What are the Benefits of a Gravestone Doji Candlestick?
The Gravestone Doji Candlestick pattern is a widely used technical analysis tool, this pattern helps traders to precisely find entry and exit points in the trade. Following are top five benefits of a Gravestone Doji candlestick pattern:
- Indicating potential trend reversal: A Gravestone Doji can suggest that a bullish trend may be losing momentum and a bearish trend could be on the horizon.
- Providing clear entry and exit points: Traders can use a Gravestone Doji to identify key support and resistance levels and plan their entry and exit points accordingly.
- Offering a low-risk trading opportunity: Gravestone Doji patterns can provide traders with a low-risk trading opportunity by placing a stop-loss order above the high of the candlestick.
- Facilitating risk management: Gravestone Doji patterns can help traders manage their risk by allowing them to exit a position before a significant loss, by identifying potential trend reversals.
- Enhancing technical analysis: Gravestone Doji patterns are a useful tool for technical analysts who use candlestick charting to analyse the market.
The Gravestone candlestick pattern is a very useful asset for the traders, because of its easier identification and it also helps traders to decide entry and exit points of the trade.
What are the Limitations of a Gravestone Doji Candlestick?
A gravestone doji is a type of candlestick pattern that occurs when the opening and closing prices of a security are at the low of the day, creating a long upper shadow. This pattern can be useful for identifying potential reversals in the market, but it does have these five limitations:
- False signals: Gravestone doji candlesticks can generate false signals, like other candlestick patterns. A gravestone doji may occur in a trading range or during a period of consolidation, leading traders to interpret it as a bearish signal when it may not be.
- Weak confirmation: Gravestone doji candlesticks are most effective when they occur after a significant downtrend. They may not be as reliable, if they occur in isolation or without strong confirmation from other technical indicators.
- Timeframe: The effectiveness of a gravestone doji can also depend on the timeframe being analysed. A gravestone doji on a daily chart may be less significant than one on a weekly or monthly chart.
- Market conditions: Market conditions can also impact the effectiveness of a gravestone doji. The pattern can not be as reliable as during more stable market conditions, during times of high volatility or low trading volume,
- Risk management: Finally, it’s important to keep in mind that technical analysis is just one tool in a trader’s toolkit. Proper risk management and the use of stop-loss orders is critical to limit losses and protect capital.
The effectiveness of the indicator or tools used for technical analysis is also dependent on the skills of the person using them. Without proper knowledge any tool would produce false outputs, so traders should have proper knowledge before using them.
What are other Types of Doji Candlestick Patterns besides Gravestone Doji?
Doji is a type of candlestick pattern that occurs when the opening and closing prices of an asset are almost the same. Here are five other types of Doji candlestick patterns besides Gravestone Doji:
- Dragonfly Doji: A bullish reversal pattern that occurs when the opening and closing prices are at or near the high of the candlestick, and there is a long lower shadow.
- Long-Legged Doji: A pattern that occurs when the opening and closing prices are the same, and there are long upper and lower shadows that indicate significant buying and selling pressure during the session.
- Four Price Doji: A rare pattern that occurs when the opening, closing, high, and low prices are all the same, indicating a period of extreme indecision in the market.
- Northern Doji: A bullish pattern that occurs when the opening and closing prices are the same, and there is a long lower shadow. This pattern suggests that buyers are stepping in to support the price.
- Southern Doji: A bearish pattern that occurs when the opening and closing prices are the same, and there is a long upper shadow. This pattern suggests that sellers are stepping in to push the price lower.
These are five of the most common types of Doji candlestick patterns, but there are many other variations that traders can use to analyse market trends and identify potential trading opportunities.
What Candlestick Pattern is Similar to Gravestone Doji Candlestick?
The Gravestone Doji is a bearish reversal candlestick pattern that is similar in appearance to other candlestick patterns, such as the Long-Legged Doji and the Shooting Star.
The Long-Legged Doji pattern occurs when the opening and closing prices are the same, and there are long upper and lower shadows that indicate significant buying and selling pressure during the session. This pattern suggests indecision in the market and can be a sign of a potential trend reversal.
The Shooting Star pattern also has a long upper shadow, but unlike the Gravestone Doji, it has a small real body at the lower end of the candlestick. This pattern occurs after a sustained uptrend and suggests a potential trend reversal to the downside.
Gravestone Doji, Long-Legged Doji, Shooting Star patterns may look similar at first glance but they have significant differences in their formation and interpretation.
What is the Opposite of Gravestone Doji Candlestick?
The Gravestone Doji is a bearish candlestick pattern that occurs when the opening and closing prices are near the low of the candlestick and there is a long upper shadow. The opposite of the Gravestone Doji is the Bullish Dragonfly Doji.
The Bullish Dragonfly Doji is a bullish reversal pattern that occurs when the opening and closing prices are at or near the high of the candlestick. There is a long lower shadow that indicates significant buying pressure during the session. This pattern suggests a potential trend reversal from a downtrend and can be a bullish signal for traders.
The Bullish Dragonfly Doji is the opposite of the Gravestone Doji as it is a bullish reversal pattern that suggests a potential trend reversal to the upside, while the Gravestone Doji is a bearish reversal pattern that suggests a potential trend reversal to the downside.
What is the Difference Between Gravestone Doji Candlestick and Dragonfly Doji?
The Gravestone Doji and Dragonfly Doji are both candlestick patterns that are often used in technical analysis to identify potential trend reversals. There are three key differences between them although these two patterns may look similar at first glance. Here’s a brief overview of the differences between Gravestone Doji and Dragonfly Doji:
- Shape and appearance: The Gravestone Doji pattern occurs when the opening and closing prices are near the low of the candlestick, and there is a long upper shadow that indicates significant selling pressure during the session. The Dragonfly Doji pattern on the other hand occurs when the opening and closing prices are near the high of the candlestick. There is a long lower shadow that indicates significant buying pressure during the session.
- Bullish or bearish signal: The Gravestone Doji is a bearish reversal pattern that suggests a potential trend reversal from an uptrend, while the Dragonfly Doji is a bullish reversal pattern that suggests a potential trend reversal from a downtrend.
- Market context: The context in which these two patterns occur is also different. The Gravestone Doji typically occurs after a sustained uptrend, while the Dragonfly Doji typically occurs after a sustained downtrend.
The key difference between the Gravestone Doji and Dragonfly Doji is the direction of the trend reversal signal they provide. The Gravestone Doji suggests a potential trend reversal to the downside, while the Dragonfly Doji suggests a potential trend reversal to the upside.


 Previous Article


![15 Investing.com Alternatives [Free+Paid] You Should Use in 2026](https://www.strike.money/wp-content/uploads/2026/04/Investing.com-Alternatives.jpg "15 Investing.com Alternatives [Free+Paid] You Should Use in 2026 52")
![15 TradeStation Alternatives [Free+Paid] You Should Use in 2026](https://www.strike.money/wp-content/uploads/2026/04/TradeStation-Alternatives.jpg "15 TradeStation Alternatives [Free+Paid] You Should Use in 2026 53")
![15 Chartink Alternatives [Free+Paid] You Should Use in 2026](https://www.strike.money/wp-content/uploads/2026/04/Chartlink-Alternatives.jpg "15 Chartink Alternatives [Free+Paid] You Should Use in 2026 54")
: Overview, 10 Types of Indicators, Settings for Different Markets 56")

 : Definition, Formula, calculation, Uses, Advantages Vs limitations 58")


: How We Used This 70/30 Indicator in 6 High Win-rate Strategies 62")


No Comments Yet.