Dragonfly Doji represents the psychology of the market on its most dramatic level, a silent pause between exhaustion and renewal. Dragonfly Doji frequently appears at the time of volatility and clash of emotions, indicating that something important is going to happen. It is a time when traders can feel the hesitation of the crowd and they are awaiting the next move.
The emergence of the pattern may change the mood, making fear to curiosity and patience to action. It is in these instances that the informed versus the impulsive lies in confidence, time and conviction in the market as the Dragonfly Doji becomes something more than a pattern, it is an internal discussion of the market.
What Is a Dragonfly Doji?
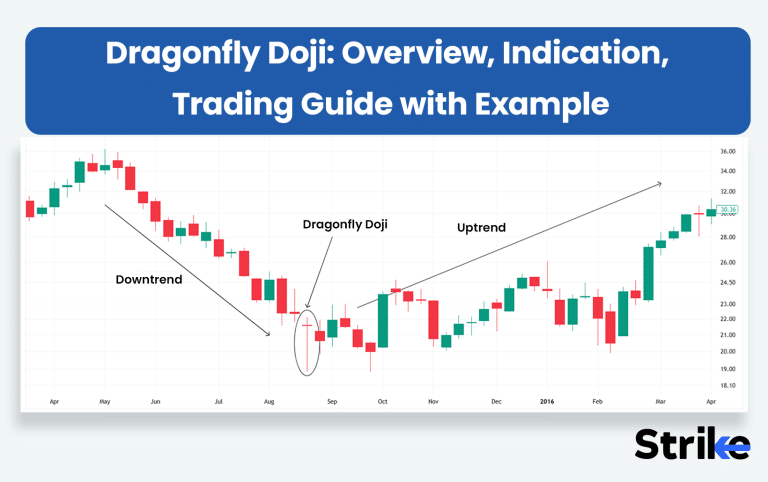
Dragonfly Doji is a candle stick pattern in technical analysis that indicates potential market reversal. Dragonfly Doji candlestick pattern usually forms after a downtrend with a bullish bias. It is characterized by its distinct “T” shape with a long lower shadow and virtually absent body.
Structure of a Dragonfly Doji
The structure of Dragonfly Doji is characterized by three main features. The features are no real body, long lower shadow, and no upper shadow.

- No Real Body (or Very Small): The open, high and close price is almost similar resulting in extremely small or no body.
- Long Lower Shadow: It has a longer lower shadow that is typically twice the length of the real body. The lower shadow is the most crucial feature of Dragonfly Doji, indicating that sellers dominated early but lost control to buyers later.
- No Upper shadow (or Very Small): A classic Dragonfly Doji has little to no upper shadow suggesting price did not rise much above opening price during that particular trading session.
The color of the Dragonfly Doji can be either red or green, but this colour difference is less important.
Psychology behind Dragonfly Doji
The psychology behind Dragonfly Doji represents a significant battle and potential shift in a market sentiment from bearish to bullish.
- Sellers initial control: The sessions begin with a strong selling pressure where price falls sharply as bears control the market and successfully push the price down to a new low.
- Buyers Step In: As price hits an impressive low, buyers enter aggressively. This aggressive entry absorbs all the selling pressure, shifting momentum from bearish to bullish.
- Price Rejection: The influx of buying power is so strong that it pushes the price all the way back to the level of opening price.
- Market signal: Dragonfly Doji tells that even though sellers dominated early, buyers ultimately won the battle.
Dragonfly Doji shows a psychological shift from fear to confidence, shifting market sentiment from bearish to bullish.
.
Is the Dragonfly Doji a Bullish or Bearish Pattern?
Dragonfly Doji is a bullish candlestick pattern. It typically represents bullish reversal when it appears at the bottom of a downtrend, implying that sellers drove the price lower but buyers regained control. Confirmation from the following candle is essential because if it appears after an uptrend, it could indicate indecision or possible exhaustion.
What does Dragonfly Doji Indicate?
A Dragonfly Doji indicates that buyers are starting to gain strength after sellers initially dominate. Prices fell sharply during the session, but they were driven back up by strong buying pressure to close to the opening level. This indicates a change in market sentiment from pessimistic to optimistic.
However, the meaning of Doji changes depending on its position in a trend i.e, uptrend or downtrend.
Dragonfly Doji in Uptrend Meaning
A Dragonfly Doji in an uptrend means uncertainty or possible trend exhaustion. The pattern shows that sellers drove prices sharply lower during the trading session, but buyers were able to raise the price by the close, forming a “T” shape, close to the open. This suggests growing bear strength as selling pressure emerged sufficiently strongly to test the bulls.

Dragonfly Doji in Downtrend Meaning
A Dragonfly Doji in downtrend means a possible bullish reversal. When sellers push prices sharply lower during a session, buyers step in to absorb the selling pressure and push the price back to the opening level. This price action points to a potential market bottom or support level by indicating that buyers are becoming stronger and selling momentum is waning.

What does Red Dragonfly Doji Candlestick Indicate?
A Red Dragonfly Doji indicates that buyers tried to regain control after strong selling pressure, but the candle still closed slightly below the opening price. This shows that even though bulls intervened, they were unable to completely defeat the sellers. It still indicates a potential bullish reversal, but the next candle’s confirmation is essential to confirming the change in momentum.

What does Green Dragonfly Doji Candlestick Mean?
A Green Dragonfly Doji means that buyers successfully regained control after strong selling pressure. Price fell sharply during the session, but Bulls drove prices back up to close just above the opening price. When it emerges in a downward trend, it clearly indicates a possible bullish reversal and a change in sentiment from selling to buying.

Do the Color of Dragonfly Doji Matter?
The color of a Dragonfly Doji doesn’t matter much because its shape and position carry more significance than whether it’s red or green. The key message comes from a long lower shadow and close near the open.
However, a green Dragonfly Doji may indicate slightly stronger bullish sentiment, while a red Dragonfly Doji suggests slight buyer hesitancy.
What does Inverted Dragonfly Doji Indicate?
Invert Dragonfly Doji also known as “Gravestone Doji” indicates indecision and potential trend reversal, but its meaning depends on where it appears.

When it appears in an uptrend, it indicates that buyers drove prices higher but were unable to hold them, which could indicate a bearish reversal or weakening bullish momentum. If it shows up after a downtrend, on the other hand, it indicates uncertainty rather than a definite reversal as buying attempts encounter resistance.
How to Identify Dragonfly Doji Candlestick in Technical Analysis?
To identify a Dragonfly Doji candlestick in technical analysis, look for these key characteristics aligned with your criteria
- The body of the candle should be very small or almost nonexistent, typically 10-20% of the entire candle length. This means, opening and closing prices are nearly equal.
- The lower shadow should be significantly long, usually at least 2–3 times the size of the real body. This long lower shadow indicates that sellers pushed prices down sharply during the session.
- The upper shadow should be very small or absent, reflecting open, high, and close are at the same level forming the “T” shape.
This recognition framework will help you spot potential turning points in the market using precise candlestick structure criteria.
When does Dragonfly Doji Candlestick occur?
A Dragonfly Doji candlestick occurs during a trading session when buyers regain control by pushing the price back up to close to or at the opening price after strong selling pressure pushes the price sharply lower. As a result, the candlestick displays a “T” shaped pattern with a long lower shadow (wick) and little to no upper shadow, with the open, high, and close prices approximately equal.
How often does Dragonfly Doji Candlestick happen?
A Dragonfly Doji candlestick is relatively rare in the market. It doesn’t form frequently because it requires a specific balance of price movement. Even though slight variations may occur frequently, a perfect Dragonfly Doji with a long lower shadow and nearly no upper shadow is rare, so when it does occur, it is a significant signal.
Its frequency depends on factors such as volatility, timeframe, and asset type. It is more common on shorter timeframes and in volatile markets, but it is less common and more important on daily charts. Since they usually make up less than 5% of all candles, their rarity lends them significant weight as possible reversal signals, particularly when volume and follow-through are verified.
How to Trade with Dragonfly Doji in the Stock Market?
To trade the stock market with a Dragonfly Doji, we have three main setups depending on the market context and position of the Doji. The setups are simple reversal at support, pull-back and continuation in uptrend and multi confluence reversal.
Setup A: Simple Reversal at Support
This setup involves identifying Doji at support and planning a reversal trade.

- Entry: Identify the Dragonfly Doji at support level and enter the trade once confirmation candle closes above the high of Dragonfly Doji candle.
- Stop-loss: Place your stop-loss just below the Dragonfly Doji candle or use an ATR (1.0–1.5) buffer for volatility adjustment.
- Target: Set target for prior swing high or or use R-multiples (2R / 3R) for risk-based targets. You can also use 10 or 20 EMA to ride extended reversals.
Setup B: Pull-back and Continuation
This setup involves identifying Dragonfly Doji during pullback and trading the trend continuation.

- Entry: Look for the Dragonfly Doji forming at a rising 20-MA or 50-MA after a price pullback in a persistent uptrend; enter the trade on confirmation (such as a bullish candle closing above Doji high).
- Stop-loss: Place your stoploss just below the Dragonfly Doji candle or use an ATR (1.0–1.5) buffer for volatility adjustment or below moving averages.
- Target: Set R-multiples (2R / 3R) for risk-based targets or stay in trade until trend reverses. You can also use 10 or 20 EMA to ride extended reversals.
Setup C: Multi Confluence Reversal.
This setup involves multi confluence along with Dragonfly Doji such as strong support level, Fibonacci retracement area, RSI bullish divergence, and a volume spike.
- Entry: Use a staggered scale-in strategy i.e, entry partially in beginning and add on positions as confirmation grows.
- Stoploss: Just below the lowest confluence level or the Doji low.
- Target: Take partial profits at intermediate resistance level and trail the remainder until trend reverses or closes below 10 or 20 EMA.

Mentioned above are the examples of bullish trade. Opposite of this setups can be done for bearish trades.
What is an Example of a Dragonfly Doji Candlestick used in Trading?
Lets understand the Dragonfly Doji Candlestick using a real time example of stock Industower.
After a strong uptrend from Nov 23 to Jul 24, stock went under sideways movement. During these sideways moves, stock has been continually taking support from 309 to 318 price level multiple times.

On 1st September 25, stock fell sharply and again came to the same support zone which he had already tested 4 times previously. This time again buyers supported the fall and stock formed a Dragonfly Doji candle pattern. The formation of this pattern on the support zone is a good indication of trend reversal from bearish to bullish.

On 8th September 25, the confirmation candle gave a strong closing above the high of Dragonfly Doji, confirming the reversal. Stochastic RSI also gave a buy signal supporting the Dragonfly Doji.
This is how you could have identified the Dragonfly Doji and entered the trade after the confirmation candle closed above high of Doji.
How to Confirm/Avoid False Signals for Dragonfly Doji?
To confirm the Dragonfly Doji and avoid false signals, traders should combine price action, volume, indicator readings, and confluence major support/resistance and trend structures.
- Based on Price: Wait for the next candle to close above the high of Dragonfly Doji, showing genuine bullish interest. Also watch for breaks of structure, such as crossing a minor resistance or previous swing high.
- Based on Volume: Ensure the volume should be more than an average volume on Doji candle or confirmation candle. This high volume suggests institutional or strong participant interest.
- Based on Indicator: Use indicators for confirmation such as RSI crossing above 50, or MACD giving bullish crossover or price rejecting and forming Dragonfly Doji from lower bollinger band.
- Confluence with technical level: Look if Dragonfly Doji is supported by multiple technical factors, such as support, resistance, trendline, moving averages, Fibonacci retracement, or market breadth confirmation. These setups with multiple confluences have higher reliability.
By combining these confirmation signals, traders dramatically reduce the risk of false Dragonfly Doji entries and improve the reliability of their setups.
How to Backtest the Success Rate of Dragonfly Doji?
There are five major steps to backtest the success rate of Dragonfly Doji. The steps are
1. Rules Definition
Start by defining the exact criteria for identifying a Dragonfly Doji
- Candle structure: Open = Close (difference ≤ 10% of total range) with a long lower shadow at least 2× the body size and very small or no upper shadow.
- Context: It must appear after a decline (e.g., previous 3–5 candles bearish).
- Confirmation rule: Next candle must close above the Dragonfly Doji’s high to trigger a buy signal. With stop loss below Doji low and take profit of 2R or trailing stop.
2. Datasets & Tools
Use backtesting platforms or coding tools suited for historical data testing:
- TradingView Pine Script: Easiest for visual strategy creation and forward validation.
- Python (pandas + Backtrader): For professional quantitative backtesting with custom rules and metrics.
- Amibroker: For fast historical scans and large dataset backtests.
You’ll need OHLCV data for your target asset (e.g., stocks, forex, crypto) across multiple timeframes.
3. Metrics to Report
After running the backtest, focus on key performance metrics to gauge pattern effectiveness:
- Win rate (%): Proportion of profitable trades.
- Average win/loss: Mean gain vs. mean loss per trade.
- Profit factor: Ratio of gross profit to gross loss (above 1.5 is solid).
- Expectancy: Average expected return per trade = (Win% × Avg Win) – (Loss% × Avg Loss).
- Max drawdown: Largest peak-to-trough equity drop.
- Average holding period: Helps identify if the pattern works better short-term or swing.
4. Regime Testing
Evaluate the pattern under different market regimes and conditions to understand consistency
- Market trends: Use moving averages or ADX filters to filter bullish, bearish, and sideways markets.
- Asset classes: Equities, forex, commodities, or crypto
- Timeframes: Test from 5-min to daily or weekly to see where reliability peaks.
This ensures the Dragonfly Doji isn’t just curve-fitted to one condition.
5. Robustness Testing
Finally, validate the stability and reliability of your results
- Walk-forward testing: Re-train and test your parameters on new data segments.
- Out-of-sample (OOS) validation: Hold back part of your data to verify true predictive power.
- Parameter sensitivity: Adjust body/wick ratio thresholds to see if performance remains consistent.
Robustness checks prevent false confidence and reveal whether the Dragonfly Doji’s edge holds across markets and timeframes.
How Accurate is the Dragonfly Doji Candlestick in Technical Analysis?
The Dragonfly Doji candlestick pattern accuracy is moderate in technical analysis, as an indicator of possible shift in trend, especially a bullish shift in trend. Its accuracy is largely context dependent like market conditions, period and corroboration by other indicators or price action.
A statistical backtest data by Barry D. Moore CFTe on Dow Jones stocks with a 20-year history indicated that about 55.3% of bullish trades are successful following Dragonfly Doji with small average returns of approximately 0.46% over 10 days to hold.

Its accuracy improves significantly when coupled with confirmation signals such as volume spikes, RSI oversold readings, and subsequent bullish candles.
What is the Best Timeframe to Trade using Dragonfly Doji?
The Dragonfly Doji is effective across all the timeframe, from 1 min for scalping to weekly chart for swing traders. However, its reliability increases significantly on a higher timeframe, such as 4 hrs, Daily and weekly because they filter out market noise and reflect a broader market consensus.
| Trading Style | Best Timeframe | Reliability | Ideal Use |
| Scalping | 5–15 min | Moderate | Short-term intraday reversals |
| Swing Trading | 1H – Daily | High | Trend reversals or pullbacks |
| Position Trading | Weekly – Monthly | Very High | Long-term bottoms or accumulation zones |
Daily and weekly charts are generally the best for the Dragonfly Doji due to their stronger signals, but shorter intraday frames can be used effectively with the right confirmations.
What are the Benefits vs Limitations of a Dragonfly Doji?
The benefits and limitations of Dragonfly Doji are mentioned below in the table.
| Benefits | Limitations |
| Signals potential trend reversal, especially after a downtrend | Not 100% reliable; requires confirmation |
| Helps identify entry and exit points | Can produce false signals in volatile or choppy markets |
| Indicates market indecision and battle between buyers and sellers | Signal strength varies by timeframe and market context |
| Assists in setting stop-loss levels for risk management | Less effective as a standalone indicator |
| Useful in spotting support and resistance zones | Needs to be combined with other technical tools (e.g., RSI, volume) |
| Versatile across different market conditions, with contextual interpretation | Confirmation requires subsequent price action or indicator support |
How Effective is a Dragonfly Doji Candlestick in Technical Analysis?
The effectiveness of Dragonfly Doji candlestick in technical analysis is high, but not when used alone. Also, its reliability heavily depends on market context, such as different market conditions, timeframe, volume and other technical indicators.
Where does a Dragonfly Doji Candlestick Pattern is Commonly used?
The Dragonfly Doji Candlestick Pattern is commonly used at the bottom of a downtrend, at support levels or demand zones and during a pullback in an uptrend.
- At the Bottom of a Downtrend (Bullish Reversal Zone): The Doji is used at the bottom of a downtrend because it reflects a shift in momentum from selling to buying. After sustained selling pressure, this pattern shows that buyers are stepping in, signaling a possible trend reversal upward.
- At Support Levels or Demand Zones: It is also applied by traders on support levels as it helps them to confirm that buying interest is coming back at a known strong price level. It graphically depicts that there is support, which is holding, and traders are confident to go into long positions.
- During a Pullback in an Uptrend: It is applied in this region since it assists in determining the completion of a correction in a higher bullish trend. The occurrence of the Dragonfly Doji at the low of a pullback will indicate that buyers are taking over and traders will be able to join the uptrend once again.
- In Conjunction with Indicators: Traders use it alongside indicators to filter out false signals. When a Dragonfly Doji aligns with bullish divergence, moving average support, or volume spikes, it confirms strong buyer intent, improving trade accuracy and confidence.
The Dragonfly Doji is commonly applied at downtrend bottoms, support zones, pullbacks in uptrends, and alongside technical indicators to improve trade accuracy and risk management.
What are Other types of Doji Candlestick Patterns besides Dragonfly Doji?
Types of Doji Candlestick besides Dragonfly Doji include standard doji, gravestone doji, long-legged doji and four-price doji.
| Type | Appearance | Sentiment | Typical Meaning |
| Standard Doji | Small body, equal shadows | Neutral | Market indecision |
| Gravestone Doji | Long upper shadow | Bearish | Sellers took control |
| Long-Legged Doji | Long upper & lower shadows | Neutral–Volatile | Uncertainty before a big move |
| Four-Price Doji | Horizontal line | Neutral | No movement, very low volume |
Each type of Doji indicates varying degrees of market indecision and potential reversal points, with confirmation from following price action being essential for trading decisions.
What Candlestick Patterns are Similar to Dragonfly Doji?
Candlestick patterns similar to Dragonfly Doji include hammer, inverted hammer, gravestone doji, and spinning top.
- Hammer: Both have long lower shadows and a small real body at the top. Both indicate buyer rejection of lower prices and potential bullish reversal after a downtrend. The only difference they have is Hammer has a small visible body, whereas the Dragonfly Doji has virtually no body.

- Inverted Hammer: Both are single candlestick reversal patterns. It shows that the buyers tried pushing the price higher but failed.

- Gravestone Doji: Structurally, it is inverse of Dragonfly Doji, means long upper shadow instead of lower and it signals bearish reversal.

- Spinning Top: Both indicate indecision in the market and possible trend reversal when formed after a strong momentum. They indicate tug of war between bulls and bears where long lower shadow still indicates strong bulls.

These patterns are part of the broader family of Doji and reversal candlesticks used to interpret market sentiment shifts.
What is the Opposite of Dragonfly Doji Candlestick?
The opposite of Dragonfly Doji Candlestick is Gravestone Doji Candlestick. The Gravestone Doji forms during the uptrend at the top, indicating buyers pushed prices high during the period but sellers regained control, driving the price back down to the open. This trend is an indicator of a potential bearish turnabout.
The Key difference between Dragonfly Doji and Gravestone Doji is mentioned below in the table.
| Aspect | Dragonfly Doji | Gravestone Doji |
| Shape | “T”-shaped | Inverted “T”-shaped |
| Signal Type | Bullish reversal | Bearish reversal |
| Market Phase | After downtrend | After uptrend |
| Sentiment | Buyers regain control | Sellers regain control |
What is the Difference between Dragonfly Doji and a Hammer Candlestick?
The difference between Dragonfly Doji and a Hammer Candlestick lies in their structure, function wise they both are similar, indicating bullish reversal.
| Criteria | Dragonfly Doji | Hammer Candlestick |
| Body | Almost no real body; open, high, and close are nearly the same | Small real body positioned near the top of the candle |
| Shadows | Long lower shadow, little to no upper shadow | Long lower shadow, minimal or no upper shadow |
| Market Sentiment | Reflects indecision, but hints at a bullish reversal if confirmed | Shows strong buying pressure, signaling potential bullish reversal |
| Formation Context | Forms after a downtrend, suggesting a possible reversal but needs confirmation | Forms after a downtrend, showing clear buyer dominance and stronger reversal potential |
| Confirmation | Requires a bullish candle closing above the Doji high for validation | Strengthens with higher volume and a bullish close afterward |
| Signal Strength | Moderate: indicates possible reversal through market indecision | Stronger: confirms bullish reversal through decisive price action |
A Dragonfly Doji reveals market hesitation before a potential turnaround, while a Hammer shows active buying pressure and stronger confirmation of reversal.


 Previous Article


![15 Investing.com Alternatives [Free+Paid] You Should Use in 2026](https://www.strike.money/wp-content/uploads/2026/04/Investing.com-Alternatives.jpg "15 Investing.com Alternatives [Free+Paid] You Should Use in 2026 42")
![15 TradeStation Alternatives [Free+Paid] You Should Use in 2026](https://www.strike.money/wp-content/uploads/2026/04/TradeStation-Alternatives.jpg "15 TradeStation Alternatives [Free+Paid] You Should Use in 2026 43")
![15 Chartink Alternatives [Free+Paid] You Should Use in 2026](https://www.strike.money/wp-content/uploads/2026/04/Chartlink-Alternatives.jpg "15 Chartink Alternatives [Free+Paid] You Should Use in 2026 44")
: Overview, 10 Types of Indicators, Settings for Different Markets 45")


 : Definition, Formula, calculation, Uses, Advantages Vs limitations 48")


: How We Used This 70/30 Indicator in 6 High Win-rate Strategies 51")


No Comments Yet.