The Long Legged Doji is a neutral candlestick formation that indicates market indecision. The long-legged Doji is distinguished by a long upper and lower shadow, as well as a small real body in the centre. Long shadows indicate significant price movement during the period, with buyers and sellers pushing the price up and down. The small real body demonstrates that the opening and closing prices were extremely close, indicating that there was no clear winner in the battle between buyers and sellers.
The long-legged doji pattern has the advantage of signaling a potential price reversal. The pattern is formed when the opening and closing prices are the same and there is significant price movement during the trading session. This indicates market indecision and may result in a price reversal. The long-legged doji pattern has the disadvantage of signaling continued price volatility. Price movements become unpredictable if the market remains indecisive and swings back and forth between bullish and bearish sentiment. making it difficult for traders to make informed decisions. Long-legged doji patterns are also uncommon, making them difficult to recognise and act on.
What is a Long Legged Doji?
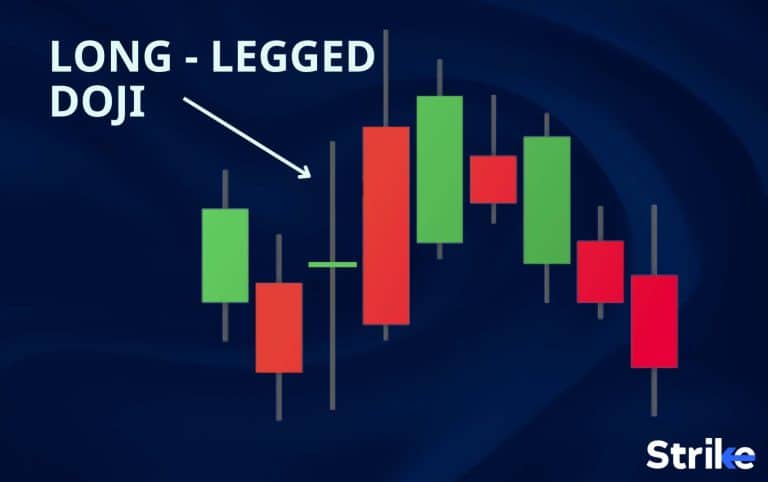
A Long Legged Doji is a type of Doji candlestick pattern with longer wicks that indicate a price reversal. The Long Legged Doji has long upper and lower shadows, indicating that there was significant price movement during the period. The below image depicts how the pattern looks,

The Long Legged Doji is significant because it signals indecision in the market. Buyers and sellers were actively buying and selling during the period, but the open and closed prices were the same, indicating that neither side was able to gain the upper hand. This can be a valuable signal for traders, as it indicates that the market may be about to undergo a significant price movement.
How is a Long Legged Doji Candlestick Formed?
The Long Legged Doji is formed when the opening and closing prices are almost exactly the same, creating a small real body in the middle of the candlestick. The Long Legged Doji has long upper and lower shadows, indicating significant price movement during the period, unlike other Doji formations.
Let’s say that you are an investor who is analyzing the stock prices of a particular company over a one-day period. The opening price of the stock was Rs. 500, and it fluctuated throughout the day before closing at Rs. 500 again. But the stock’s price went as high as Rs. 550 and as low as Rs. 450 during the day, indicating a lot of volatility in the market. A long legged doji will be formed in such a situation similar to the one below.

The long shadows here occur when buyers and sellers are actively buying and selling, pushing the price up and down. But neither side is able to gain the upper hand, resulting in a neutral candlestick formation despite this movement.
What Does Red Long Legged Doji Candlestick Indicate?

A red Long-Legged Doji candlestick appears when the closing price is lower than the opening price. This indicates that sellers were able to lower the price during the period, but were ultimately unable to gain the upper hand. The long shadows indicate that there was significant price movement during the period, but the small real body indicates that neither buyers nor sellers were able to gain control. A red Long Legged Doji is a valuable signal for traders because it indicates that the market is about to undergo a significant price movement. The candlestick followed by a bullish candlestick indicates that buyers have taken control and the price is about to rise. It followed by a bearish candlestick indicates that sellers are still in control and the price is about to fall.
What Does Green Long Legged Doji Candlestick Tell?
A green Long-Legged Doji candlestick forms when the closing price is higher than the opening price. This indicates that buyers were able to raise the price during the period, but were ultimately unable to gain a competitive advantage. The long shadows indicate significant price movement during the period, but the small real body indicates that neither buyers nor sellers were able to gain control. A green Long Legged Doji can indicates that the market is about to experience a significant price movement. The candlestick followed by a bearish candlestick could mean that sellers have taken control and the price is about to fall. Long legged doji followed by a bullish candlestick indicates that buyers remain in control and the price is about to rise.
Does It Matter if A Long Legged Doji Candlestick Is Red or Green?
Yes, the color of the long legged doji helps in understanding the market situation better. The colour of a Long Legged Doji candlestick is determined by the relationship between the opening and closing prices. A red Long Legged Doji occurs when the closing price is lower than the opening price, while a green Long Legged Doji occurs when the closing price is higher than the opening price. The most important aspect of the Long Legged Doji formation is the long upper and lower shadows and the small real body while the color of the candlestick can provide some additional information about market sentiment. These indicate that there was significant price movement during the period, but no clear winner in the battle between buyers and sellers.
When Does Long Legged Doji Candlestick Happen?
The Long Legged Doji formation occurs at any time during the market, but it’s most significant when it occurs after a strong price movement. This indicates that the market is unsure of its direction and may be about to undergo a significant price movement. The Long Legged Doji also occurs during periods of consolidation, when the market is trading in a narrow range. The Long Legged Doji can indicate that the market is about to break out of its range and undergo a significant price movement in this case.
How Often Does Long Legged Doji Candlestick Occur?
The frequency of Long Legged Doji candlestick formations is determined by the market and timeframe under consideration. But the Long Legged Doji is a relatively uncommon candlestick formation, occurring less frequently than the Hammer or the Engulfing Pattern. The Long Legged Doji’s rarity makes it a more significant signal for traders though. It is an useful indicator that the market is about to experience a significant price movement.
How to Read Long Legged Doji Candlestick in Technical Analysis?
Traders can use the Long Legged Doji formation in two main ways in technical analysis. A Long Legged Doji occurring after a strong price movement indicate that the market is about to reverse direction. Traders use this signal to enter a position that profits from the anticipated price movement.
Long Legged Doji occuring during a period of consolidation indicates that the market is about to break out of its range. Traders can use this signal to enter a position that profits from the anticipated price movement.
The long-legged doji candlestick pattern is interpreted as a sign of market indecision. The long-legged doji pattern is frequently interpreted as a potential reversal signal when it appears after a prolonged uptrend or downtrend. This is due to the fact that the pattern suggests that the trend may be losing momentum and that a change in direction is possible.
Traders frequently seek confirmation of the long-legged doji pattern by observing price movement during technical analysis in the opposite direction of the preceding trend. This can add to the evidence that a reversal is taking place.
How accurate is the Long legged Doji Candlestick in Technical Analysis?
The long-legged doji pattern’s accuracy varies depending on the timeframe under consideration. A long-legged doji pattern on a daily chart, for example, is more significant than one on a 5-minute chart. Looking for additional confirmation signals, such as trendline breaks or support/resistance levels, improves the accuracy of the long-legged doji pattern. These signals can help to validate the long-legged doji pattern’s potential reversal.
How reliable is a Long legged Doji Candlestick in Technical Analysis?
A long-legged doji pattern is considered reliable when it occurs after a prolonged uptrend or downtrend and is confirmed by other technical indicators or patterns. It can be considered more reliable if the long-legged doji pattern appears at a key support or resistance level or is accompanied by a trendline break, for example. The timeframe being studied can influence the reliability of the long-legged doji pattern. The pattern may be more reliable on a daily or weekly chart than on a shorter timeframe chart.
When is the best time to Trade using Long legged Doji Candlestick?
The best time to trade the long-legged doji candlestick pattern is determined by your trading strategy and timeframe. Longer timeframes, such as daily or weekly charts, where the signals are more significant and the noise is lower, makes the long-legged doji pattern more reliable. Shorter timeframes, on the other hand, are used if traders are aware of the increased noise and volatility that can occur.
What is an example of a Long legged Doji Candlestick used in Trading?
Suppose a trader is observing the daily chart of State Bank of India (SBI) stock and observes the formation of a long-legged doji candlestick pattern following an extended rally. The trader also sees that the formation of a long-legged doji at a crucial resistance level suggests a potential trend reversal. The trader examines further technical indicators and observes that the RSI (Relative Strength Index) indicates that the stock is overbought, signalling that a pullback is imminent.
The trader decides to enter a short position on SBI stock based on this analysis, predicting a possible decline. The trader places a stop-loss order above the resistance level and sets a profit objective at the following support level.
The stock price of SBI begins to decrease during the next few trading sessions, confirming the long-legged doji pattern and the trader’s thesis. The trader closes the position at the profit target, completing a profitable transaction.
Where does a Long legged Doji is commonly used?
The Long-Legged Doji candlestick pattern is often used in technical analysis of financial markets, especially when trading stocks, forex, and futures. The pattern is used to identify potential market trend reversals, particularly after an extended uptrend or slump. Traders make informed trading decisions using the Long-Legged Doji pattern in conjunction with other technical indicators and analytical tools.
How to Trade with Long legged Doji Candlestick in Stock Market?
An investor trades using the Long Legged Doji using six steps. Below listed are those six steps.
- Identify the pattern
The first step is to spot the pattern in the price graph.
- Identify the trend direction
Take a close look at the doji to understand whether it shows a bullish or bearish reversal.
- Confirm with an indicator
Use a technical indicator like RSI to confirm the trend reversal and its direction.
- Enter the trade
Buy the stock when the opportunity arises. It is important to be timely in this step especially.
- Monitor the trade
Monitor the trend closely. This is to identify when to exit the trade.
- Exit the trade
Exit the trade when the stock has reached its maximum potential. You can use a technical indicator here for signals.
It is also advisable to use stop-loss to ensure you don’t encounter any losses, along with the six steps mentioned.
Is a Long legged Doji in An Uptrend a Sell Signal?
No, a Long-Legged Doji in an uptrend is not necessarily a sell signal, as it can indicate that the stock market is in a state of indecision and a potential trend reversal may occur.
What are the advantages of a Long legged Doji Candlestick?
The main advantage of long legged doji candlesticks patterns is that they help identify entry and exit points. Below are five main advantages of the pattern.
- Offers Market Sentiment Insights
The long-legged candlestick pattern is a valuable indicator of market sentiment. This pattern allows traders to determine whether the market is bullish or bearish. Long-legged candlesticks with a long upper shadow denote a bearish market, and long-legged candlesticks with a long lower shadow denote a bullish market.
- Signals Possible Reversals
Long-legged candlestick patterns indicate possible market reversals. The appearance of a long-legged candlestick pattern in an uptrend suggests that the bulls are losing momentum and the bears are gaining strength. the appearance of a long-legged candlestick pattern in a downtrend suggests that the bears are losing momentum and the bulls are regaining dominance.
- Helps identify entry and exit points
Long-legged candlestick patterns can offer distinct entry and exit opportunities to traders. Traders can utilise the peak or bottom of a long-legged candlestick as support or resistance levels, respectively. They can enter a trade when the price breaks above the long-legged candlestick’s high and exit when the price falls below the long-legged candlestick’s low.
- Aids in Validating Other Technical Indicators
Long-legged candlestick patterns can also be utilised to confirm the validity of other technical indicators. For instance, the probability of a bearish reversal increases if a long-legged candlestick pattern coincides with a negative divergence in the RSI indicator.
- Compatible with Various Timeframes
Long-legged candlestick patterns are effective across several timeframes, including intraday trading and long-term investing. Traders may evaluate the price fluctuations of securities across multiple timeframes and make informed judgments.
It is more advantageous to use the pattern along with a technical indicator to confirm your traders. A volume-based indicator provides the most value here.
What are the disadvantages of a Long legged Doji Candlestick?
Long-legged candlestick patterns have their drawbacks and limitations. Below are four of the key drawbacks of long-legged candlestick patterns.
1. False Signals
False signals could be generated by long-legged candlestick patterns, which is one of its key drawbacks. Traders must use caution with this pattern and seek more confirmation to avoid this.
2. Needs Experience and Expertise
Utilizing candlestick patterns with long legs demands experience and skill. Traders must comprehend the complexities of this pattern and how it functions under various market conditions. This pattern may be difficult for novice traders to employ efficiently.
3. Not Appropriate for All Securities
Long-legged candlestick patterns might not be appropriate for all assets. This pattern is most effective with highly liquid assets experiencing considerable price fluctuations. The pattern may not provide precise signals In the case of illiquid assets.
4. Can Be Confusing
Long-legged candlestick patterns might be perplexing, especially for newbies in trading. The pattern has variations, and traders must comprehend each variation in order to employ it properly.
Traders can effectively utilize this pattern to make informed trading decisions by using caution and seeking additional confirmation.
What is the Opposite of Long legged Doji Candlestick?
Spinning Top candlesticks are the opposite of Long-Legged Doji candlesticks. Spinning Top has a little real body and extended upper and lower shadows similar to the Long-Legged Doji. But the Spinning Top has a real body that is not always located in the centre of the candlestick, unlike the Long-Legged Doji. Look at the image below.

A Spinning Top candlestick pattern is neutral and shows market hesitation. It implies that neither the bulls nor the bears are in charge, and is sometimes viewed as an indication of a possible trend reversal. The Spinning Top candlestick pattern becomes prominent after a prolonged upswing or downtrend. The Spinnining top coming after an advance implies the bulls are losing momentum and that a trend reversal may be forthcoming. It coming after a decline implies that the bears are losing momentum and that a trend reversal may be near.
What are other types of Doji Candlestick Patterns besides Long legged Doji?
There are five other main types of Doji candlestick patterns besides the Long-Legged Doji. Below are some details about the same.
Gravestone Doji

This pattern has a long upper shadow and no lower shadow, with the open and close near the low of the candlestick. It suggests that the bears are in control and a trend reversal may occur.
Dragonfly Doji

This pattern has a long lower shadow and no upper shadow, with the open and close near the high of the candlestick. It suggests that the bulls are in control and a trend reversal may occur.
Four-Price Doji

This pattern has open, high, low, and close at the same price. It suggests that the market is in a state of equilibrium and a potential trend reversal may occur.
Northern Doji

This pattern has a long upper shadow and a short lower shadow, with the open and close near the low of the candlestick. It suggests that the bears are in control and a trend reversal may occur.
Southern Doji

This pattern has a long lower shadow and a short upper shadow, with the open and close near the high of the candlestick. It suggests that the bulls are in control and a trend reversal may occur.
What Candlestick Pattern is Similar to Long legged Doji Candlestick?
The Neutral/Rickshaw Man pattern is a similar pattern that traders and technical analysts use in identifying potential trend reversals and market sentiment. The Neutral/Rickshaw Man pattern has a small real body with long upper and lower shadows, just like the Long-Legged Doji. However, unlike the Long-Legged Doji, the Neutral/Rickshaw Man pattern has a real body that is located in the center of the candlestick. Look at the picture below.

Is Long legged Doji a bullish reversal pattern?
No, long legged doji is not considered a bullish reversal pattern by itself. It could signal a potential bullish reversal if it is followed by a bullish candle.
What is the difference between Long legged doji and Dragonfly Doji?
Shadow location is the main difference between the Long-Legged Doji and the Dragonfly Doji. The Long-Legged Doji features extended upper and lower shadows, which indicates market uncertainty. The Dragonfly Doji has a long lower shadow and little or no upper shadow, indicating that buyers were able to drive the price higher from the opening price to close at or near the day’s high. The Dragonfly Doji coming after a downtrend is considered a bullish reversal pattern, but the Long-Legged Doji indicates indecision and could herald a potential reversal when paired with other candlestick patterns.
What is the difference between Long legged doji and Gravestone Doji?
The main difference between the Long-Legged Doji and the Gravestone Doji is where their shadows fall. The Long-Legged Doji is characterised by extended upper and lower shadows, signifying market uncertainty. The Gravestone Doji, on the other hand, has a large upper shadow and little or no lower shadow, indicating that sellers were able to push the price lower from the open to close near the day’s low.


 Previous Article


![15 Investing.com Alternatives [Free+Paid] You Should Use in 2026](https://www.strike.money/wp-content/uploads/2026/04/Investing.com-Alternatives.jpg "15 Investing.com Alternatives [Free+Paid] You Should Use in 2026 106")
![15 TradeStation Alternatives [Free+Paid] You Should Use in 2026](https://www.strike.money/wp-content/uploads/2026/04/TradeStation-Alternatives.jpg "15 TradeStation Alternatives [Free+Paid] You Should Use in 2026 107")
![15 Chartink Alternatives [Free+Paid] You Should Use in 2026](https://www.strike.money/wp-content/uploads/2026/04/Chartlink-Alternatives.jpg "15 Chartink Alternatives [Free+Paid] You Should Use in 2026 108")
: Overview, 10 Types of Indicators, Settings for Different Markets 109")


 : Definition, Formula, calculation, Uses, Advantages Vs limitations 112")


No Comments Yet.