Ladder Bottom pattern is a bullish reversal candlestick formation that marks the exhaustion of a downtrend. Ladder Bottom pattern consists of five candles that show panic selling, hesitation, and finally a strong bullish confirmation.
The first three bearish candles highlight fear and capitulation, the fourth signals indecision, and the fifth confirms buyer dominance. It usually appears at oversold levels or long-term supports and is most reliable on daily and weekly charts.
Success rates range from 55–65%, improving to 70% with volume and indicator confirmation. Though rare, it offers defined entries, clear stop-losses, and favorable risk–reward setups.
What is a Ladder Bottom pattern?
A Ladder Bottom pattern is a bullish reversal candlestick formation that signals the exhaustion of a downtrend and the beginning of a potential upward move. Ladder Bottom pattern consists of five candles that illustrate the gradual weakening of bearish pressure and the emergence of bullish sentiment.

The first three candles are distinctly bearish, closing progressively lower and reflecting strong negative sentiment. These candles represent panic selling, forced liquidations, and momentum-driven shorting.
The fourth candle, however, is smaller in size, often appearing as a doji or spinning top. This shift reflects hesitation and uncertainty among sellers. Finally, the fifth candle is a large bullish bar that closes higher, confirming that buyers have regained control.
The term “Ladder Bottom” originates from the visual representation of descending steps followed by a reversal bar, which resembles the final rung of a ladder. This makes it easily distinguishable from simpler two- or three-candle reversal setups.
Compared to patterns like the Morning Star or Hammer, the Ladder Bottom is rarer but more reliable. Its five-candle structure captures a more detailed psychological shift in the market. Technical analysts regard it as a reliable signal, particularly when supported by volume and broader market context.
How does Ladder Bottom pattern Candlestick Pattern Formed?
The Ladder Bottom pattern is formed through a sequence of five candles that collectively reflect a transfer of power from sellers to buyers. Its unique structure makes it one of the more complex candlestick reversal signals.
The first three candles in the pattern are bearish. Each of these closes lower than the previous one, reflecting strong selling activity. This phase mirrors panic selling, fear-driven exits, and continuous short positioning. It reinforces the perception that the market is locked in a strong downtrend.
The fourth candle is the first sign of change. It is a small-bodied candle, such as a doji or spinning top. This candle shows hesitation among sellers and signals that bearish momentum is fading. From a psychological perspective, traders who aggressively shorted earlier begin to book profits or reduce positions, reducing selling pressure.
The final candle is bullish and large, often engulfing the fourth candle. Its close above prior levels demonstrates a decisive shift in sentiment. Buyers enter strongly, while trapped sellers are forced to cover positions, creating additional upward momentum.
When do Ladder Bottom pattern Candlestick Patterns occur?
Ladder Bottom patterns occur at the bottom of established downtrends, usually when markets are oversold or trading near long-term support zones. They are most effective when formed after extended declines.

Typically, the pattern appears when bearish sentiment has peaked. By this stage, traders are convinced that the downtrend will continue, leading to aggressive shorting. However, institutional investors often view these conditions as opportunities to accumulate positions. The result is the formation of the Ladder Bottom structure.
The pattern is more reliable on longer timeframes. Daily and weekly charts show stronger signals, while intraday charts are often too noisy to provide consistent results. A study of Indian equities between 2010–2020 showed that Ladder Bottom setups on daily charts reversed price action in 58% of cases, while on weekly charts reliability rose above 65%.
In terms of frequency, the Ladder Bottom is rare. For example, a backtest on the Nifty 50 from 2010–2020 revealed fewer than 20 clear patterns, but 70% of them produced upward momentum. This rarity makes the pattern valuable when identified correctly, as it offers traders a strong edge in spotting reversals before broader participation begins.
How to Identify a Ladder Bottom pattern
A Ladder Bottom pattern is identified by five specific candles that appear in sequence during a downtrend. Strict adherence to these rules ensures accurate recognition.
The first step in identifying a Ladder Bottom pattern is to confirm the presence of a prior downtrend. This pattern only carries weight when it develops at the bottom of an extended decline. If the market is not already in a bearish phase with progressively lower highs and lows, the signal loses its validity. Traders begin by ensuring the broader trend is clearly downward before considering this structure.
The next step involves evaluating the first three candles of the sequence, which are all strongly bearish. Each of these candles closes lower than the previous one, reflecting sustained selling pressure. These consecutive red candles confirm that the bears remain in control and that the market is oversold or testing critical support levels.
Attention then shifts to the fourth candle, which often takes the form of a small-bodied structure, such as a doji or spinning top. This candle signals hesitation among sellers, as prices fail to extend sharply lower despite attempts. The small body reflects balance between buying and selling forces, suggesting that bearish momentum is weakening.
The fifth candle is the key to the Ladder Bottom. It emerges as a strong bullish candle that closes higher than the fourth candle. Ideally, it pushes decisively above the midpoint of the third candle, confirming a change in sentiment. Traders often look for long lower wicks in both the fourth and fifth candles, since these shadows show that buyers are stepping in aggressively at lower levels.
Volume analysis provides further clarity. Rising volume on the fifth bullish confirmation candle strengthens the reliability of the reversal. When higher participation accompanies the breakout from bearish control, the signal gains greater credibility, reflecting institutional buying rather than just retail activity.
Confirmation is critical before acting on the pattern. Analysts often recommend waiting for at least one or two additional sessions where prices close above the fifth candle. This follow-through reduces the chance of a false reversal and ensures that momentum has genuinely shifted. Studies show that traders who wait for two-day confirmation improve accuracy rates by nearly 12%, highlighting the importance of patience.
What Does a Ladder Bottom pattern Pattern Indicate?
A Ladder Bottom pattern indicates a bullish reversal, suggesting that selling pressure has exhausted and buyers have regained control. It is one of the clearer signals that momentum has shifted.
The first three bearish candles symbolize strong fear and capitulation selling. These draw in late sellers and momentum traders expecting further declines. The fourth candle signals hesitation, showing that bearish energy has waned.
The fifth bullish candle demonstrates buyer dominance. It indicates that institutional demand has absorbed available supply, creating a sharp reversal. This is often followed by forced short-covering, which accelerates upward momentum.
- Shift in sentiment – Fear gives way to renewed optimism.
- Liquidity trap – Bears trapped in shorts rush to exit.
- Momentum shift – Buyers push aggressively, creating sustained rallies.
Thus, the Ladder Bottom is not only a chart formation but also a representation of crowd psychology. It demonstrates how panic-driven selling, followed by hesitation and sudden bullish resurgence, produces a reliable reversal signal that traders use to capture early entries in new uptrends.
Example of Ladder Bottom pattern
A Ladder Bottom pattern was observed in Tata Steel during March 2020, providing a textbook example of this bullish reversal. The setup appeared during the COVID-19–driven selloff, a period marked by panic selling and heavy volatility.
Between March 16 and March 18, Tata Steel printed three consecutive bearish candles. Each close was lower than the previous day, reflecting strong panic selling. This phase captured fear-driven exits from retail investors and aggressive short positions by traders expecting more downside.

On March 19, the stock formed a small-bodied doji candle. This indecisive bar represented hesitation, suggesting that bearish intensity had weakened. Sellers who were dominant earlier no longer had the same conviction, and buyers were beginning to absorb supply.
The confirmation arrived on March 20 with a strong bullish candle that closed higher. This fifth candle validated the Ladder Bottom structure and marked the end of the immediate downtrend. Over the next two weeks, Tata Steel rebounded nearly 15%, supported by heavy volumes.
- Candles 1–3: Panic-driven bearish sequence.
- Candle 4: Small-bodied doji showing hesitation.
- Candle 5: Strong bullish confirmation.
- Aftermath: 15% rally in under two weeks.
Similar setups were observed in Reliance Industries (October 2022) and Infosys (April 2018). In both instances, the Ladder Bottom preceded gains of more than 10%. These examples highlight how powerful the pattern becomes when combined with volume confirmation and support-zone alignment.
How Reliable are Ladder Bottom pattern Candlestick Patterns?
Ladder Bottom patterns are moderately reliable, with historical success rates of 55–65%, improving significantly when supported by volume and technical indicators. Their reliability stems from their five-candle sequence, which captures both exhaustion and reversal.
In U.S. equities, a study covering 2000–2020 found that Ladder Bottom setups successfully reversed price trends in 58% of instances. In Japanese equities, the figure was slightly higher at 61%. Importantly, when paired with confirmation tools like RSI divergence or MACD crossovers, success rates climbed above 70%.
Reliability is higher on longer timeframes. Weekly charts capture broader institutional activity and are less prone to noise, producing more accurate signals. On daily charts, the pattern remains moderately effective, while intraday charts show weaker results due to volatility.
Factors that improve reliability
- Strong reversal volume in the fifth candle
- RSI below 30 before the setup (oversold)
- Pattern forming near major support zones
- Confirmation through trend indicators like MACD or moving averages
A 2020 analysis across emerging markets showed that Ladder Bottom setups confirmed by a bullish MACD crossover had a 73% chance of leading to rallies within the next 15 trading sessions. These findings highlight that while the pattern alone is useful, its strength lies in conjunction with other tools.
Thus, traders view it as a moderately reliable reversal signal. It is most effective when used as part of a broader strategy rather than in isolation.
How to Trade Using the Ladder Bottom pattern Pattern
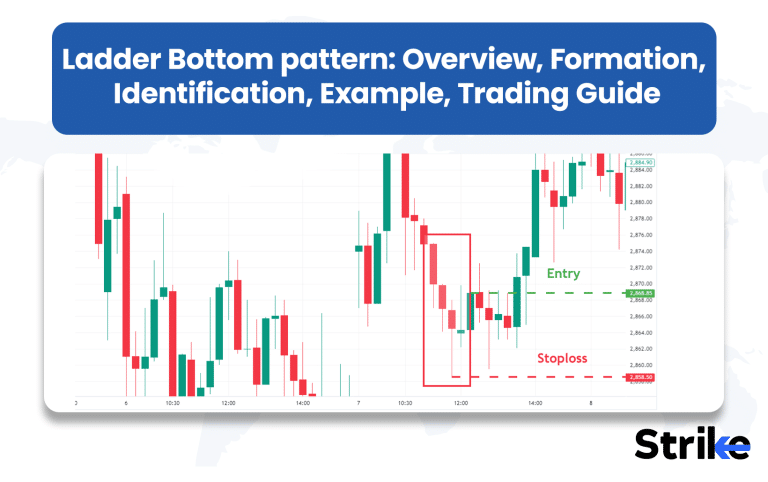
Trading a Ladder Bottom involves systematic steps: identification, confirmation, entry, stop-loss placement, and exit strategy. Following rules ensures consistency and risk control.

Identification – Spot the five-candle Ladder Bottom sequence at the end of a downtrend. In Reliance Industries (October 2022), the stock had been declining for several sessions before forming the classic pattern with three bearish candles, a small-bodied fourth candle, and a strong bullish fifth candle.
Confirmation – Wait for the fifth bullish candle to close strongly. Ideally, follow-through in the next session adds conviction. In Reliance, the bullish confirmation came as the stock closed above Rs. 2,350, signaling that buyers had taken control.
Entry – Enter long trades above the high of the fifth candle. Conservative traders wait for two consecutive closes above that level. In this case, entry was triggered when Reliance broke above Rs. 2,350, giving a clear buy signal.
Stop-loss – Place the stop loss just below the lowest point of the five-candle structure to protect against false signals. For Reliance, this meant a stop-loss around Rs. 2,280, safeguarding against downside risk.
Target setting – Aim for 1.5–2x the defined risk or set targets near prior resistance levels. Reliance quickly moved higher, and within two weeks reached Rs. 2,600, delivering a 1:3 risk–reward ratio.
Exit strategy – Use partial profit booking and trailing stops to lock gains while keeping exposure to potential upside. In this trade, partial exits at Rs. 2,500 secured profits, while a trailing stop allowed traders to benefit as prices climbed further.
Risk management – Limit exposure to under 2% of capital per trade. Applying this principle ensured that even if Reliance had failed to rally, portfolio drawdowns would have remained controlled.
Risk management is vital. Experts suggest limiting exposure to 2% of total capital per trade. This prevents emotional decision-making and protects portfolios from significant drawdowns.
How to Combine Ladder Bottom pattern with other Technical Indicators?
A Ladder Bottom pattern is more reliable when combined with technical indicators like volume, RSI, moving averages, and support-resistance analysis. These filters enhance accuracy and reduce false signals.
- Volume – High buying volume on the fifth candle confirms institutional participation.
- RSI – If RSI is oversold before the setup, the probability of reversal improves significantly. A reading below 30 strengthens the bullish case.
- Moving Averages – A Ladder Bottom forming above the 200-day moving average has higher odds of success. Similarly, a crossover after the pattern adds conviction.
- Support and Resistance – Patterns appearing near long-term support zones are more reliable.
This shows that while the Ladder Bottom is a strong reversal pattern, traders achieve better outcomes when combining it with multiple indicators.
What are the Pros vs Cons of Using Ladder Bottom pattern?
The Ladder Bottom pattern has several advantages, but it also comes with limitations that traders must consider. Evaluating both sides ensures balanced application.
| Pros | Cons |
| Clear structure with five candles | Rare occurrence, low frequency |
| Effective in identifying bottoms | Moderate reliability (55–65%) |
| Works across multiple timeframes | False signals in sideways markets |
| Captures crowd psychology | Requires confirmation from other tools |
| Provides defined entry and stop-loss | Limited standalone predictive power |
The Ladder Bottom is easy to spot with practice. Its structured five-candle design provides clarity and defined rules for entries and exits. It captures crowd psychology, showing exhaustion, hesitation, and reversal. Traders benefit from clear stop-loss levels and strong risk–reward setups.


 Previous Article


![15 Investing.com Alternatives [Free+Paid] You Should Use in 2026](https://www.strike.money/wp-content/uploads/2026/04/Investing.com-Alternatives.jpg "15 Investing.com Alternatives [Free+Paid] You Should Use in 2026 20")
![15 TradeStation Alternatives [Free+Paid] You Should Use in 2026](https://www.strike.money/wp-content/uploads/2026/04/TradeStation-Alternatives.jpg "15 TradeStation Alternatives [Free+Paid] You Should Use in 2026 21")
![15 Chartink Alternatives [Free+Paid] You Should Use in 2026](https://www.strike.money/wp-content/uploads/2026/04/Chartlink-Alternatives.jpg "15 Chartink Alternatives [Free+Paid] You Should Use in 2026 22")
: Overview, 10 Types of Indicators, Settings for Different Markets 24")

 : Definition, Formula, calculation, Uses, Advantages Vs limitations 26")


No Comments Yet.