Doji candlestick is one of the most important candlesticks for identifying indecision and potential turning points in the market. Doji candlestick is used by traders to gauge shifts in momentum, as it often signals a pause before major trend reversals. Over the years, different variations like the Dragonfly Doji, Gravestone Doji, Long-Legged Doji, and Four-Price Doji have emerged, each revealing a different story about market sentiment and trader psychology.
Historically, the Doji traces its roots back to 18th-century Japanese rice trading, where legendary trader Homma Munehisa used it to interpret crowd behavior and emotions in price action. Even today, despite modern algorithms and indicators, the Doji remains a timeless and reliable tool for traders seeking clarity during market uncertainty.
What is a Doji Candle?
A Doji candle is a candlestick pattern where the opening and closing price of a candle is nearly the same, resulting in a very small or no real body. Doji candles derive their name from the Japanese term ‘Doji’ which means a mistake, or error, referring to the rare chance of a stock or index having an equal opening and closing price.

Is Doji Bullish or Bearish?
Doji is neither bullish nor bearish, it is a neutral candlestick pattern representing indecision or a pause in the market, where buyers and sellers both had no clear control. The meaning of Doji entirely depends on where it forms.
- At the top of an uptrend = Possible bearish reversal
- At the bottom of a downtrend = Possible bullish reversal
- In a sideways market = Just indecision or consolidation
Doji’s true meaning lies in its context, not its shape. It’s the market’s way of saying “Wait and watch”.
Structure of a Doji Candlestick
The structure of a Doji candle includes a small to no body with a long wick on both sides.

- Open and Close: Open in a Doji candle is always the same or nearly the same to its closing, creating a very small body, ideally less than 10% of the total candle range.
- Upper Shadow: The upper shadow or wick showing the highest price reached by the candle.
- Lower Shadow: The lower shadow or wick showing the lowest price reached by the candle.
- Visuals: Doji candles often look like a plus sign (+) or cross sign.
Depending on the variation in length of shadow, the doji’s are different types where each type has subtle differences but shares the core feature of a minimal or no body indicating indecision in the market.
Psychology behind a Doji
Doji candle represents the psychology of market indecision, where buyers and sellers both actively fight to push price in their direction which is reflected in the candle’s wick, but none of them wins, closing price where it was opened, representing indecision, hesitation, or balance of power.

What Does the Doji Indicate?
A Doji essentially indicates indecision and equilibrium between buyers and sellers, where neither side was strong enough to close the candle meaningfully higher or lower than the open. Although it does not suggest trend reversal or trend continuation, but signals that the prior trend is getting weak, meaning a possible trend reversal, pause, or shift in strength may soon occur.
What Are the Types of Doji Candlestick Patterns?
There are six major types of Doji candlestick patterns. The types are standard Doji
1.Standard Doji
Standard Doji Also known as neutral Doji nearly have the same open and close with small upper and lower wicks.

Psychology: A perfect indecision where neither buyers nor sellers are strong.
Signal: Neutral, can lead to reversal or continuation depending on the next candle.
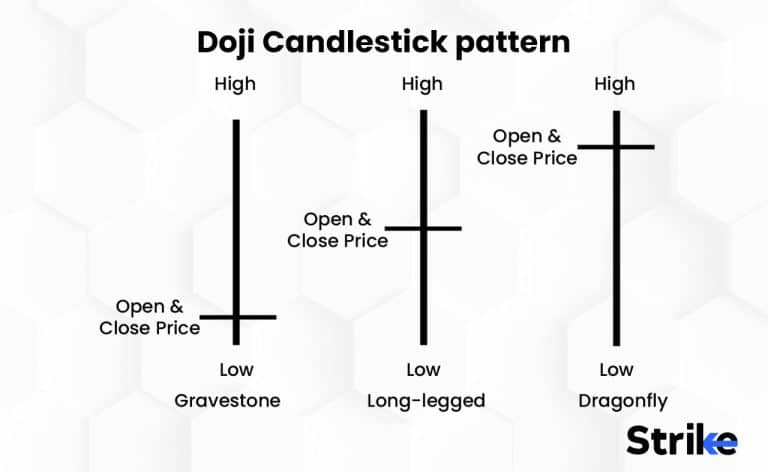
2.Long – Legged Doji
Open and close are nearly the same but the upper and lower wick is very long.

Psychology: Extreme battle between buyers and sellers but no one won.
Signal: Major indecision, often forms before a big breakout or reversal.
3.Dragonfly Doji
In this type, candles open, high, and close prices are nearly identical, with a long lower shadow and a nonexistent or very small upper shadow resembling the “T” shape.

Psychology: Bears try to push the price lower but bulls strongly dominate and pull the price back up.
Signal: Bullish reversal potential, especially at support or after downtrend.
4.Gravestone Doji
In this type, candles open, low, and close prices are nearly identical, with a long upper shadow and a nonexistent or very small lower shadow resembling the inverted “T” shape.

Psychology: Bulls try to push the price higher but bears strongly dominate and drag the price down.
Signal: Bearish reversal potential, especially at resistance or after uptrend.
5.Four-Price Doji
In this type, candles open, high, low, and close are equal. It appears as a single flat line on the chart. Usually seen in low liquidity or dead market phases.

Psychology: Zero volatility, no trading interest and complete market freeze.
Signal: Market indecision
6.Doji Star
A Doji appears after a strong bullish or bearish candle, with a small gap, especially in stocks & forex.

Psychology: Trend is losing strength, pause before decision.
Indication: Potential reversal setup, especially when followed by a strong opposite candle (Morning Star / Evening Star pattern).
Each type varies slightly in appearance and implication but centers around the theme of market indecision and possible trend change signals depending on context and confirmation by subsequent candles.
How to Identify a Doji Candle?
There are three main steps to identify the Doji candle and the steps are mentioned below.
- Look for candles open and close: Look if the candle has the same or almost equal open and close cheating a small body. The real body size should be less than 10% of the total range

- : Doji usually has noticeable wick or shadows, having shadows on both the sides or on one side depending upon the type of Doji.

- Look for Trend or Swing Move: A Doji has significance only when it appears after a clear uptrend or downtrend, indicating indecision or potential reversal.


These checkpoints helps traders identify the presence of a Doji candle accurately, making it a useful tool for predicting potential trend reversals or consolidations
Where Does the Doji Appear in a Chart?
A Doji can technically appear anywhere on the chart, but its importance and meaning depend entirely on where it forms. The key areas where Doji holds a high significance are mentioned below.
In an Uptrend
In an uptrend Doji appears near resistance suggesting buyers are weakening or booking profits. This indicates potential trend reversal from bullish to bearish or pause. But it is important to wait for the next confirmation candle after Doji.

In a Downtrend
In a downtrend, Doji appears near support suggesting sellers are weakening or booking profits. This indicates potential trend reversal from bearish to bullish or pause. But it is important to wait for the next confirmation candle after Doji.

In a Sideways or Range-Bound Market
It forms more often in the sideways market due to less volatility and gives meaningless and weak signals. Traders mostly avoid these Doji unless it forms near key support/resistance.

How Often does the Doji Candlestick Pattern Happen?
Doji candlestick pattern is considered a rare occurrence in candlestick charting and its frequency of occurring differs on different time frames.
- On a higher timeframe such as daily and weekly, the frequency of Doji appearances on charts is rare and often highlights potential turning points or trend reversals.
- Whereas, on lower time frames such as 5-minute or 15-minute charts, Doji appears more frequently especially during low-momentum or lunchtime consolidation.
- During a strong trending phase and high volatility, Doji appears less frequently because buyers or sellers dominate clearly with no chance of indecision.
According to a candles Scanner statistical scan data of daily candles across all S&P 500 stocks, over 20 years, covering more than 2.2 million daily candlesticks, the Bearish Doji Star pattern appeared in 0.46% to 0.50% of all candlestick formations.
What Timeframe is Best for Doji?
The best timeframe for Doji is a higher timeframe like daily and weekly due to their reliability to identify meaningful Doji signals.
Daily and Weekly Timeframes
- In this timeframe Doji formation is less frequent but more significant, as they filter out market noise and often signal important trend reversals or indecision at key levels.
- Patterns like Morning Doji Star and Evening Doji Star are most reliable on these higher timeframes, specially when confirmed with volume, support and resistance level.
Intraday and Shorter Timeframes
- On shorter timeframes like 1-minute, 5-minute, 15-minute, Doji candles appear more frequently, but are often less reliable due to market noise and volatility.
- Short-term traders may use Doji for quick entry and exits, but these signals should be confirmed with the other indicators and price action for better accuracy.
| Timeframe | Reliability of Doji Signal | Best Use Case |
| Daily / Weekly | High | Major trend reversal, key support/resistance, institutional exhaustion, swing/positional decision zones |
| 1H / 4H | Moderate | Swing trades, continuation vs reversal confirmation, re-entry after pullback |
| 15M / 5M / 1M | Low (often noise) | Ultra-short intraday scalping, only valid with confluence (OI shift, VWAP, demand/supply, volume spike) |
For most traders, the daily and weekly timeframes are best for spotting high-probability Doji patterns, while intraday timeframes can be used for faster signals but require additional confirmation.
How to Confirm an Doji Signal
To confirm Doji signals, traders use a combination of price action, follow-up candlestick confirmation, and technical indicators. A Doji alone signals indecision, but its trade value comes from what happens next and where it appears.
1. Wait for Candlestick Confirmation
Look for the next candle or a series of candles after the Doji to see if price breaks in the direction suggested by the context (trend).
- If Doji forms at the bottom of a downtrend, a strong bullish candle closing above the Doji’s high is considered confirmation for a potential reversal upward.
- Conversely, if a Doji forms at the top of an uptrend, a strong bearish candle closing below the Doji’s low confirms a possible reversal down.

2. Check Technical Indicators
Combine the Doji with indicators like RSI, MACD, or Stochastic Oscillator to assess if the market is overbought/oversold or if momentum is shifting. High trading volume on or after the Doji candle adds strength and suggests institutional participation.

3. Evaluate Market Context
Place extra emphasis on Doji patterns forming at key support or resistance levels, trend exhaustion points, or historical reversal zones. Multiple Dojis forming in succession (such as the Tri-Star pattern) further strengthen the likelihood of a reversal.

By following these confirmation strategies, traders can reliably use Doji patterns as part of a disciplined trading plan rather than relying on the Doji alone.
How Successful is Doji?
The success rate of Doji alone is not highly reliable. However, if combined with indicator or followup candle can increase reliability, especially near key support/resistance zones or after extended trends.
Barry D. Moore, a IFTA certified technical analyst, did a research on Doji candle on 8,029 trades spanning 548 years of data, here is what he observed.
- The Doji candle is an unreliable and risky trade with a low accuracy rate of 55.6%.
- The Doji pattern does not predict market direction with certainty.
- A small profit per trade and a low Sharpe ratio of 0.40 are typical outcomes when using the Doji candle pattern.

This evidence suggests that the Doji pattern should not be used as a primary trading strategy.
How to Trade Using the Doji Candlestick Pattern
There are four major steps to trade Doji candlestick patterns. The steps are identifying the Doji, Entry, Profit Target and Stop-Loss.

Identifying the Doji and its meaning
Trading using Doji involves identifying the momentum of the market and position of the Doji to trade potential trend reversals or trend continuation once confirmation is established.
Entry
After identifying a Doji candle after a strong trending market, wait for the next candle for confirmation.
- Enter long if the next candle closes above Doji.
- Enter short if the next candle closes below Doji.
Profit Target
There are three methods to book profit. The methods are trailing stop loss, fixed risk to reward ratio commonly 1:2 or 1:3 or exiting at an important level such as recent significant support or resistance levels.
Stop-Loss
Place the stop-loss just beyond the opposite end of the Doji candle
- For bullish entries, stop-loss is set slightly below the Doji low.
- For bearish entries, stop-loss is set slightly above the Doji high.
Consider exiting partial or full position if the price action shows a strong opposite signal, such as a reversing candlestick or weakening volume.
Is Doji Candlestick Profitable?
The profitability of trading Doji candlestick patterns depends significantly on how they are used with confirmation and in context, rather than trading them in isolation. Doji candles alone are not consistently profitable.
Research published in Sage journals show that certain Doji types, like the Dragonfly Doji produce statistically positive results when combined with trend context and confirmation candles.
Common Mistakes to Avoid with Doji
There are four common mistakes to avoid with Doji. The mistakes to avoid are mentioned below.
- Trading every Doji: Not every Doji is tradable. A Doji at support after a downtrend is meaningful, but a Doji in a sideways random market is noise.
- Entering immediately without confirmation: As we discussed, Doji alone is not consistently profitable, it must be confirmed by the next candle which either breaks the high (bullish confirmation) or low (bearish confirmation) of the Doji.
- Trading Doji in the sideways market: In the sideways market, Doji appears naturally due to low volatility, they aren’t any signal, they are just “indecision noise.”
- Placing very tight stop-losses just because the Doji has a small body: Professionals don’t keep stop-loss on Doji body, they use high/low of the wick (because market volatility lives there).
Successful traders treat the Doji as a contextual signal, not a standalone setup. Avoid overreacting to its appearance, wait for confirmation, respect trend direction, and place stops beyond volatility zones.
What Does 2 Doji in A Row Mean?
A two Doji in a row means formation of two Doji candles consecutively one after the other. As Doji indicates indecision in the market, formation of two Doji gives even stronger uncertainty than a single Doji and often acts as a precursor to a potential trend reversal or significant price move.

Here’s what it typically means
- Stronger Indecision: As Doji indicates indecision in the market, formation of two Doji gives even stronger uncertainty than a single Doji and often acts as a precursor to a potential trend reversal or significant price move.
- Clearer Volatility Compression: Two doji forms in tight range which means volatility has compressed. This compression acts as a spring and gives a better breakout move than a single doji.
- Psychological Depth: From a psychology perspective, two Dojis indicate prolonged uncertainty, and when one side gains control, the reaction is usually decisive and directional.
Variations of the Double Doji may involve combinations of different Doji types such as Standard, Dragonfly, Gravestone, or Long-legged Doji, each adding nuance to the interpretation.
What does 3 Dojis Candlestick Pattern in a row mean?
Three Dojis candlestick pattern in a row also known as Tri-Star Doji pattern means formation of three consecutive Dojis one after the other. Although the appearance of three Dojis in a row is very rare, it is a signal of prolonged market indecision.
Three star doji typically form at the end of uptrend and dontrend. The pattern is considered more reliable when it appears near significant support or resistance levels, as these areas increase the likelihood of a reversal.
Difference Between Doji vs Spinning Top
The difference between Doji vs Spinning top is mentioned below in the table.
| Feature | Doji | Spinning Top |
| Body Size | Extremely small or almost nonexistent (open = close) | Small body, but visibly larger than a Doji |
| Open & Close Price | Nearly identical | Slight difference between open and close |
| Indicates | Complete indecision – buyers and sellers in perfect balance | Mild indecision – both sides active, but one has slight upper hand |
| Market Psychology | Neither side could move price; total equilibrium | Both bulls and bears were active, but momentum was weak |
| Reliability | Stronger signal of reversal when confirmed | Moderate signal; often part of consolidation phases |
| Common Appearance | After sharp rallies or selloffs – hints at reversal | During sideways or choppy markets – hints at pause or continuation |
| Trading Approach | Wait for confirmation candle to validate breakout direction | Used as a sign of market hesitation, not an immediate signal |
In essence, while both the Doji and Spinning Top represent market indecision, the Doji shows pure balance, whereas the Spinning Top shows mild struggle between buyers and sellers.
What are Other Indecision Candlesticks besides Doji?
Besides the Doji, other common candlestick patterns that indicate market indecision include Spinning Top, High Wave Candle, Harami and Harami Cross
- Spinning Top: Has a small real body with long upper and lower wicks, showing that buyers and sellers were active but neither could dominate. It signals market hesitation and a potential pause or reversal.
- High Wave Candle: Features a small body with very long shadows on both sides, reflecting extreme volatility and confusion among traders. It often appears before sharp market moves or trend changes.
- Harami: A two-candle pattern where a small candle forms completely inside the previous large candle’s body, showing fading momentum and uncertainty about the prevailing trend’s strength.
- Harami Cross: A variation of the Harami where the second candle is a Doji. It shows even stronger indecision and is a powerful sign that a trend reversal or major shift may be near.
These patterns are valuable tools for traders to identify periods of consolidation or potential trend reversals, especially when combined with other technical analysis signals.


 Previous Article


![15 Investing.com Alternatives [Free+Paid] You Should Use in 2026](https://www.strike.money/wp-content/uploads/2026/04/Investing.com-Alternatives.jpg "15 Investing.com Alternatives [Free+Paid] You Should Use in 2026 86")
![15 TradeStation Alternatives [Free+Paid] You Should Use in 2026](https://www.strike.money/wp-content/uploads/2026/04/TradeStation-Alternatives.jpg "15 TradeStation Alternatives [Free+Paid] You Should Use in 2026 87")
![15 Chartink Alternatives [Free+Paid] You Should Use in 2026](https://www.strike.money/wp-content/uploads/2026/04/Chartlink-Alternatives.jpg "15 Chartink Alternatives [Free+Paid] You Should Use in 2026 88")
: Overview, 10 Types of Indicators, Settings for Different Markets 90")

 : Definition, Formula, calculation, Uses, Advantages Vs limitations 92")


: How We Used This 70/30 Indicator in 6 High Win-rate Strategies 96")


No Comments Yet.