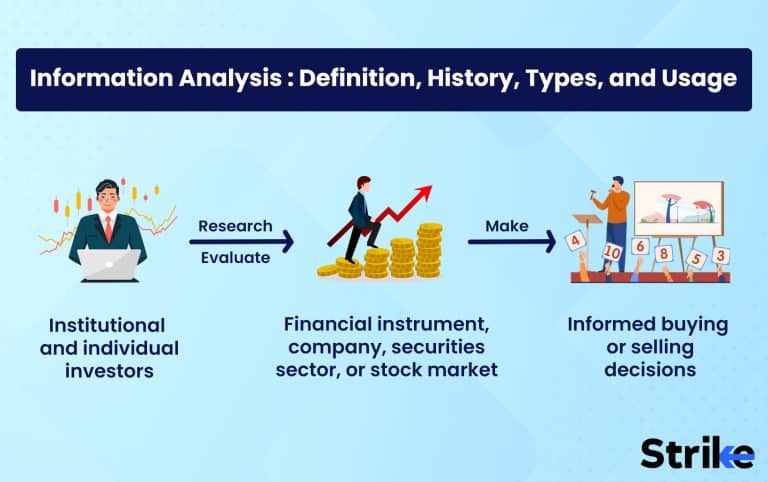
Information analysis refers to collecting, organizing, analyzing, and assessing data or information to gain valuable insights and make wise and correct decisions. Information Analysis involves converting unprocessed data into knowledge that is both relevant and useful.
Information analysis is frequently used in many different fields, including industry, academia, research, finance, and government. Information analysis has been used for thousands of years, and methodologies and approaches have changed due to technological development.
Companies can spot trends, find unnoticed patterns, and comprehend complicated events more fully using information analysis techniques, including data mining, statistical analysis, and pattern recognition.
Human classification and sorting of information were the main components of information analysis in the past. Data analysis improved in accuracy and effectiveness with the development of computers and the digital era. Information analysis processes and interprets enormous volumes of data using computer systems, algorithms, and statistical models.
There are 4 different types of Information analysis- descriptive analysis, diagnostic analysis, predictive analysis, and prescriptive analysis. Information analysis is a necessary process that includes examining and analyzing data to get an insightful understanding and make informed judgments.
It is essential in several fields, including business, research, cybersecurity, and healthcare. It aids in process optimization, anomaly detection, result prediction, and the creation of successful strategies. Information analysis enables people and organizations to effectively use the massive volumes of information at their disposal, allowing them to make data-driven choices and accomplish their goals more quickly due to the exponential expansion of data.
What is Information Analysis?
Information analysis is a systematic procedure of organizing, assessing, and interpreting facts or information to draw important conclusions and make wise judgments. It includes converting raw information into information that people and organizations utilize to comprehend complicated situations, spot trends, and discover connections.
Information analysis seeks to transform information into useful intelligence. Data gathering, data purification, data integration, data modeling, and data interpretation are some of the stages that are involved. Various analytical methods, including data mining, statistical analysis, text mining, machine learning, and visualizations, are frequently used in these processes.
Information analysis is done to answer particular questions or solve issues, facilitate decision-making, and produce insights that inspire action and development. It is used in many fields, including business, finance, marketing, healthcare, cybersecurity, government, and scientific research.
Information analysis assists businesses in improving efficiency, identifying market trends, enhancing customer experiences, detecting fraud or anomalies, strengthening security protocols, forecasting future results, and developing successful strategies. Decision-makers can use it to identify hidden patterns, comprehend linkages, and assess risks and possibilities. It helps reduce biases or preconceptions via thorough analysis and offers a solid basis for evidence-based decision-making.
What is the background History of Information Analysis?
Information analysis has a long history that dates back to the beginning of human civilization. The need to organize, analyze, and use such knowledge became increasingly obvious as civilizations developed and information got more plentiful. Information analysis had many different forms throughout antiquity.
For instance, scribes were responsible for compiling and examining information on ancient Egypt’s population, trade, and agriculture. They recorded and decoded information using simple techniques like tallying marks and hieroglyphics.
Information analysis was further aided by the invention of writing systems and the expansion of literacy in ancient societies like Mesopotamia, Greece, and Rome. The capacity to record and preserve information in writing form made it possible to analyze and accumulate knowledge more methodically. Information analysis was significantly advanced with the Renaissance and the Scientific Revolution in the 15th to 17th centuries.
Francis Bacon and other academics emphasized the value of empirical observation and systematic data analysis in the quest for knowledge. The growth of scientific disciplines and procedures, such as mathematics and statistics, gave rise to a well-organized framework for information analysis.
Information analysis revolutionized in the 20th century due to the quick development of technology and the introduction of computers. The study of enormous datasets became possible with electronic data processing and the development of computing tools. Data mining, statistical analysis, and modeling techniques became more popular, allowing for more complex analysis and decision-making.
Information analysis has advanced significantly in recent years as a result of the growth of digital information, the development of artificial intelligence, and machine learning. Real-time analysis of enormous volumes of data is made possible by powerful computing and sophisticated algorithms, which reveals intricate patterns and yields useful insights.
How does Information Analysis function?
Information analysis uses a systematic methodology to convert unstructured data into valuable insights. The procedure usually includes a number of steps that work together to analyze and evaluate the data. Data collection is the first step, during which pertinent data is acquired from various sources, including databases, questionnaires, and Internet platforms. The information gathered can be unstructured (language, photos), organized (numbers, classifications), or both.
Data preparation and purification come next after data collection. The dataset must be cleaned up of mistakes, inconsistencies, and redundant data at this point. Data is standardized, organized, and ready for additional analysis. This stage assures the data’s correctness and quality by reducing biases and mistakes that can affect the analysis.
Analytical approaches are used on the dataset after it has been prepared. These approaches include data mining, statistical analysis, machine learning, NLP, or visualization techniques. The approach will rely on the analysis’s goals and the data’s makeup. Machine learning algorithms can be used for predictive modeling or anomaly detection, while statistical analysis can be used to find correlations or trends.
The results are analyzed and combined to produce insightful conclusions after the study. Significant results are extracted, patterns or links are found, and decisions are made using the information that has been analyzed during this phase. Visualization tools are frequently used in order to portray the findings in a way that is clear.
What are types of Information Analysis?
There are different types of Information analysis. Here are 4 common types of information analysis.

- Descriptive Analysis- Descriptive analysis tries to summarize and characterize data to give readers a comprehensive grasp of its properties. Data aggregation, data profiling, and fundamental statistical measurements like mean, median, and mode are some strategies used. Descriptive analysis helps identify patterns, trends, and distributions within the data.
- Diagnostic Analysis- Diagnostic analysis determines the underlying causes of particular results or situations. It involves analyzing data to find dependencies, correlations, and links. Diagnostic analysis frequently uses regression, correlation, and root cause analysis. This kind of study offers an understanding of the fundamental causes of occurrences and aids in understanding why they happen.
- Predictive Analysis- Predictive analysis aims to predict future results using patterns and data from the past. It makes predictions and creates probabilistic forecasts using statistical modeling, machine learning algorithms, and data mining approaches. Predictive analysis is used for demand forecasting, risk assessment, fraud detection, and resource allocation.
- Prescriptive Analysis- Prescriptive analysis offers advice and useful information beyond descriptive and predictive analysis. It entails employing simulation models, decision support systems, and optimization approaches to recommend the optimal course of action in a certain circumstance. Prescriptive analysis aids in process optimization, resource allocation, and decision-making, enabling businesses to decide based on facts.
These four types of information analysis provide a comprehensive framework for understanding and utilizing data.
What are the Different Types of Charts for Information Analysis?
Different charts are commonly used for information analysis to represent and communicate data visually. Here are 5 of the different types of charts.

- Bar Chart- A bar chart represents data values using rectangular bars of variable lengths. It works well for comparing and showing discrete data categories as well as for comparing values between several groups or time periods.
- Line Chart- Data points are connected by a line to depict the trend or development of a variable over time in a line chart. It is appropriate for pattern or trend detection and continuous data visualization.
- Pie Chart- A pie chart divides a whole into slices to illustrate the percentage or proportion of several categories. It helps compare the relative sizes of data categories and present their composition or distribution.
- Histogram- A histogram shows the frequency or count of data points in each interval or bin on the y-axis while grouping the data into intervals on the x-axis to depict the data distribution. It aids in visualizing a dataset’s form, central tendency, and variability.
- Area Chart- The area below the line is filled in on an area chart, unlike a line chart. It works well to evaluate several factors’ proportionate or cumulative influence of several factors over time.
These are just a few examples of the many types of charts available for information analysis. The choice of chart depends on the nature of the data, the purpose of the analysis, and the insights to be conveyed.
How to Use Information Analysis in the Stock Market?
Information analysis plays a crucial role in the stock market by providing insights and informing investment decisions. The following are 5 uses of information analysis in the stock market:
- Fundamental Analysis: It helps assess a company’s value by analyzing its financial statements, industry trends, and competitive landscape. The best way is to look at earnings, revenue growth, and debt levels to determine whether a stock is undervalued or overvalued.
- Technical Analysis: It helps study historical price and volume data, patterns, and trends to predict future price movements. One can use charts, indicators, and models to identify trade entry and exit points based on patterns and market psychology.
- News and Sentiment Analysis: Stay updated on news, press releases, social media sentiment, and analyst reports to understand market sentiment and potential catalysts or risks. This helps in making timely investment decisions.
- Risk Analysis- It assesses factors like volatility, beta, correlations, and market trends to manage risk. The analysis also helps identify potential risks, diversify holdings, and optimize the risk-return tradeoff.
- Quantitative Analysis: It analyzes large datasets using statistical models, data mining techniques, and machine learning algorithms. Uncover patterns and relationships to generate investment strategies and make data-driven decisions.
Stock analysis is complex and tricky. These are some of the ways information analysis can be used in the stock market to make the analysis of upcoming trends easy.
How do Investors use Information Analysis in Investment?
Investors utilize information analysis in investment to make informed decisions and manage their portfolios. The following are 5 points on how information analysis is beneficial for the investors-
- Finding Investment possibilities: Information analysis examines a number of variables to assist investors in finding future investment possibilities. They research financial statements, market circumstances, industry trends, and economic indicators to find undervalued stocks or industries with growth potential.
- Assessing a Company’s Fundamentals: Investors evaluate a company’s fundamentals by looking at its financial statements, which include profits, revenue, and debt levels. They can use this study to assess the company’s profitability, growth potential, and overall financial health to decide whether to buy its stock.
- Assess risk and return: Analyzing information helps investors to assess the risk and possible return of a proposed investment. They examine variables like volatility, beta, and correlations to comprehend a stock’s or a portfolio’s risk profile. This study aids in risk management and building portfolios that align with investors’ risk tolerance.
- Technical Analysis: Using historical price and volume data, chart patterns, and technical indicators, investors do technical analysis. This study aids in forecasting short-term price changes, spotting patterns, and choosing the best times to enter and exit transactions.
- Investment plans for the long term: Information analysis aids in creating investment strategies for the long term. Investors assess variables, including firm performance, market movements, and macroeconomic data for portfolio diversification and asset allocation.
Information analysis equips investors to make wise investment choices by considering various elements, weighing risk and reward, and keeping up with market developments. It helps them reach their investment objectives by assisting them in locating investment possibilities, creating portfolios, and tracking performance.
What are the Different Indicators Used in Information Analysis?
There are different indicators utilized in information analysis to shed light on various market or investment-related topics. The following are 5 most commonly used indicators:
- Moving averages: Moving averages smooth out short-term swings by calculating the average price of an asset over a given time. They aid in spotting patterns and possible turning moments.
- Relative Strength Index (RSI): RSI is a momentum oscillator that gauges how quickly and dramatically market movements change. It identifies probable trend reversals by indicating whether an investment is overbought or oversold.
- Volume: The number of shares or contracts exchanged in securities is referred to as volume. It assists in determining the importance of price changes, confirming trends, or spotting potential reversals.
- Dividend Yield: A stock’s yearly dividend payment is compared to its price to determine the dividend yield. It offers information about an investment’s potential for revenue.
- Economic Indicators: Economic indicators, such as GDP growth, inflation rate, interest rates, and unemployment rate, assist in determining an economy’s general health and offer information about market circumstances.
These market indicators are just a few examples; many more are available to analyze different market aspects.
What is Oscillator in Information Analysis?
An oscillator is a technical indicator used in information analysis to assess the force or pace of price changes in financial markets. It oscillates between predetermined upper and lower borders, giving traders information about overbought and oversold circumstances, trend reversals, and probable entry or exit positions.
Oscillators are often computed using different mathematical methods and are presented as distinct indicators underneath the main price chart. They aid analysts and traders in evaluating the state of the market and spotting possible trading opportunities. Oscillators are very helpful in non-trending or range-bound markets, where prices fluctuate within a relatively constant range. The 3 most common types of oscillators are-
- Range bound indicator– Oscillators often have upper and lower borders that specify their range, which is indicated by the term “range-bound.” The oscillator indicator’s values change, giving information about the price movement and possible turning moments within this range.
- Market Overbought and Oversold Conditions: Oscillators aid in spotting market overbought and oversold situations. A market or asset can be overbought when an oscillator approaches its upper border, signaling the possibility of a reversal or correction. It, on the other hand, denotes oversold circumstances and might signal a price bounce or upward trend when it comes to the lower threshold.
- Divergence Analysis- Oscillators are used to find divergences between price movement and the oscillator indicator in a divergence analysis. It indicates that the trend can reverse to the upside when the oscillator produces higher lows while the price makes lower lows, this is known as a bullish divergence. A bearish divergence, in contrast, appears when the oscillator reaches higher highs while the price makes lower highs, pointing to a possible negative trend reversal.
Each oscillator has its own calculation method and interpretation techniques, but its primary purpose is to provide insights into price momentum and potential reversals in the market.
What are the Methods of Information Analysis?
There are different methods that can be used in information analysis to make informed decisions, 5 of the most common methods are-

- Quantitative Analysis- This technique analyzes numerical data using mathematical and statistical models. Applying various statistical methods to the data in order to find patterns, trends, correlations, and linkages is part of the process. Quantitative analysis is frequently applied in order to evaluate financial performance, risk, and valuation.
- Qualitative Analysis- Qualitative analysis focuses on non-numerical data, such as observations, interviews, surveys, and textual material. It entails deciphering and examining irrational data to locate themes, patterns, and trends. Understanding consumer behavior, market mood, and industry dynamics frequently uses qualitative analysis.
- Comparative analysis- A comparative analysis compares different things or situations to find similarities, differences, strengths, and limitations. It aids in evaluating the relative merits, viability, and potential of various solutions. Comparative analysis can be used to assess rival businesses, potential investments, or different action plans.
- Trend Analysis: Trend analysis requires looking at historical data to detect and analyze patterns and trends throughout time. It aids in determining the pace and scope of change and makes predictions about the future based on past performance. Market analysis, forecasting, and financial analysis all frequently employ trend analysis.
- Ratio analysis: Ratio analysis examines connections between different financial indicators to gauge the performance and health of an organization’s finances. Liquidity, profitability, and leverage ratios are a few examples of ratios that must be calculated and analyzed. Ratio analysis is useful for contrasting businesses operating in the same sector or monitoring a company’s success over time.
These are some of the methods which help in information analysis and, henceforth, help in making wise financial decisions.
What are the advantages of Information Analysis?
Information analysis has several benefits that help people make wise decisions and take informed action. These are 5 advantages of Information Analysis-
- Making Informed Decisions: Information analysis offers an organized method for collecting, handling, and interpreting data. Decision-makers can reduce their dependence on intuition or guess by making informed decisions by analyzing pertinent facts. It improves the chance of attaining targeted results and assists in risk mitigation.
- Finding Opportunities: Useful information analysis helps find opportunities that take time to be evident. Decision-makers can discover hidden insights and exploit new market trends or unrealized possibilities by analyzing data, trends, and patterns. Performance improvements and competitive advantages can result from this.
- Risk Tolerance– Information analysis helps identify and control risks. Decision-makers can detect risks, vulnerabilities, and uncertainties by analyzing pertinent data. They create risk-reduction plans, strengthen their resilience, and decide on risk-return trade-offs with greater knowledge.
- Strategic Planning- Information analysis aids strategic planning by offering a solid framework for establishing objectives, developing strategies, and allocating resources. It aids in understanding market dynamics, consumer wants, competition positioning, and market trends by decision-makers. This knowledge is useful for creating strategies that align with organizational goals.
- Organizational Competitive Advantage: Information analysis gives businesses a competitive edge. Utilizing the knowledge gained through data analysis, businesses can better understand client preferences, respond to market developments, and make timely and educated choices. This aids in remaining one step ahead of rivals and successfully addressing client requests.
Information analysis empowers decision-makers with valuable insights, enabling informed decision-making, risk management, strategic planning, and resource optimization. It provides a competitive advantage and supports innovation, ultimately contributing to organizational success.
What are the disadvantages of Information Analysis?
Information analysis offers numerous benefits, but knowing its potential disadvantages and limitations is important. Here are 5 common disadvantages of information analysis:
- Data Limitations- Information analysis strongly depends on data availability and quality, which has several limitations. An incorrect analysis and false findings might be the result of inaccurate or inadequate data.
- Bias in interpretation: Information analysis entails analyzing data and coming to conclusions. Analysts can unintentionally introduce their own prejudices, presumptions, or other biases into the study.
- Time constraints- Information analysis can take a lot of time, especially when working with huge datasets or intricate analytical models. Organizations or people with limited time and resources could find it challenging to undertake in-depth analysis or would need to prioritize specific factors, which could result in partial or lacking results.
- Information Abundance: An overwhelming amount of information is available in the current digital era . Large volumes of data can be intimidating and time-consuming to go through and analyze.
- Unexpected occurrences: Information analysis is predicated on the idea that past trends and patterns will remain true in the future. Unexpected occurrences, such as economic crises, natural catastrophes, or geo-political upheavals, can significantly influence markets and invalidate earlier analyses.
These are a few of the common disadvantages of information analysis.
What are the best tools for Information Analysis?
There are several tools available that can aid in information analysis. The best tools for information analysis depend on the specific requirements and context of the analysis. Here are 5 commonly used tools:
- Spreadsheets: Spreadsheet programs like Microsoft Excel or Google Sheets are frequently utilized for information analysis. It enables the organization of data, computations, and production of charts and graphs. Spreadsheets are flexible tools capable of handling huge datasets and carrying out numerous computations, making them capable of handling huge datasets and carrying out innumerable computations, which makes them appropriate for quantitative analysis.
- Data Visualisation Tools: The production of dynamic and aesthetically pleasing charts, graphs, and dashboards is made possible by data visualization tools like Tableau, Power BI, or Plotly. These technologies aid in the meaningful and simple presentation of data, promoting data exploration, pattern discovery, and sharing ideas.
- Web Scraping Tools: Web scraping programs help obtain data from webpages and other online sources. Examples are BeautifulSoup and Scrapy. They enable analysts to automate gathering and updating data for analysis while obtaining data from multiple web platforms.
- Machine Learning and AI Tools: Advanced analytical models can be created and used thanks to machine learning and artificial intelligence (AI) tools like scikit-learn and TensorFlow. These tools include algorithms for pattern recognition, predictive modeling, clustering, and classification to draw conclusions from data and create predictions.
- Data warehouse and business intelligence tools: These tools assist in gathering, storing, and analyzing substantial amounts of data from many sources. Examples include Amazon Redshift, Microsoft Power BI, and Oracle Business Intelligence.
These are some of the tools used in information analysis. It is, however, essential to choose tools depending on the unique requirements, level of technical expertise, and financial constraints.
What are the Best Books for Information Analysis?
There are numerous books available that provide valuable insights and guidance on information analysis. Here are 5 highly regarded books in the field:
- “Thinking, Fast and Slow” by Daniel Kahneman- This book examines how our decision-making and cognitive biases affect how we evaluate information. It gives foundational knowledge for comprehending human behavior in the context of information processing and insights into how our thinking can be impacted.
- “Data Analysis for Business Decisions” by Chris J. Lloyd- This book offers a useful method for conducting data analysis in a professional setting. Important subjects including data collecting, data visualization, statistical analysis, and decision-making are all covered. It provides real-world instances and case studies to help explain the ideas.
- “Data Science for Business” by Foster Provost and Tom Fawcett- The application of data science approaches for corporate decision-making is the main topic of this book. Data exploration, predictive modeling, data visualization, and ethical issues are just a few of the themes it addresses. It offers information on how data analysis is really used in a corporate setting.
- “Storytelling with Data: A Data Visualization Guide for Business Professionals” by Cole Nussbaumer Knaflic– This book emphasizes the value of excellent data visualization in presenting knowledge and insights. It provides helpful advice and methods for producing eye-catching visualizations that clearly convey the meaning of the data.
- “The Signal and the Noise: Why So Many Predictions Fail – But Some Don’t” by Nate Silver- The difficulties and hazards of prediction and forecasting are examined in this book. It goes on how statistical modeling, signal interpretation, and data analysis play a part in producing precise predictions. It sheds light on the significance of striking a balance between informed judgment and data-driven analysis.
These books cover a range of topics related to information analysis, including data exploration, statistical analysis, data visualization, and decision-making. They provide valuable insights and practical guidance for analysts and decision-makers.
What are the Best Courses for Information Analysis?
There are different online courses available that can provide valuable education and training in information analysis. These are 3 very common, informative, and easily available courses-
- “Data Science and Machine Learning Bootcamp with R” by Udemy: This thorough course uses the R programming language to cover various data science and machine learning topics. Data cleansing, exploratory data analysis, statistical modeling, machine learning techniques, and data visualization are some subjects covered.
- “Data Analysis and Presentation Skills: the PwC Approach” by PwC (Coursera): This training emphasizes data analysis and presenting abilities in a commercial setting. Data cleansing, visualization, statistical analysis, and the creation of powerful data presentations are just a few areas it covers. Real-world applications and practical skills are highlighted in the training.
- Duke University’s “Data Analysis and Statistical Inference” course: A thorough introduction to data analysis and statistical inference is given in this course. It includes subjects including statistical modeling, testing of hypotheses, regression analysis, and exploratory data analysis. It provides practical tasks and examples from the actual world.
These courses provide a solid foundation in data analysis and cover a range of techniques, tools, and methodologies.
Is it hard to Learn Information Analysis?
No, it is not hard to learn information analysis. Basic statistical principles, for example, can be relatively easy to understand regarding information analysis; but more complex procedures and methodologies can take more time and effort to master. It can also be helpful to be familiar with common computer languages and software for data analysis, such as Python or R. The ability to execute information analysis efficiently can be learned with commitment, practice, and access to useful materials like online courses or textbooks.
Is Information Analysis for Beginners?
Yes, information analysis can be learned by beginners if they have an interest in data analysis and are willing to learn the necessary skills and concepts. Beginners can understand the foundations by starting with foundational courses or resources that explain core statistical techniques and data processing. They can eventually dig into more complex themes and information analysis methodologies as they gain expertise and understanding. Building competence in this profession requires practice, practical tasks, and ongoing learning.
Is Information Analysis effective?
Yes, there are several fields where information analysis is quite productive. Information analysis allows people and organizations to get useful insights, make wise decisions, and resolve complicated issues by methodically collecting, organizing, and assessing data. Data patterns, trends, and correlations are uncovered, leading to a greater comprehension of the subject. Strategic planning, risk assessment, performance evaluation, and well-informed decision-making can all be aided by effective information analysis. It enables data-driven decision-making, reducing supposition and raising the probability of obtaining desired results.
Is Information Analysis accurate?
Yes, information analysis can be accurate. It depends on various factors, including the quality and reliability of the data used, the methodologies and techniques employed, and the competence of the analysts conducting the analysis. Information analysis, when done attentively and methodically, can provide precise and worthwhile insights.
What is the difference between Information Analysis and Fundamental Analysis?
These are 5 most common differences between Information Analysis and Fundamental Analysis-
| Information Analysis | Fundamental Analysis |
| It focuses on gathering, organizing, and evaluating data from various sources. | It analyzes a company’s financial statements, industry trends, and market conditions. |
| It examines various data, including financial, economic, market, and non-financial data. | 2. It primarily relies on financial statements, such as income statements, balance sheets, and cash flow statements. |
| It utilizes various analytical techniques, such as statistical analysis, data visualization, and text mining. | 3. It relies on financial ratios, valuation models, and industry comparisons to assess a company’s value. |
| It focuses on identifying patterns, trends, correlations, and anomalies within data. | 4. It assesses a company’s financial health, profitability, competitive position, and growth prospects. |
| It involves using advanced tools and technologies like machine learning and artificial intelligence. | 5. Generally does not involve advanced analytical tools, although financial modeling software can be used. |
These are some of the differences between Information Analysis and Fundamental Analysis.
What is the difference between Information Analysis and Quantitative Analysis?
These are 5 most common differences between Information Analysis and Quantitative Analysis-
| Information Analysis | Quantitative Analysis |
| Gathering, organizing, and evaluating information to gain insights and make informed decisions. | Mathematical and statistical techniques are used to analyze numerical data and identify patterns, relationships, and trends. |
| It involves analyzing a wide range of information, including qualitative and quantitative data. | 2. It primarily focuses on quantitative data and numerical measurements. |
| It analyzes both qualitative and quantitative data, such as text, images, financial statements, industry reports, news, etc. | 3. It analyzes numerical data, such as financial data, market data, scientific measurements, etc. |
| It analyzes financial statements and market trends to assess the value of a company. | 4. It analyzes historical stock prices to identify trends and predict future price movements. |
| It is widely used in various fields, such as business, finance, marketing, economics, social sciences, etc. | 5. It is commonly used in finance, investment analysis, risk management, scientific research, engineering, and other quantitative fields. |
These are some of the differences between Information Analysis and Quantitative Analysis.


 Previous Article


![15 Investing.com Alternatives [Free+Paid] You Should Use in 2026](https://www.strike.money/wp-content/uploads/2026/04/Investing.com-Alternatives.jpg "15 Investing.com Alternatives [Free+Paid] You Should Use in 2026 40")
![15 TradeStation Alternatives [Free+Paid] You Should Use in 2026](https://www.strike.money/wp-content/uploads/2026/04/TradeStation-Alternatives.jpg "15 TradeStation Alternatives [Free+Paid] You Should Use in 2026 41")
![15 Chartink Alternatives [Free+Paid] You Should Use in 2026](https://www.strike.money/wp-content/uploads/2026/04/Chartlink-Alternatives.jpg "15 Chartink Alternatives [Free+Paid] You Should Use in 2026 42")
: Overview, 10 Types of Indicators, Settings for Different Markets 43")


 : Definition, Formula, calculation, Uses, Advantages Vs limitations 46")


No Comments Yet.