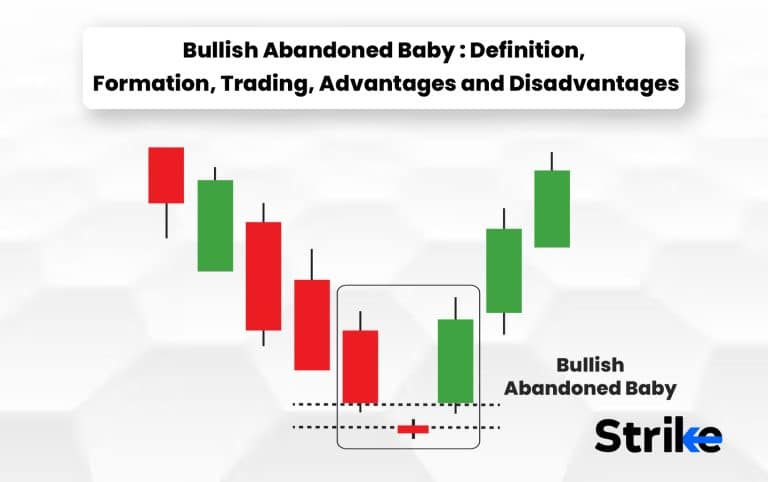
The bullish abandoned baby pattern is a bullish reversal candlestick pattern. Bullish abandoned baby pattern is a 3- candle pattern which consists of a big red candle, a doji and a big green candle. This pattern is formed at the bottom of the price chart when the sellers are getting weaker. Its formation signals a potential trend shift from bearish to bullish.
Bullish abandoned baby is considered to be a very effective candlestick pattern. Traders use this pattern to take long positions. While the target is subjective, traders set up their stop loss at the low of the doji or at the low of the big green candle.
What is Bullish Abandoned Baby candlestick pattern?
The bullish abandoned baby candlestick pattern is a 3-candle pattern. The bullish abandoned baby consists of – A big red candle, a doji and a big green candle. This pattern indicates a potential trend shift in the market. Bullish abandoned baby is located at the bottom of the price chart. It is formed at the time when the sellers are weak and buyers are ready to get control over the market –
Bullish abandoned baby is a triple candlestick pattern that tells traders that the downtrend is over and indicates a potential trend reversal in the market. This pattern changes the market sentiment from bearish to bullish.
Following are 3 rules one must know while trading this pattern –
- The first candle should be a long red candle
- The second candle (Doji) should open a gap down below the low of the first candle.
- The third candle (Green candle) should open above the high of the second candle.
How is Bullish Abandoned Baby Candlestick Formed?
The bullish abandoned baby candlestick pattern forms at the bottom of the price chart during a downtrend in the market. The formation of a bullish abandoned baby signals a potential trend reversal in the market.

This pattern is a 3-candle pattern. Meaning, it forms in three simple steps –
- The first candle is a huge red candle which tells the dominance of the sellers. The market is still very bearish at this point.
- The second candle is a doji. Doji indicates confusion or indecision amongst the market participants. This shows that buyers are stepping in and the sellers are losing strength.
- The third candle is a huge green candle which shows the strength of the buyers. This candle indicates that the sellers are being overpowered by the buyers and the downtrend has ended.
The formation of the bullish abandoned baby candlestick pattern is often perceived as a strong sign of trend reversal. This is why traders often use this pattern to enter into long trades.
What does Green Bullish Abandoned Baby Candlestick tell?
The green bullish abandoned baby pattern tells that the sellers are being overpowered by the buyers. The green bullish abandoned baby candlestick pattern is a technical analysis pattern that typically indicates a potential reversal in a downward trend.
This pattern is formed by three candles, with the first and last being a huge red candle and a green candle and the middle one being a small bullish or doji candlestick.
How Important is the Color of the Bullish Abandoned Baby Candlestick?
The color of the bullish abandoned baby candlestick is an important factor in interpreting the pattern. The color of the bullish abandoned baby pattern provides additional information about market sentiments and the potential price movements.
A trader must also know that the color of the pattern is just one aspect of the setup. In order to be a successful trader, an individual also has to give importance to risk management and other technical tools.
When does Bullish Abandoned Baby Candlestick Happen?
A bullish abandoned baby candlestick pattern typically occurs towards the end of a downtrend at the bottom of the price chart. A bullish abandoned baby pattern serves as a strong signal of a potential trend reversal in the market.
This 3-candle pattern occurs when the sellers are exhausted and buyers are trying to take control of the market. When a bullish abandoned baby pattern is formed, it is said that the trend has potentially shifted from bearish to bullish and the buyers have successfully overpowered the sellers.
How often does Bullish Abandoned Baby Candlestick occur?
The occurrence of a bullish abandoned baby candlestick pattern is rare compared to other candlestick patterns. The bullish abandoned baby candlestick pattern does not occur frequently as it is a 3-candle pattern. For a proper formation, this 3-candle pattern must follow 3 rules –
- The first candle should be a long red candle
- The second candle (Doji) should open a gap down below the low of the first candle.
- The third candle (Green candle) should open above the high of the second candle.
The bullish abandoned baby candlestick pattern has to follow these rules to be effective. Hence, the occurrence of a bullish abandoned baby candlestick pattern is comparatively rare.
How to read Bullish Abandoned Baby Candlestick in Technical Analysis?
Reading a bullish abandoned baby candlestick pattern in technical analysis is fairly easy. In technical analysis, a bullish abandoned baby pattern is read in 5 simple steps. To read this pattern successfully, you will have to analyze each of the 3 candles of this pattern. Following are the 5 steps for reading a bullish abandoned baby candlestick pattern –
- Identify the trend –
The market must be in an established downtrend before the formation of the bullish abandoned baby candlestick pattern. Make sure that the market is making lower highs and lower lows.
- Analyze the first candle –
The first candle of the bullish abandoned baby candlestick pattern is a huge red candle. The market is still in a downtrend during the formation of this candle.
- Analyze the second candle –
The second candle is a doji. You can identify a doji when the open and close of a candle is at the same price. Also remember that the doji must open below the low of the first candle. A doji candle indicates indecision amongst the market participants.
- Analyze the third candle –
The third candle is a huge green candle which signals that the buyers are now in control of the market. Remember that this candle must open above the high of the doji.
- Confirm the candlestick pattern –
When you see all the 3 candles following the above mentioned rules, then you can confirm the bullish abandoned baby candlestick pattern.
The bullish abandoned baby candlestick pattern is easily spotted on the bottom of a chart. Traders can also use additional technical tools to further enhance the probability of this candlestick pattern.
How accurate are the Bullish Abandoned Baby Candlestick in Technical Analysis?
The accuracy of the bullish abandoned baby candlestick pattern in technical analysis is subjective. The accuracy of the bullish abandoned baby pattern depends on several factors, including the strength of the trend, the timeframe being analyzed, and the overall market conditions.
When is the best time to Trade using Bullish Abandoned Baby Candlestick?
The best time to trade using the bullish abandoned baby candlestick pattern is when the pattern is formed by following all its rules. This pattern is the most effective when it’s being traded with other technical tools and there is high probability of a trend reversal in the market.
How to Trade with a Bullish Abandoned Baby Candlestick in the Stock Market?
Trading with a bullish abandoned baby candlestick pattern requires the use of chart reading skills. Trading with the bullish abandoned baby pattern in the stock market is done by following these 6 steps –

- Identify the pattern –
Identifying the bullish abandoned baby is the first step when it comes to trading with this pattern. Look at the bottom of the price chart and search for a 3-candle formation.
- Confirm the pattern –
Check whether the 3-candle formation is obliging with all the 3 rules of the bullish abandoned baby candlestick pattern.
- Take a long position –
After confirming the pattern, take a long trade once the high of the long bodied green candle gets violated.
- Set a stop loss –
Set your stop loss either below the low of the doji candle or below the low of the long green candle.
- Set a profit target –
The target for the bullish abandoned baby candlestick pattern is subjective. You should at least try to set a target that matches with 1:1 risk reward ratio.
- Monitor the trade –
Now that you have done everything, just sit back and monitor your trade. Do not exit till the hits your profit target or stop loss.
One should note that this pattern alone is not that effective and this pattern works best when used with other technical tools. Traders use this candlestick pattern with additional technical tools such as Volume, RSI (Relative Strength Index) and MACD (Moving Average Convergence Divergence).
Where does the Bullish Abandoned Baby commonly used?
The bullish abandoned baby candlestick pattern is commonly used in technical analysis, which is applied to financial markets such as stocks, commodities, and indices. The bullish abandoned baby is used by traders and investors to identify potential trend reversals and to make buying and selling decisions.
Is the Bullish Abandoned Baby in an uptrend a sell signal?
No, the bullish abandoned baby candlestick pattern is not a sell signal in an uptrend. The bullish abandoned baby is a buy signal in a downtrend. However, a bearish abandoned baby candlestick pattern, which is the exact opposite of a bullish abandoned baby pattern, is a sell signal in an uptrend.
What are the advantages of Bullish Abandoned Candlestick Pattern?
The bullish abandoned baby pattern is an effective candlestick pattern. The bullish abandoned baby pattern is widely used by traders because of its advantages. Following are 4 of the advantages of bullish abandoned candlestick pattern –
- Provides an early sign –
The bullish abandoned baby candlestick pattern provides early signs of a potential trend reversal. This can help traders in creating fresh long positions or exiting the existing short positions early.
- Easy to spot on the chart –
The bullish abandoned baby pattern is easy to spot on the price chart. Its 3-candle formation at the bottom of a downtrend makes it an easy catch for the traders.
- Good risk to reward ratio –
This candlestick pattern offers an attractive risk to reward ratio for the bullish traders as the stop loss for this pattern is comparatively smaller.
- Can be used with conjunction of other technical tools –
The probability of the bullish abandoned baby candlestick pattern is enhanced when used with additional technical tools.
One should know that no technical tool or setup is correct 100% of the time and is susceptible for generating false trading signals. A trader should follow his rules and set up consistently to see results.
What are the disadvantages of Bullish Abandoned Baby Candlestick?
The bullish abandoned baby candlestick pattern is considered as a very effective candlestick pattern but it does have its disadvantages. Following are 4 disadvantages of bullish abandoned baby candlestick pattern –
- Can give incorrect trading signals –
Like every other technical tool, the bullish abandoned baby candlestick pattern can also generate false trading signals. A trader should use this candlestick pattern with other technical tools for further confirmation.
- Does not form on all timeframes –
The bullish abandoned baby candlestick pattern cannot occur on intraday time frames. This pattern only forms on daily, weekly and monthly charts.
- Rare occurrence –
As this pattern is a 3-candle formation and needs to follow 3 rules, the occurrence of this pattern is comparatively rare when compared with other candlestick patterns.
- Subjective target –
The bullish abandoned baby candlestick pattern does not have a fixed profit target. It requires experience for setting up the profit target.
Regardless of its disadvantages, the bullish abandoned baby candlestick pattern is a high probability technical setup used with other technical tools.
What is the Opposite of a Bullish Abandoned Baby Candlestick?
The exact opposite of the bullish abandoned baby candlestick pattern is the bearish abandoned baby candlestick pattern. Opposite to bullish abandoned baby, a bearish abandoned baby candlestick pattern forms at the top of an uptrend and indicates a potential trend reversal in the market from bullish to bearish.
What are other types of Doji Candlestick Patterns besides Bullish Abandoned Baby?
There are many types of doji candlestick patterns besides bullish abandoned baby. Generally, A doji candle indicates indecision amongst the market participants. Here are 5 of the different types of doji candlestick patterns besides bullish abandoned baby –
- Neutral doji –
A neutral doji candlestick pattern forms when the opening and closing price of the doji candle are the same. This happens because the sellers and buyers active in the market are equal and neither are dominating the market currently.
- Long-legged doji –
A long legged doji pattern resembles the indecision between the market participants. This doji pattern can form at the top of the chart as well as the bottom of the chart. It leaves long wicks on both of its sides and the price opens and closes at nearly the same price. This pattern signals that the buyers and sellers are evenly matched and there is no confirmation of the future trend.
- Gravestone doji –
Gravestone doji candlestick pattern indicates a potential bearish trend reversal. Gravestone doji is generally formed at the top of the price chart. Traders interpret this pattern as a sign to take a bearish trade in the underlying stock.
- Dragonfly doji –
Dragonfly doji candlestick pattern indicates a potential bullish trend reversal. Dragonfly doji is generally formed at the bottom of the price chart. Traders interpret this pattern as a signal to take a bullish trade in the underlying stock.
- Four-price doji –
A four-price doji forms when the candle’s open, close, high and low are the same. This happens when the buyers and sellers are in equilibrium and the market is in a state of indecision. This pattern can either be a signal for trend continuation or a trend reversal.
Traders should use all of these doji patterns with additional technical tools as they are not that effective alone. Doji’s are formed when the market is about to decide its trend. Typically, a new trend will be formed in the market when a doji is formed.
What Candlestick Pattern is Similar to Bullish Abandoned Baby Candlestick?
Morning star candlestick pattern looks similar to the bullish abandoned baby candlestick pattern. A morning star also has a similar 3-candle formation and forms at the bottom of a downtrend just like an abandoned baby pattern. Traders use both of these patterns as an early signal for a potential trend shift in the market from bearish to bullish.
How does the Bullish Abandoned Baby pattern differ from the Bullish Engulfing and Piercing line?
The bullish abandoned baby pattern shares a similarity with the bullish engulfing and piercing line pattern as they all are bullish reversal patterns. However, the bullish abandoned baby pattern differs from the bullish engulfing and piercing line pattern. The bullish abandoned baby pattern is a 3-candle formation pattern while the other two candlestick patterns are 2 candle formations.
Can I backtest the Bullish Abandoned Baby pattern?
Yes, you can backtest the bullish abandoned baby pattern. You can backtest the bullish abandoned baby pattern by using previous price data. Previous price data can be easily accessible on any charting platform.
Identifying the bullish abandoned baby pattern on historical charts will also improve your chart reading skills. You can also use the previous price data for developing new strategies by mixing up the bullish abandoned baby pattern with additional technical tools.
Is the pattern of the Bullish Abandoned Baby a bullish reversal?
Yes, the bullish abandoned baby pattern is a bullish reversal candlestick pattern. The bullish abandoned baby is formed at the bottom of a downtrend and indicates a potential trend shift in the markets from bearish to bullish. This pattern signals that the buyers have outpowered the sellers and are dominating the market.
What is the difference between a Bullish Abandoned baby and Bearish Abandoned Baby?

The bullish abandoned baby pattern is completely opposite of the bearish abandoned baby candlestick pattern. Here is the difference between the bullish abandoned baby and the bearish abandoned baby pattern.
The bullish abandoned baby forms at the bottom of a downtrend and signals a potential trend reversal in the market from bearish to bullish while the bearish abandoned baby forms at the top of an uptrend and signals a potential trend shift from bullish to bearish.


 Previous Article


![15 Investing.com Alternatives [Free+Paid] You Should Use in 2026](https://www.strike.money/wp-content/uploads/2026/04/Investing.com-Alternatives.jpg "15 Investing.com Alternatives [Free+Paid] You Should Use in 2026 22")
![15 TradeStation Alternatives [Free+Paid] You Should Use in 2026](https://www.strike.money/wp-content/uploads/2026/04/TradeStation-Alternatives.jpg "15 TradeStation Alternatives [Free+Paid] You Should Use in 2026 23")
![15 Chartink Alternatives [Free+Paid] You Should Use in 2026](https://www.strike.money/wp-content/uploads/2026/04/Chartlink-Alternatives.jpg "15 Chartink Alternatives [Free+Paid] You Should Use in 2026 24")
: Overview, 10 Types of Indicators, Settings for Different Markets 25")


 : Definition, Formula, calculation, Uses, Advantages Vs limitations 28")


No Comments Yet.