A triple candlestick pattern is a formation of three consecutive candles that together signal a potential trend reversal or continuation. Unlike single-candle patterns, it provides stronger confirmation of market sentiment by showing how buyers and sellers gradually gain or lose control.
Traders use these patterns to identify reliable entry and exit points, as the three-candle structure reduces false signals and highlights shifts in momentum. Their importance lies in reflecting market psychology over a short period, helping traders anticipate trend changes or validate ongoing moves.
Common types include Morning Star and Evening Star (reversal patterns), Three White Soldiers and Three Black Crows (trend continuation or reversal), and Inside/Outside bar combinations. Understanding these patterns allows traders to make more informed decisions with better risk management.
1. Morning Star
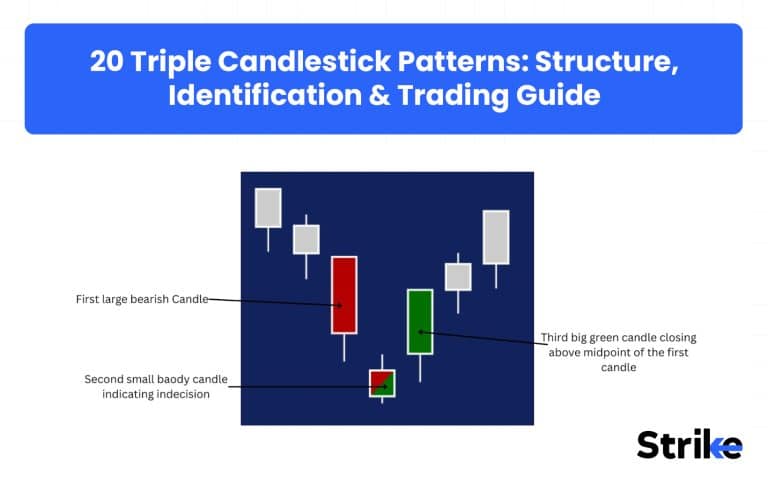
Morning Star is the bullish reversal candlestick pattern which forms after a sustained downtrend. The Morning Star pattern indicates a potential shift in the market sentiment from bearish to bullish and suggests the end of bear momentum.

- First Candle: A large, bearish (red or black) candle that appears during an established downtrend.
- Second Candle: A small-bodied candle (which can be a Doji or spinning top, and may be bullish or bearish) that typically “gaps down” from the first candle’s close.
- Third Candle: A large, bullish (green or white) candle that closes significantly into the body of the first candle, ideally above its midpoint confirming the reversal.
So what’s the psychology behind the morning star pattern? This pattern reflects a shift in power from sellers to buyers. The first candle shows the initial seller’s dominance but the second candle shows the seller’s hesitation. The third bullish candle shows aggressive buyers absorbing supply and pushing prices higher, signaling a sentiment shift from fear to confidence.
The bullish reversal confirmation becomes more stronger if the next candle shows the bullish followthrough. Traders initiate long positions once the third candle closes above the midpoint of the first candle with a recent swing low or the lowest point of the pattern as stoploss.
Summary Box of Morning Star Candlestick Pattern
| Parameter | Description |
| Type | Bullish Reversal |
| Preceding Trend | Appears in a Downtrend |
| Result | The stock turns bullish |
| Win Rate | ~65–70% (Thomas Bulkowski’s candlestick pattern research) |
2. Morning Star Doji
Morning Star Doji is a strong bullish reversal triple candlestick pattern which forms after a sustained downtrend. Morning Star Doji candlestick patterns suggest weakening of bearish momentum and change in the sentiment from bearish to bullish.
Then what is the difference between Morning Star and Morning Star Doji? Morning Star Doji is similar to classic Morning Star but with a Doji as a middle candle signalling market indecision.

- First Candle: A large, bearish red or black candle that appears during an established downtrend.
- Second Candle: A Doji candle that gapdown opens from the first candle’s close indicating extreme indecision.
- Third Candle: A large, bullish green or white candle that closes above the midpoint of the first candle.
Does that mean the Morning Star Doji pattern shares the same psychology as that of Morning Star? Yes, Morning Star Doji also reflects the transition of power from selling to buying where the initial selling pressure of sellers weakens due to hesitation and buyers take control over the market, changing trend to bullish.
The reversal signal becomes more powerful once the next candle shows bullish follow-through. Traders usually enter a long position once the third candle closes above the midpoint of the first candle with a recent low as a stoploss.
| Parameter | Description |
| Type | Bullish Reversal |
| Preceding Trend | Appears in a Downtrend |
| Result | Strong bullish reversal with higher conviction |
| Win Rate | ~68–72% (reference) |
3. Evening Star
Evening Star is a bearish reversal candlestick pattern which forms after a prolonged uptrend. Evening Star patterns suggest the weakening of the bullish trend and a potential shift in market sentiment from bullish to bearish.

- First Candle: A large, bullish green or white candle that appears during an establishment uptrend.
- Second Candle: A small-bodied indecisive candle which can be either Doji or spinning top that typically “gaps up” from the first candle’s close. The candle’s colour does not matter, it can be either bullish or bearish.
- Third Candle: A large, bearish red or black candle that closes below the midpoint of the first candle.
The psychology behind Evening Star pattern is exactly opposite of Morning Star Pattern. Evening Star pattern indicates shift in the control from buyers to sellers where buyers start losing strengths and hesitate to push price higher. As confidence weakens, sellers step in, overwhelm demand, and pull prices down, signaling a clear transition from optimism to caution and bearish control.
Traders initiate a short position once the third closes below the midpoint of the first candle with recent high as a stoploss.
| Parameter | Description |
| Type | Bearish Reversal |
| Preceding Trend | Appears in an Uptrend |
| Result | The stock turns bearish |
| Win Rate | ~65–70% (reference) |
4. Evening Star Doji
Evening Star Doji is a strong bullish reversal candlestick pattern which forms after a sustained uptrend. Evening Star Doji candlestick patterns suggest weakening of bullish momentum and change in the sentiment from bullish to bearish.
Evening Star Doji is similar to classic Evening Star but with a Doji as a middle candle signalling market indecision.

- First Candle: A large, bullish green or white candle that appears during an establishment uptrend.
- Second Candle: A Doji candle that gap up opens from the first candle’s close indicating extreme indecision.
- Third Candle: A large, bearish red or black candle that closes below the midpoint of the first candle.
Evening Star Doji shares the same psychology as classical Evening Star Doji, signaling control shift from buyers to sellers after buyers hesitates and fails to push prices higher. Traders initiate a short position once the third closes below the midpoint of the first candle with recent high as a stoploss.
Traders initiate a short position once the third closes below the midpoint of the first candle with recent high as a stoploss.
| Parameter | Description |
| Type | Bearish Reversal |
| Preceding Trend | Appears in an Uptrend |
| Result | Strong bearish reversal with higher conviction |
| Win Rate | ~68–72% (reference) |
5. Tristar
Tristar is the rare triple candlestick pattern which suggests market indecision and a possible trend reversal after the strong trend. The Tristar pattern consists of three consecutive Doji candles which suggests that the momentum has halted and the trend will reverse. This pattern usually forms after a strong trend with momentum.
- First Candle: First Doji candle forms after the strong market momentum, suggesting market indecision.
- Second Candle: Another Doji suggesting further loss in momentum.
- Third Candle: continuous formation of third Dojji confirms the loss of momentum.
Tristar pattern reflects the psychology where neither buyers nor sellers are able to decide the trend of the market. After this pause, momentum gradually shifts in the opposite direction, shifting the trend. Reliability of this pattern increases when it appears at important support and resistance levels.
| Parameter | Description |
| Type | Reversal (Bullish or Bearish) |
| Preceding Trend | Strong Uptrend or Downtrend |
| Result | Momentum exhaustion and potential trend reversal |
| Win Rate | ~45–50% (low due to rarity) |
6. Three White Soldiers
Three White Soldiers is a bullish reversal candlestick pattern which appears after a downtrend or a consolidation phase. It signals a change in market sentiment from bearish to bullish, showing a growing confidence among the buyers.

- First Candle: A long bullish green or white candle marking initial comeback of buyers after a period of selling pressure.
- Second Candle: Another bullish green or white candle that opens within the body of the first candle but closes higher than the high of the first candle.
- Third Candle: A third strong bullish candle that opens within the body of the prior candle and closes higher than the high of the second candle.
What’s the psychology behind the Three White Soldiers? The psychology behind the Three White Soldiers pattern is steady accumulation by buyers, where each candle represents increasing confidence of buyers absorbing supply without allowing sellers to regain control.
The reliability of this pattern increases when it forms near a support or demand zone. Traders often enter long after the close of the third candle and put first candles low as a stoploss.
| Parameter | Description |
| Type | Bullish Continuation / Reversal |
| Preceding Trend | Appears after a Downtrend or Consolidation |
| Result | Sustained bullish momentum |
| Win Rate | ~70–75% (reference) |
7. Three Black Crows
Three Black Crows is a bearish reversal candlestick pattern which appears after an uptrend or a consolidation phase. It signals a change in market sentiment from bullish to bearish, showing a growing confidence among the sellers.

- First Candle: A long bearish red or black candle marking the initial entry of the sellers after a bull phase.
- Second Candle: Another bearish red or black candle that opens within the body of the first candle but closes lower than the low of the first candle.
- Third Candle: A third strong bearish candle that opens within the body of the prior candle and closes lower than the low of the second candle.
The psychology behind the Three White Soldiers pattern is persistent distribution by sellers., where each candle represents increasing confidence of sellers continuing to push price lower without allowing buyers to regain control.
This pattern becomes more reliable when it forms near a resistance or supply zone. Traders prefer entering short after the third candle closes with the first candle’s thigh as a stoploss.
| Parameter | Description |
| Type | Bearish Reversal |
| Preceding Trend | Appears after an Uptrend or Consolidation |
| Result | Sustained bearish momentum |
| Win Rate | ~70–75% (reference) |
8. Three Inside Up
Three Inside Up is a bullish reversal candlestick pattern that appears after a downtrend. This pattern signals a gradual change in the market sentiment, where selling pressure starts weakening and buyers begin to regain control.

- First Candle: A large bearish red or black candle reflecting a strong selling pressure.
- Second Candle: A small bullish candle that forms within the body of the first bearish candle.
- Third Candle: A strong bullish candle closing above the high of the second candle.
The psychology behind this pattern is the transition of sentiment from selling to buying, where sellers lose momentum, buyers test strength inside the prior range and the final candle confirms the buyers control.
The reliability of the Three Inside Up pattern increases with the bullish follow through candle. These patterns work best near support or demand zones where traders prefer entering long by placing recent swings low as a stoploss.
| Parameter | Description |
| Type | Bullish Reversal |
| Preceding Trend | Appears in a Downtrend |
| Result | Gradual shift from selling to buying |
| Win Rate | ~63–68% (reference) |
9. Three Inside Down
Three Inside Up is a bearish reversal candlestick pattern that appears after an uptrend. This pattern signals a gradual change in the market sentiment, where buying pressure starts weakening and sellers begin to gain control.

- First Candle: A long bullish green or white candle marking the initial entry of the buyers after a bull phase.
- Second Candle: A small bearish candle that forms within the body of the first bullish candle.
- Third Candle: A strong bearish candle closing below the low of the second candle.
The psychology behind this pattern is the transition of sentiment from buying to selling, where buyers lose momentum, sellers test strength inside the prior range and the final candle confirms the sellers control.
The reliability of the Three Inside Down pattern increases with the bearish follow through candle. These patterns work best near resistance or supply zones where traders prefer entering short by placing recent swings high as a stoploss.
| Parameter | Description |
| Type | Bearish Reversal |
| Preceding Trend | Appears in an Uptrend |
| Result | Gradual shift from buying to selling |
| Win Rate | ~63–68% (reference) |
10. Three Outside Up
Three Inside Up is a bullish reversal candlestick pattern that appears after a downtrend . This pattern signals a strong change in the market sentiment, where selling pressure starts weakening and buyers begin to gain control.

- First Candle: A bearish red or black candle continuing the bearish trend.
- Second Candle: A strong bullish candle which fully engulfs the first candle, indicating a strong buying interest.
- Third Candle: A bullish candle that opens within the range of the second candle and closes higher than the high of the second candle.
The psychology behind this Three Outside Up pattern clearly shows the buyers dominance, where strong demand overwhelms the limited supply. As buyers step in aggressively, sellers lose strength and control, confirming a decisive shift in market power toward the bulls.
This pattern becomes more reliable with increased volume and works best near support or demand zones. Traders look for long entries after the close of the third candle, placing the stop-loss below the recent swing low.
| Parameter | Description |
| Type | Bullish Reversal |
| Preceding Trend | Appears in a Downtrend |
| Result | Strong buyer dominance and trend reversal |
| Win Rate | ~68–72% (reference) |
11. Three Outside Down
Three Inside Up is a bearish reversal candlestick pattern that appears after an uptrend. This pattern signals a strong change in the market sentiment, where buying pressure starts weakening and sellers begin to gain control.

- First Candle: A bullish green or white candle continuing the existing trend.
- Second Candle: A strong bearish candle that fully engulfs the first candle, indicating a strong selling pressure.
- Third Candle: A bearish candle that opens within range of the second candle, but closes lower than the low of the second candle
Three Outside Down candlestick patterns have exactly opposite psychology of Three Outside Up. Here, the psychology suggests sellers dominance due to oversupply.
This pattern also becomes more reliable with increased volume and works best near resistance or supply zones. Traders look for short entries after the close of the third candle, placing the stop-loss above the recent swing high.
| Parameter | Description |
| Type | Bearish Reversal |
| Preceding Trend | Appears in an Uptrend |
| Result | Strong seller dominance and trend reversal |
| Win Rate | ~68–72% (reference) |
12. Bullish Abandoned Baby
Bullish Abandoned Baby is a rare but powerful bullish reversal candlestick pattern which appears at the end of a downtrend. It indicates an abrupt shift in the market where selling pressure completely fades and buyers take full control.

- First Candle: A strong bearish red or black candle suggesting continuation of the downtrend.
- Second Candle: A Doji candle which gaps down from the first candle and stays separated.
- Third Candle: A strong bullish green or white candle that gaps up from the Doji and closes into the body of the first candle, confirming the reversal.
What is the psychology of the Bullish Abandoned Baby? A sudden change in the sentiment where sellers dominated early, but the isolated Doji signals the exhaustion and uncertainty. The Gap up opening and strong bullish move suggest buyers dominance where demand has completely absorbed supply.
This pattern is more reliable when it forms in the areas of great support or demand and is backed by the increase of the volume. The traders usually get into the long position following the bullish candle with the stop-loss set below the low of the pattern or the Doji.
| Parameter | Description |
| Type | Bullish Reversal |
| Preceding Trend | Appears in a Downtrend |
| Result | Sharp bullish reversal with strong conviction |
| Win Rate | ~70–75% (reference) |
13. Bearish Abandoned Baby
Bearish Abandoned Baby is also a powerful bearish reversal candlestick pattern which appears at the end of an uptrend. It indicates an abrupt shift in the market where buying pressure completely fades and sellers take full control.

- First Candle: A strong bullish green or white candle suggesting continuation of the uptrend.
- Second Candle: A Doji candle which gaps up from the first candle and stays separated.
- Third Candle: A strong bearish red or black candle that gaps down from the Doji and closes into the body of the first candle, confirming the reversal.
This pattern reflects the psychology of traders’ sudden shift in sentiment, where buyers were dominating initially, but the isolated Doji candle highlights the hesitation and trend exhaustion. When price gaps lower on the next candle and sellers step in aggressively, the sentiment shifts from bullish to bearish.
Bearish Abandoned Baby is more reliable when it forms in the areas of resistance or supply, where traders usually get into the short position following the bearish candle with the stop-loss set above the high of the pattern or the Doji.
| Parameter | Description |
| Type | Bearish Reversal |
| Preceding Trend | Appears in an Uptrend |
| Result | Sharp bearish reversal with strong conviction |
| Win Rate | ~70–75% (reference) |
14. Three River Bottom
Three River Bottom is a bullish reversal candlestick pattern which forms after a prolonged downtrend. It is an indication of slow base formation, which means that the selling pressure is declining and buyers are starting to intervene.

- First Candle: A long bearish red or black candle continuing the downtrend, showing a selling pressure.
- Second Candle: Another bearish candle that makes a lower low but closes higher than its low, indicating reduced selling momentum.
- Third Candle: A small bullish candle that closes higher than the second candle, confirming early buyer participation and a potential reversal.
The psychology behind the Three River Bottom pattern is exhaustion of sellers. Each decline attracts less follow-through selling, while buyers slowly gain confidence. By the third candle, demand starts to absorb supply, signaling a shift from panic selling to cautious accumulation.
The pattern becomes more reliable when it forms near strong support zones and is followed by bullish continuation. Traders often look for long opportunities after confirmation, placing the stop-loss below the lowest low of the pattern.
| Parameter | Description |
| Type | Bullish Reversal |
| Preceding Trend | Appears after a Prolonged Downtrend |
| Result | Selling exhaustion and potential trend reversal |
| Win Rate | ~62–67% (reference) |
15. Three Mountain Top
Three Mountain Top is the bearish reversal candlestick pattern which appears after a prolonged uptrend. It indicates a possible market top, where buying strength weakens and sellers begin to dominate.

- First Candle: A strong bullish candle continuing the uptrend, reflecting confident buying.
- Second Candle: Next bullish candle that forms near the same high but forms an upper wick showing slowness in momentum and hesitation among buyers.
- Third Candle: A bearish candle which closes lower and confirms the rejection from the top area, indicating start of selling pressure.
The psychology behind the Three Mountain Top pattern is buyer exhaustion. Each push higher attracts less follow-through buying, while sellers gradually increase pressure near resistance. When the final candle turns bearish, it confirms that supply has overtaken demand, marking a shift from optimism to caution.
The pattern is more effective near major resistance zones and gains reliability when followed by bearish continuation. Traders often look to initiate short positions after confirmation, placing the stop-loss above the highest peak of the pattern.
| Parameter | Description |
| Type | Bearish Reversal |
| Preceding Trend | Appears after a Prolonged Uptrend |
| Result | Buying exhaustion and potential trend reversal |
| Win Rate | ~62–67% (reference) |
16. Stalled-Deliberation
Stalled-Deliberation is a bearish reversal candlestick pattern that appears after the strong uptrend. This pattern indicates hesitation of buyers at a high level, where momentum begins to slow down and sellers start taking control.

- First Candle: A strong bullish green or white candle that reflects the strong confident buying in a current uptrend.
- Second Candle: Another bullish candle that closes higher than the first candle but with a small body size.
- Third Candle: Small body candle, such as Doji or spinning top forming near the top, indicating indecision and buyers exhaustion.
The psychology of this pattern reflects the hesitation of buyers at highs. As buyers continue to push price up, each advance in price shows less strength than the previous one. At the end the final candle shows uncertainty and loss of momentum opening the door for the sellers.
The reliability of this pattern increases when it forms near the major resistance in an uptrend. The reversal is confirmed when the next candle formed is red or black which engulfs the previous candles.
| Parameter | Description |
| Type | Bearish Reversal / Trend Weakening |
| Preceding Trend | Appears in a Strong Uptrend |
| Result | Momentum slowdown and potential bearish reversal |
| Win Rate | ~60–65% (reference) |
17. Three Gaps Pattern
Three Gaps Pattern is a trend exhaustion candlestick pattern that appears after a strong and extended price move. It signals that the prevailing trend, either bullish or bearish is nearing maturity and may soon reverse or enter a consolidation phase.

- First Gap: Price gaps in the direction of the prevailing trend, showing strong momentum and aggressive participation.
- Second Gap: Another gap in the same direction, reflecting growing enthusiasm and late participation from traders.
- Third Gap: A final gap that occurs near the end of the move, often driven by emotional or panic buying/selling, indicating exhaustion.
The psychology behind the Three Gaps Pattern is emotional excess. Early gaps are driven by conviction, while the final gap reflects overcrowding and late entry. Once the third gap forms, smart money often begins to exit positions, increasing the risk of a sharp pullback or reversal.
This pattern becomes more effective when it forms near major resistance (in uptrends) or support (in downtrends).
| Parameter | Description |
| Type | Exhaustion / Reversal Signal |
| Preceding Trend | Appears after a Strong Uptrend or Downtrend |
| Result | Trend exhaustion and high probability of reversal |
| Win Rate | ~60–65% (reference) |
18.Three Stars in the South
The Three Stars in the South is a rare bullish reversal triple candlestick pattern which forms at the end of a downtrend. This pattern signals the fading momentum of the bearish trend and increasing strength of the bullish trend.
- First Candle: A long bearish (Red/Black) candle that continues the existing downtrend, indicating strong selling pressure.
- Second Candle: Next bearish candle that makes the lower low, but with a smaller body than the first candle, indicating reduced selling pressure.
- Third Candle: A small bearish candle forming within the range of the second candle, indicating clear loss of momentum and seller exhaustion.
This pattern suggests the weakening selling pressure, with bears losing control on each decline, signalling downtrend exhaustion. Trend reverses from this exhaustion once the price breaks above the patterns high with strong bullish candle.
| Parameter | Description |
| Type | Bullish Continuation / Downtrend Weakening |
| Preceding Trend | Strong Downtrend |
| Result | Selling pressure fades, potential upside continuation |
| Win Rate | ~55–60% (reference) |
19.Three Stars in the North
The Three Stars in the North is a rare bearish reversal triple candlestick pattern which forms at the end of an uptrend. This pattern signals the fading momentum of the bullish trend and increasing strength of the bearish trend.
- First Candle: A long bullish (Green/White) candle that continues the existing uptrend, indicating strong buying pressure.
- Second Candle: Next bullish candle that makes the higher high, but with a smaller body than the first candle, indicating reduced buying pressure.
- Third Candle: A small bullish candle forming within the range of the second candle, indicating clear loss of momentum and buyers exhaustion.
This pattern suggests the weakening buying pressure, with bulls losing control on each rise, signalling uptrend exhaustion. Trend reverses from this exhaustion once the price breaks below the patterns low with strong bearish candle.
| Parameter | Description |
| Type | Bullish Continuation / Downtrend Weakening |
| Preceding Trend | Strong Downtrend |
| Result | Selling pressure fades, potential upside continuation |
| Win Rate | ~55–60% (reference) |
20. Stick Sandwich
Stick Sandwich is a rare and reversal three candlestick pattern forms at the top or bottom of the trend. It got its name because the middle candle is sandwiched in between the two big candles of opposite colour.
- First Candle: A first big candle formed in the direction of prevailing trend, suggesting trend continuation.
- Second Candle: A second small opposite colored candle forms within the range of the first candle, signaling an attempt of reversing trend.
- Third Candle: Another candle forms in the direction of the prevailing trend, similar to the first candle, confirming that the price is taking support. A trend reverses once price breaks the support or resistance.
The psychology behind this pattern shows that the buyers or sellers tried to push price in the direction of prevailing trend, but failed to do so. This shift in balance between buyers and sellers triggers the trend reversals. This pattern works best near support or resistance.
| Parameter | Description |
| Type | Trend Reversal |
| Preceding Trend | Downtrend/ Uptrend |
| Result | Potential trend shift |
| Win Rate | ~60–65% (reference) |
How to Trade using Triple Candlestick Patterns? [Real Example]
There are four major steps to trade using Triple Candlestick Patterns. The steps are pattern identification, entry, stoploss, and profit target.
- Identification: Identify the triple candlestick pattern on the chart and make sure it appears in the right context.

For instance, Coforge Limited stock is forming a morning star after a short correction in uptrend. RSI oversold is giving extra confirmation that the stock is oversold in an uptrend and possible reversal is likely.
- Entry: Enter the trade once the third candle, the confirmation candle of the triple candlestick pattern closes with a good volume.

- Stop Loss: Place your stop loss below the pattern’s low for long trades and above the pattern’s high for short trade. Use 1-1.5x ATR to filter noise and risk only 1% of the total capital. Trail your stop loss to breakeven or prior swing once your trade reaches 1R.
- Profit Target: Set your target based on nearest important support/resistance level or set your target 2-3 times of your stoploss. You can also trail the profits using EMA during a strong trend continuation.
Trading with these steps helps traders capture clear reversals or trend continuations under controlled risk—this is exactly what Technical Analysis is designed to do.
What is the Best Timeframe to Use Triple Candle Patterns?
The best timeframe to use the triple candlestick pattern is generally the higher timeframe such as 4-hours, daily or weekly due to its low market noise and clear price structure. On the other hand, lower time frames such as 15-min to 1-hour can be used to trade Triple Candle Patterns for intraday trading, but only in strong trends and high-liquidity stocks or indices.
| Timeframe | Best Use Case | Reliability | Remarks |
| Weekly | Major trend reversals | Very High | Best for long-term investors and positional traders |
| Daily | Swing & positional trading | High | Most balanced timeframe with strong confirmation |
| 1-Hour | Short-term swing / intraday | Medium | Use only with strong trend and volume confirmation |
| 15-Minute | Intraday trading | Low–Medium | Higher noise; requires strict filters |
| 5-Minute | Scalping | Low | Not recommended due to frequent false signals |
Higher timeframes offer the most reliable candlestick pattern signals, while lower timeframes require strong trend alignment and strict filtering to avoid false setups—making Timeframe for Trading a key factor in reducing false signals and improving accuracy.
Best 3 Candle Patterns for Day Trading
The best 3 candle patterns for day trading are mentioned below in the table.
| Candlestick Pattern | Why Chosen for Day Trading | Key Parameters |
| Morning Star | Strong intraday reversal after short-term sell-off | Works best near VWAP, demand zone, or after liquidity sweep |
| Evening Star | Clear exhaustion signal near intraday highs | Effective at resistance, PDH/PDL, or supply zone |
| Three White Soldiers | Confirms strong intraday momentum continuation | Best after BOS with volume during London/NY session |
In day trading, three-candle formation is the most effective tool to use in fast markets to make fast confirmation following a liquidity grab or significant levels throughout the day that assists traders to get in at the correct moment in a rapidly moving market.
Best 3 Candle Patterns for Forex Trading
The best 3 candle patterns for forex trading are mentioned below in the table.
| Candlestick Pattern | Why Chosen for Forex Trading | Key Parameters |
| Morning Star Doji | Reliable reversal in high-liquidity FX pairs | Strong near weekly support or after stop-hunt |
| Evening Star Doji | Captures institutional distribution zones | Best during London–NY overlap |
| Three Inside Up / Down | Filters false breakouts common in Forex | Works well with HTF structure + RSI divergence |
They are the most efficient in forex trading when coupled with high-liquidity sessions and higher-time frame structure and false signals prevalent in range-bound markets are minimized.
Best 3 Candle Patterns for Swing Trading
The best 3 candle patterns for swing trading are mentioned below in the table.
| Candlestick Pattern | Why Chosen for Swing Trading | Key Parameters |
| Three River Bottom | Strong multi-day reversal pattern | Effective at long-term demand and oversold RSI |
| Three Mountain Top | Identifies major distribution before declines | Best near HTF resistance with volume drop |
| Three Outside Up / Down | Confirms trend reversal with conviction | Works well with BOS + retest on daily chart |
Are Triple Candle Patterns More Reliable than Double & Single Candle Patterns?
Yes, triple candle patterns are generally more reliable than double and single candlestick patterns because they provide strong confirmation and clear shifts in market psychology over multiple sessions. However, Triple candlestick patterns provide late entry compared to Double and Single Candle Pattern, but with higher accuracy if used with right market context.
| Aspect | Single Candle Patterns | Double Candle Patterns | Triple Candle Patterns |
| Complexity | Very simple, quick signals | Moderate confirmation required | Higher complexity, deeper analysis |
| Reliability | Low, prone to false signals | Moderate reliability | High, strong confirmation |
| Signal Speed | Fastest entries | Balanced timing | Slower but well-confirmed entries |
| Best Timeframe | Intraday / very short-term | Short to medium term | Daily / weekly reversals |
| Ideal Use | Early market cues | Trend validation | Major trend or reversal identification |
Triple candlestick patterns prioritize confirmation over speed, making them ideal for identifying high-probability trend reversals.
Are Triple Candlesticks Profitable to Trade?
Yes, the triple candlesticks pattern is profitable to trade, but only when used with proper market context. The triple candlestick pattern alone is not a money making tool because it may occur randomly on the chart, particularly on the range-bound, low-volatility or illiquid markets. Hence, profitability comes from context, confirmation and risk management.
Triple candlestick pattern is most effective when it is aligned with the higher timeframe trend, the pattern was established around the major levels of support or resistance and validated with high volume or momentum. In such conditions, even 55 to 60% of the winrate can bring a consistent profit.
What is the Success Rate of Triple Candlestick Patterns?
According to Thomas Bulkowski’s Encyclopedia of Candlestick charts, the success rate of all the triple candlestick patterns is mentioned below in the table.
| Pattern | Type (Expected) | Success Rate (%) |
| Morning Star | Bullish Reversal | 78 |
| Morning Star Doji | Bullish Reversal | 78 (Doji variant similar) |
| Evening Star | Bearish Reversal | 72 |
| Evening Star Doji | Bearish Reversal | 72 (Doji variant similar) |
| Tristar | Reversal (Bi-directional) | 45 (Low due to rarity) |
| Three White Soldiers | Bullish Reversal | 82 |
| Three Black Crows | Bearish Reversal | 78 |
| Three Inside Up | Bullish Reversal | 65 |
| Three Inside Down | Bearish Reversal | 65 |
| Three Outside Up | Bullish Reversal | 75 |
| Three Outside Down | Bearish Reversal | 70 |
| Bullish Abandoned Baby | Bullish Reversal | 70 |
| Bearish Abandoned Baby | Bearish Reversal | 75 |
| Three River Bottom | Bullish Reversal | 85 |
| Three Mountain Top | Bearish Reversal | 85 |
| Stalled / Deliberation | Bearish Reversal | 60 |
| Three Gaps Pattern | Continuation (Bi-directional) | 68 (Varies by gap type) |
| Three Stars in the South | Bullish reversal | 86% |
| Three Stars in the North | Bearish Reversal | 55-65% (quantified strategies) |
| Stick Sandwich | Reversal (Bi-directional) | 62-67% (wrtrading.com) |
Bulkowski notes approximately 24% of patterns exceed 60% success (tradable threshold); test these on Nifty with context for your setups.
How to Avoid False Signals in Triple Candle Patterns
Avoiding false signals in Triple Candle Patterns is less about the pattern itself and more about the market context, confluence and confirmation.
- Trading in the right market context: Triple candle patterns can form anywhere on the chart, but they work best only when aligned with strong market structure. Focus on patterns that appear near major support or resistance, trendlines or channel boundaries, previous day high/low (for intraday), and demand–supply zones. Avoid trading these patterns in the middle of a range, low-structure areas, or illiquid stocks, as such setups have a higher chance of failure.
- Align with the Higher-Timeframe Trend: Many triple candle patterns fail when traded against the trend. Always trade triple bullish candle patterns in uptrend and triple bearish candle patterns in downtrend to avoid false signals. One can also use a higher timeframe and EMA to identify the trend.
- Check volume behaviour: Volume tells you whether institutions are involved. High volume on the third (confirming) candle increases the probability of the pattern, whereas the low volume on the third (confirming) candle often indicates weak conviction and false setups.
- Use technical indicators: Combine three candle patterns with momentum indicators such as RSI, MACD and EMAs to avoid market noise and false signals. For example, look for a bullish triple candle pattern in RSI oversold zone or MACD bullish crossover. This increases the reliability of the pattern and reduces the entry in false signals.
Hence, to avoid false signals in triple candle patterns it is important to consider strong market structure, trend alignment, volume confirmation, and indicator confluence.
Which Indicators Works Best with Triple Candlestick Patterns?
Triple candlestick patterns become more reliable when combined with different indicators that confirm trend, momentum, and strength. These indicators include RSI, Volume, Moving Averages, and MACD.
RSI (14-period): Higher timeframes offer the most reliable triple candlestick signals, while lower timeframes require strong trend alignment and strict filtering to avoid false setups—especially when you use RSI as a confirmation filter to reduce false entries.

Volume: Volume plays an important role in validating the 3-candlestick pattern. Rising volume on the third candle, typically 1.5 times more than the average volume confirms the buyers/sellers conviction behind the move.

Moving Averages (EMA 20/50): As Moving Averages help to identify the trend of the market, consider the bullish 3-candlestick pattern when price is trading above rising EMA20/50 and bearish 3-candlestick pattern when price is trading below falling EMA 20/50.

This alignment with EMA crossover logic provides dynamic support and resistance, improving confirmation and timing in swing trades.
MACD: MACD cross after the third candle is useful to confirm the momentum of the pattern. A bullish 3-candlestick pattern along with MACD bullish crossover from below zero line is considered to be more stronger. Similarly, a bearish 3-candlestick pattern along with MACD bearish cross from above zero line is considered to be stronger.

Pros and Cons of Using Triple Candlestick Patterns
Pros and Cons of using Triple Candlestick Patterns is mentioned below in the table.
| Pros | Cons |
| Higher reliability due to multi-candle confirmation | Late entry compared to single or double candle patterns |
| Clear shift in market psychology over multiple sessions | Misses early part of the move |
| Filters out many false signals | Fails in low-volume or choppy markets |
| Works well near key support and resistance zones | Requires additional confirmation for consistency |
| Effective across intraday, swing, and positional trading | Less frequent compared to simpler patterns |
| Easy to visually identify on charts | Can give false signals against the higher-timeframe trend |
Triple candlestick patterns offer higher accuracy and clearer confirmation, but they should be used with proper market context and additional indicators to manage late entries and avoid false signals.
Top Bullish 3-Candle Patterns
The top bullish 3-candle patterns are mentioned below in the table.
| Pattern Name | Market Context | What It Signals |
| Morning Star | Downtrend / Correction | Shift from selling pressure to buying control |
| Three White Soldiers | After downtrend or consolidation | Sustained bullish momentum |
| Bullish Abandoned Baby | Downtrend | Sharp sentiment reversal |
| Three Inside Up | Downtrend | Gradual bullish confirmation |
| Three Outside Up | Downtrend | Buyers overpower sellers |
| Three River Bottom | Prolonged downtrend | Selling exhaustion and potential bottom |
| Morning Doji Star | Downtrend | Strong indecision leading to bullish reversal |
When traded with the right market context, volume confirmation, and trend alignment, bullish 3-candle patterns offer high-probability reversal and continuation opportunities.
Top Bearish 3-Candle Patterns
The top bearish 3-candle pattern is mentioned below in the table.
| Pattern Name | Market Context | What It Signals |
| Evening Star | Uptrend / Rally | Shift from buying strength to selling pressure |
| Three Black Crows | After uptrend or consolidation | Sustained bearish momentum |
| Bearish Abandoned Baby | Uptrend | Sharp sentiment reversal |
| Three Inside Down | Uptrend | Gradual bearish confirmation |
| Three Outside Down | Uptrend | Sellers overpower buyers |
| Two Crows | Strong uptrend | Early warning of trend reversal |
| Three Falling Methods | Downtrend (pullback) | Bearish trend continuation |
Bearish 3-candle patterns signal a strong shift from buyers to sellers and work best near resistance with volume and indicator confirmation for higher-probability trades.
What does 3 Green Candles Mean?
Three consecutive green candles means a strong buying momentum, where the price closes higher than its opening for three consecutive sessions. These three green candles indicate the dominance of buyers and weakening momentum of sellers.
During a downtrend it usually suggests short term pullback or pause, whereas, in an uptrend it confirms the bullish continuation. A combination of three green candles reflects strengthening demand and positive market sentiment.
What does 3 Red Candles Mean?
Three consecutive red candles means a sustained selling pressure, where the price closes lower than its opening for three consecutive sessions. These three red candles indicate that the sellers are dominant and the momentum of the bulls is weakening.
During an uptrend it usually suggests short term reversal or correction and in a downtrend it validates bearish continuation. A combination of three red candles is a warning signal that the market sentiment has shifted to negative and buyers are becoming weaker.


 Previous Article


![15 Investing.com Alternatives [Free+Paid] You Should Use in 2026](https://www.strike.money/wp-content/uploads/2026/04/Investing.com-Alternatives.jpg "15 Investing.com Alternatives [Free+Paid] You Should Use in 2026 92")
![15 TradeStation Alternatives [Free+Paid] You Should Use in 2026](https://www.strike.money/wp-content/uploads/2026/04/TradeStation-Alternatives.jpg "15 TradeStation Alternatives [Free+Paid] You Should Use in 2026 93")
![15 Chartink Alternatives [Free+Paid] You Should Use in 2026](https://www.strike.money/wp-content/uploads/2026/04/Chartlink-Alternatives.jpg "15 Chartink Alternatives [Free+Paid] You Should Use in 2026 94")
: Overview, 10 Types of Indicators, Settings for Different Markets 95")


 : Definition, Formula, calculation, Uses, Advantages Vs limitations 98")


No Comments Yet.