A three inside down pattern is a price chart candlestick formation that signals a bearish trend reversal. A three inside down pattern comprises three candlesticks including a long bullish candlestick, a smaller bearish candlestick contained within the first candlestick and a third bearish candlestick that closes below the second candlestick. The three inside down candlestick pattern forms at the end of an uptrend, indicating a shift to a downward bearish trend. The formation of the three inside down candlestick pattern is the result of the buyers or bulls losing the dominating position they had held to the sellers or bears.
The three inside down candlestick pattern is considered a bearish harami pattern that is followed by a confirmation candlestick. The first two candlesticks of the pattern are essentially a bearish harami pattern. They resemble the figure of a woman carrying a child in her womb, as suggested by the Japanese word ‘harami’ meaning ‘pregnant’. The third candlestick of the pattern is nothing but a confirmation candlestick, that confirms the bearish trend reversal. The best time to trade using the three inside down candlestick pattern is after the appearance of the third candlestick of the pattern. Investors and traders tend to take up short positions at the end of the day when the third confirmation candlestick appears.
The two main advantages of the three inside-down candlestick patterns include their ability to be spotted easily and their suitability for short-term and intraday trading. Three inside down candlestick patterns are however very commonly found and hence not always reliable. The two main disadvantages of the pattern include its tendency to signal reversals which are small or insignificant and its tendency to produce false signals. The three inside down pattern must ideally be used along with other technical indicators to produce reliable results.
What is the Three Inside Down candlestick pattern?
The three inside down is a price chart candlestick pattern that predicts upcoming bearish trend reversals. The three inside down candlestick pattern falls under the category of ‘triple candlestick patterns’. Triple candlestick patterns are price chart formations comprising three candlesticks that signal either a trend reversal or a trend continuation.

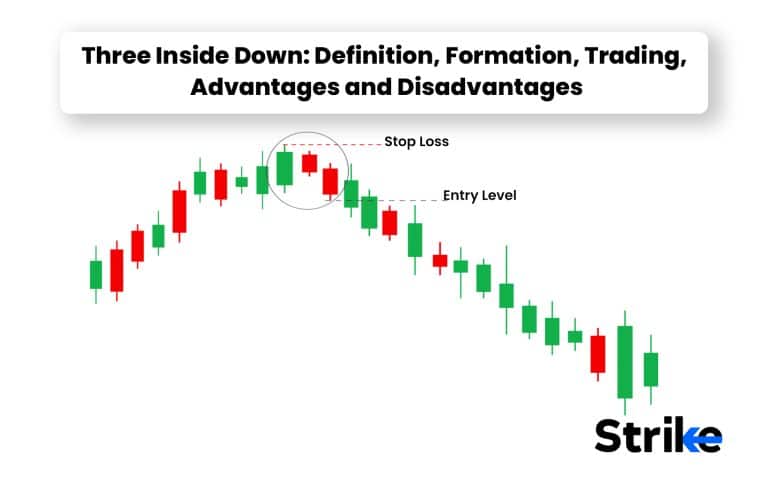
The image above represents the structure of the three inside down candlestick patterns.
The image indicates that the three inside down candlestick comprises a long bullish candlestick, a second small-bodied-bearish candlestick with its open and close price contained within the body of the first candlestick and a long bearish candlestick closing below the close of the second candlestick.
The three inside down candlestick pattern is a triple candlestick pattern and occurs at the end of a bullish uptrend and it tells the traders that the bullish trend is coming to an end. The three inside down pattern indicates that the bears are starting to gain dominance over the bears in the market. Traders alter their trading strategies upon seeing the three inside down patterns and resort to trading strategies such as shorting to gain maximum advantage from the upcoming bearish trend reversal.
How is Three Inside Down Candlestick Formed?
A three inside down candlestick pattern forms at the end of a bullish trend when the bears or sellers start to gain dominance over the bulls or buyers. The buyers or bulls are in a dominating position at the beginning of the three inside down candlestick patterns and the first candlestick is a bullish candlestick. The second candlestick of the three inside down pattern marks a change in the market sentiments as it closes below the close of the prior candlestick. The second candlestick is a bullish or bearish candlestick, which is fully contained within the body of the first candlestick. The close of the second candlestick is however always below that of the first. The sellers start to gain a winning edge over the buyers from the second candlestick of the pattern. The third candlestick is a bearish confirmation candlestick with its close below the close of the second one. The third candlestick confirms the upcoming bearish trend reversal.
A three inside down pattern looks like a bearish harami pattern that is followed by a confirmation candlestick. The image below represents the harami pattern within the three inside down formation.

The image shows that the first two candlesticks of the pattern form the harami pattern, which resembles the figure of a pregnant woman. The harami is followed by a bearish confirmation candlestick in a three inside down pattern. Investors and traders identify three inside down candlesticks through the structure of the candlesticks that contribute to their formation.
What does Green Three Inside Down Candlestick tell?
A green three inside down candlestick is a variation in the three inside down candlestick pattern. A green three inside down candlestick comprises a bullish second candlestick. The body of the second green candlestick lies fully within the body of the prior bullish candlestick and its close is lower than that of the first candlestick. The green three inside down candlestick is also a bearish trend reversal signal. It indicates that the ongoing bullish trend is becoming less potent. A second candlestick that is fully contained within the body of the prior candlestick indicates that the range of difference between the open and close prices is decreasing and that buyers or bulls are becoming less interested in buying and that the sellers or bears are starting to dominate.
How Important Is the Color of the Three Inside Down Candlestick?
The color of the three inside down candlestick gives the traders and investors important information about price action. The color of the three inside down candlesticks tells the investors and traders how the price of the security is fluctuating and this in turn allows them to assess the volatility of the market environment. A green three inside down candlestick implies a gradual change in the price action and a slower shift to a bearish trend. A red three inside down candlestick implies a more volatile market scenario where the price action fluctuations are more rapid.
When does Three Inside Down Candlestick happen?
The three inside down candlestick happens towards the end of a bullish trend. The appearance of the three inside down marks the start of a bearish trend reversal. The first candlestick of the three inside down candlestick is a bullish candlestick, implying that the bulls are in a dominating position at the beginning of the three inside down formations. The second candlestick opens within the body of the first and closes at a price that is lower than that of the previous candlestick’s close. The second candlestick is the one that marks the start of the trend reversal. The third candlestick confirms the bearish trend reversal as it closes lower than the prior candlestick’s close. The three inside down candlestick, thus, occurs at the end of a bullish trend and marks the beginning of a bearish trend.
How often does Three Inside Down Candlestick occur?
The three inside down candlestick occurs very frequently. The three inside down candlestick pattern appears before short-term price movements as well as longer-term trend reversal making it a pattern that often occurs in price charts. The three inside down candlestick pattern is easily spotted at the end of bullish trends and the beginning of potential bearish trend reversals.
How to read Three Inside Down Candlestick in Technical Analysis?
There are primarily three steps involved in reading a three inside down candlestick in technical analysis including price chart analysis, identification and confirmation. Investors and traders, firstly, have to observe and analyze the price chart of the security they are interested in trading. Price charts are easily found online free of cost. Investors and traders must use the trading view to observe the candlestick patterns. The price charts give basic information about the current market sentiment, the ongoing trends and the direction of the price action. The image below shows a basic price chart that is charted with price and time.

The chart depicts the daily price action of shares of the company Goldman Sachs. The image shows that the price action keeps fluctuating and by analyzing the price chart, investors and traders can get information about the current market sentiment.
Secondly, investors and traders must identify the three inside down candlesticks. The three inside down candlestick comprises three candlesticks including a long bullish candlestick, a second bullish or bearish candlestick and a third bearish candlestick.The second candlestick must lie completely within the body of the first and must have its close below the close of the first and the third must close below the close of the second.
Thirdly, investors and traders must confirm the candlestick pattern during technical analyisis. The confirmation for the three inside down pattern is in the third candlestick which has its close below the close of the second candlestick. The bearish trend reversal is considered to be confirmed once the third bearish candlestick of the pattern appears. The image above shows the confirmation candlestick as the number 3.
How accurate are the Three Inside Down Candlesticks in Technical Analysis?
According to financial analyst Thomas N. Bulkowski, the pattern has a accuracy rate of 63%. The accuracy of the three inside down candlestick patterns is not reliable when used in isolation. Investors and traders tend to use the pattern along with other technical indicators including Moving Averages, Relative Strength Indicators (RSI), Fibonacci indicators etc. The three inside down candlestick is considered more suited for short-term trend reversals and intraday trading.
When is the best time to Trade using Three Inside Down Candlestick?
The best time to trade using the three inside down candlestick pattern is considered to be after the appearance of the third candlestick of the pattern. The ideal time is when the third candlestick appears as it is the confirmation candlestick. The third candlestick lets the investors and traders know that a bearish trend reversal is imminent. Shorting is a common trading strategy that investors and traders use once the third candlestick of the three inside down confirms the upcoming downtrend. Investors and traders tend to take up short positions at the end of the day when the third confirmation candlestick appears.
How to Trade with Three Inside Down Candlesticks in the Stock Market?
There are primarily five steps to trading with the three inside down candlesticks in the stock market including identifying the pattern, confirming the pattern, setting a stop loss, making profits and monitoring the market. Investors and traders can also use other technical indicators along with the three inside down candlestick pattern to avoid incurring losses. The five main steps are listed below.
Firstly, identify the Three Inside Down Candlestick pattern. The first step to trading the three inside down candlestick pattern is to look for the pattern on a stock chart by identifying a long bullish candlestick followed by a smaller bullish or bearish candlestick completely engulfed by the first one, and a long bearish candlestick that closes below the low of the second candlestick. The three inside down candlestick pattern are easily spotted using its distinct triple candlestick pattern.

The image above shows the triple candlestick pattern on a price chart and its structure using which it is identified.
Secondly, wait for confirmation. The second step to trading the three inside down candlestick patterns is to wait for confirmation. The confirmation candlestick for a three inside down pattern is the third candlestick, which is always a bearish candlestick that closes below the close of the previous candlestick. The confirmation candlestick tells the investors and traders that a bearish trend reversal is imminent.
Thirdly, set a stop loss. The third step to trading the three inside down candlestick pattern is to set up a stop loss. A stop loss is an order to automatically sell securities when the price reaches a certain level. Stop losses prevent high losses. Investors and traders trading with the three inside down patterns must place a stop-loss order just below the first, second or third candlestick of the pattern. The location of the stop loss depends on the degree of risk the investor is willing to take. Placing the stop loss below the third candlestick involves the least amount of risk as well as the least amount of rewards. Placing the stop loss below the low of the first candlestick ensures the most rewards but at the same involves the highest amount of risks. It is for each investor to decide on his or her risk appetite.
Fourthly, book profit. The fourth step in trading the three inside down candlestick pattern is to take profits. Investors use strategies such as shorting to gain profits from trading using the three inside down pattern. Investors tend to enter short positions towards the end of the third candlestick or the beginning of the candlestick that follows the third one to make gains.
Lastly, monitor the market. The fifth and final step to trading the three inside down candlestick patterns is to monitor the market. Investors and traders must be constantly aware of the overall market trends and sentiments to gauge the accuracy of the signals that the three inside down candlestick produces. Three inside down candlesticks always appear at the end of a bullish trend and signal bearish trend reversals.
Investors and traders must ideally use the three inside down patterns for trading purposes along with other technical indicators such as moving averages or the RSI to ensure the accuracy and reliability of the three inside down patterns.
Where is the Three Inside Down commonly used?
The Three Inside Down candlestick pattern is a commonly used technical analysis tool in the financial markets, including stocks, bonds, forex, and commodities. The signals of the three inside down are interpreted differently by each trader depending on their investment goals.
Is the Three Inside Down in an Uptrend a Sell Signal?
The three inside down in an uptrend is a signal that the uptrend is reversing and that the prices of the security are going to drop. It is up to the investor or trader to interpret this as a sell signal or a hold signal depending on their investment strategies and the time frame they are focusing on. Long-term investment holders prefer to hold on to the securities during the bearish reversal whereas short-term traders and intraday traders prefer to sell their securities.
What are the advantages of the Three Inside Down Candlestick Pattern?
The advantage of the three inside down candlestick patterns is primarily the ease with which they are identified on a price chart. Beginners to trading and price charts are able to easily identify the three inside down patterns on price charts as it is so commonly found and easy to spot. The two main advantages of the three inside-down candlestick patterns are listed below.
Ability to be spotted easily. The main advantage of the three inside down patterns is that they can be spotted easily on the price chart. Investors and traders use its distinct shape with a long bullish candlestick followed by a smaller bullish or bearish candlestick completely engulfed by the first one, and a long bearish candlestick that closes below the low of the second candlestick to spot them on a price chart.
Suitability for short-term and intraday trading. The second main advantage of the three inside down patterns is that they are ideal for short-term and intraday trading. The three inside down pattern indicates even minor trend changes which are useful for short-term traders and intraday traders.
Other advantages of the three inside down pattern are its ability to function well with other commonly used technical indicators such as the moving averages, the Fibonacci retracement tool or the Relative Strength Indicator. The three inside down pattern also works well with all financial markets including stocks, bonds, forex and commodities.
What are the disadvantages of Three Inside Down Candlestick?
The main disadvantage of the three inside down patterns is their reliability. The three inside down pattern is one that appears frequently and trend reversals that it predicts, therefore sometimes tends to be very short-lived ones. The two primary disadvantages of the pattern are listed below.
Tendency to signal reversals which are small or insignificant. The main advantage of the three inside down pattern is that it often signals reversals which are insignificant and short-lived. Investors who alter their trading strategies based on the three inside signals alone often find themselves incurring losses. The pattern is more suited for traders involved in short-term and intraday trading.
Tendency to produce false signals. The second disadvantage of the three inside pattern is that it has the tendency to produce false signals. Investors who use the three inside down pattern in isolation are at risk of incurring losses.
Investors and traders must ideally use the three inside down pattern along with other technical indicators so that their signals are cross-checked and losses are prevented. It is also advisable to assess the market conditions carefully before taking on trades. Investors must also be aware of the pattern contrary to the three inside down pattern, which is the three inside up pattern and not confuse the two.
What is the Opposite of Three Inside Down Candlestick?
The opposite of the three inside down candlestick is the three inside up candlestick. The three inside up is a triple candlestick pattern that signals bullish trend reversals.

The three inside up candlestick comprises a long bearish candlestick, a second bullish or bearish candlestick that is contained within the body of the first candlestick and a long bullish candlestick closing above the close of the candlestick in the middle.
What Candlestick Pattern is Similar to Three Inside Down Candlestick?
The three outside down pattern is a candlestick pattern that is similar to the three inside down pattern. The three-outside down pattern is a price chart candlestick pattern that signals a bearish trend reversal. The three outside down pattern consists of a first bullish candlestick, a second bearish candlestick with a body that is longer than the length of the entire first candlestick and a third bullish candlestick that closes at a price lower than that of the second candlestick. Both the three inside up and down patterns are bearish reversal patterns. The only difference between the two is in the second candlestick of their respective patterns. The three inside down pattern has a second candlestick that is contained within the body of the first and the three outside down comprises a second candlestick that contains the entire length of the first candlestick.
Is the pattern of the Three Inside Down a bullish reversal?
No, the three inside down is a bearish reversal pattern. The three inside down occurs at the end of a bullish trend and signals an upcoming downward reversal.
What is the difference between Three Inside Down and Three Inside Up?
The two main differences between the three inside down and three inside up are listed in the table below.
| Three inside down | Three inside up |
| It is a bearish trend reversal indicator. | It is a bullish trend reversal indicator. |
| The three inside down candlestick comprises a long bullish candlestick, a second bullish or bearish candlestick that has its open and close price lying within the body of the first candlestick and a long bearish candlestick closing below the close of the second candlestick. | The three inside up pattern comprises a long bearish candlestick, a second bullish or bearish candlestick that has its open and close price lying within the body of the first candlestick and a long bullish candlestick closing above the close of the second candlestick. |
Three Inside Down and Three Inside Up are candlestick chart patterns used in technical analysis to identify potential trend reversals in financial markets, particularly in stocks, forex, and commodities. These patterns are closely related, but they indicate opposite outcomes for price movements.


 Previous Article


![15 Investing.com Alternatives [Free+Paid] You Should Use in 2026](https://www.strike.money/wp-content/uploads/2026/04/Investing.com-Alternatives.jpg "15 Investing.com Alternatives [Free+Paid] You Should Use in 2026 64")
![15 TradeStation Alternatives [Free+Paid] You Should Use in 2026](https://www.strike.money/wp-content/uploads/2026/04/TradeStation-Alternatives.jpg "15 TradeStation Alternatives [Free+Paid] You Should Use in 2026 65")
![15 Chartink Alternatives [Free+Paid] You Should Use in 2026](https://www.strike.money/wp-content/uploads/2026/04/Chartlink-Alternatives.jpg "15 Chartink Alternatives [Free+Paid] You Should Use in 2026 66")
: Overview, 10 Types of Indicators, Settings for Different Markets 68")

 : Definition, Formula, calculation, Uses, Advantages Vs limitations 70")


: How We Used This 70/30 Indicator in 6 High Win-rate Strategies 73")


No Comments Yet.