Break of Structure (BOS) is a powerful concept of SMC which changed the way traders interpret the price movement. Break of Structure (BOS) helps traders to identify the decisive shift in market control, confirming market trend and deciding trend bias.
The core concept of break of structure dates back to Dow Theory in the early 1990s, where market structures were defined by higher highs/lows or lower highs/lows. In the early 2000s, modern traders redefined this idea and after 2017, SMC popularised BOS as a structured way to read institutional momentum and continuation moves.
What is a Break of Structure (BOS) in Trading?
Break of structure in trading refers to the break of previous swing high (bullish BOS) or swing low (bearish BOS) in order to continue the trend of the market. The concept of break of structure (BOS) is mostly used within Smart Money Concepts (SMC) and Inner Circle Trader (ICT) methodologies.
How Break of Structure Works?
The break of structure works by confirming the trend continuation, when price decisively breaks the previously established highs or lows. There are three main three main phases in BOS, which includes structure formation, the break, confirmation and continuation.
- Structure Formation: Market first creates a structure formation by forming higher hives and higher lows in an uptrend, and a lower high or a lower low in a down trend. This phase shows accumulation or distribution where institutions accumulate or build positions and liquidity around critical levels.
: Meaning, 5 Types, Trading Strategy with Example, Win Rate 33")
- The Break: A BOS occurs when price closes above or below the swing high or low, not a wick. This decisive break is an indication of good momentum and intent, which often happens in high liquidity sessions such as London or New York.
- Confirmation & Continuation: Once price breaks the market structure, it usually tests the broken structure after the break. When the level holds and price is restored in the same direction, then the new structure is confirmed, and the trend is continued. Liquidity grabs are often marked by failed breaks that are not followed up.
: Meaning, 5 Types, Trading Strategy with Example, Win Rate 34")
In Dow Theory, BOS (Break of Structure) helps traders distinguish between valid trend continuation and spurious movements, which is a core principle of price-action trading.
How is BOS used in Smart Money Concepts?
The BOS are used in smart money concepts to confirm the continuation of the trend and the directional bias, which helps traders to align their trade with big players driving the trend.
In the smart money concept (SMC) the break of structure is created by taking up the liquidity. Institutions often sweep stoplosses above swing highs or below swing low to fuel the BOS. However, the BOS is not considered an entry signal, because smart money often waits for price to retrace back to areas of interest such as order blocks or fair value gap before reentering.
In Smart Money Concepts, BOS is mainly used to define trend bias, while the entry is typically taken after price retraces back to an area of interest in the direction of the break of structure.
How to Identify a Break of Structure on the Chart
There are four major steps to identify the break of structure (BOS). The steps are identifying the market structure, locating the key market structure, waiting for break and confirming the BOS.
: Meaning, 5 Types, Trading Strategy with Example, Win Rate 35")
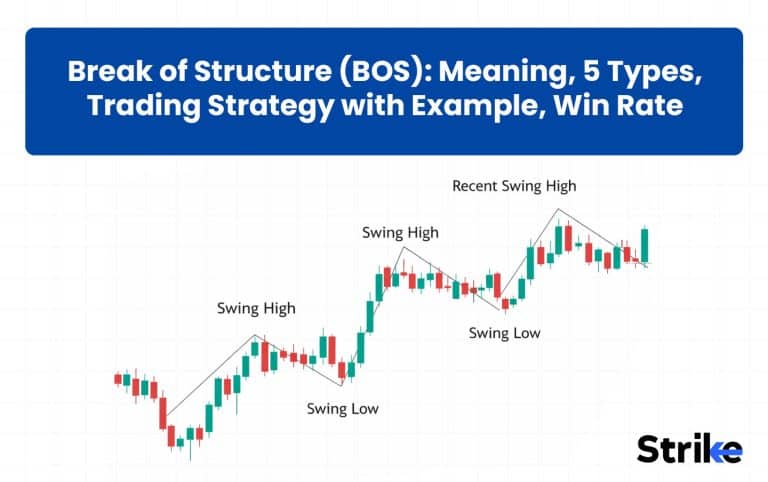
- Identify Current Market Structure: Mark the market structure, which is clear swing highs and swing low points. Focus on marking higher high and higher low in an uptrend and lower high and lower low in a downtrend.
- Locate the Key Structure Level: Mark the recent swing high in an uptrend for bullish BOS and recent swing low in a downtrend for a bearish BOS. Thai is the key level that the market should break for BOS.
- Wait for the Break of the Key Support level: Wait for candle to give a decisively closing above or below the market key structural level, a wick break is not enough. Price should sustain above or below the BOS after the break.
- Confirm the New Structure: After price hold, the broken level serves as the support or resistance and that and confirms the valid BOS.
A valid BOS isn’t about speed or momentum—it’s about acceptance. If price breaks, closes, and then holds above or below the structure, the structure is broken, signaling a shift in Market Trends.
How do you Confirm a BOS?
There are four main parameters to check to confirm the valid BOS. The parameters are mentioned below.
- Correct structural level: Price must break the last swing high in an uptrend or last swing low in a downtrend.
- Candle closes: The candle should close decisively outside the swing point, wick is not enough to confirm the BOS.
- Strong momentum: A candle should break the structural level with impulsive and momentum, not slow or overlapping.
- Price should hold: Price should sustain above the breakout point after the BOS. It should not immediately reverse back inside the previous structure.
When these four parameters align, the BOS is considered to be valid, which confirms the high confidence in market trend direction, not just a temporary liquidity grab.
Does a Wick Break Count as BOS?
No, a wick break does not count as a BOS because it shows that the price has just touched the level, but failed to sustain. A valid BOS happens when a strong and meaningful candle closes beyond the key structure level. This strong candle suggests institutional participation, who pushes price with strong closing, not just a wick. Considering wick breaks as BOS can lead to false signal because and stoploss.
Which Timeframe should you use for BOS?
The BOS involves use of multiple timeframes instead of a single, where higher timeframes such as 4 hours or daily are used to identify the trend bias. Whereas lower timeframes such as 15 min and 5 min are used for entries and confirmation.
| Purpose | Timeframes | Why Use It |
| Trend Bias / Identify BOS | Daily, 4H, 1H | Filters market noise and highlights reliable, institutional structure breaks |
| Entry Confirmation | 15M, 5M, 1M (Scalping) | Allows precise break–retest entries and fits well with Indian market sessions |
| Overall Analysis | Multi-Timeframe (Top-Down) | Higher timeframe defines direction, lower timeframe improves execution |
Trading BOS using multitimeframe allows traders to align their trade with broader market trends and increases winning probability.
What are the Different Types of BOS?
There are five major types of BOS based on market structure and trend context. The types are bullish BOS, bearish BOS, internal BOS, external BOS, and liquidity BOS.
1. Bullish BOS
A bullish BOS occurs when price breaks above the previous established high, which confirms that buyers are in control and the market is continuing the uptrend. A bullish BOS happens after accumulation or a pullback.
: Meaning, 5 Types, Trading Strategy with Example, Win Rate 36")
For confirmation, traders look for a strong candle close above the prior high and enter the trade on pullback after the break.
2. Bearish BOS
A bearish BOS occurs when price breaks below the previous established low, which confirms that sellers are in control and the market is continuing the downtrend. A bearish BOS happens after accumulation or a pullback.
: Meaning, 5 Types, Trading Strategy with Example, Win Rate 37")
For confirmation, traders look for a strong candle close below the prior low and enter the trade on pullback after the break.
3. Internal BOS
An internal BOS is a minor or short-term break of structure within a larger trend, usually on a lower timeframe. It represents a smaller shift in momentum within the broader trend, not a trend reversal of the higher timeframe.
: Meaning, 5 Types, Trading Strategy with Example, Win Rate 38")
Traders use internal BOS to fine-tune their entries and position during pullback, especially when it aligns with broader market trends.
4. External BOS
An external BOS refers to thebreak of the major swing highs or lows visible on a higher timeframe. External BOS confirms strong trend continuation of the broader trend. External BOS is more reliable than the internal BOS and is mostly used to identify market direction and to make swing trading positions.
: Meaning, 5 Types, Trading Strategy with Example, Win Rate 39")
5. Liquidity BOS
A Liquidity BOS occurs when price briefly breaks high or low to grab liquidity and then moves in the desired direction. It usually traps breakout traders and takes away stop-losses prior to the actual move. The confirmation comes when price reclaims the structure with a strong.
: Meaning, 5 Types, Trading Strategy with Example, Win Rate 40")
momentum, confirmation of institutional participation. False breakouts and high-probability entries around key levels are best avoided by Liquidity BOS.
How to Trade Break of Structure? [With Example]
There are four major steps to trade break of structure (BOS). The steps include identifying the trend, waiting for valid BOS, enter on pullback on lower time frame, and risk management.
- Identifying the trend: Identify the major market trend on a higher timeframe such as 4H or daily by marking major swing highs and swing lows to decide trend bias.
: Meaning, 5 Types, Trading Strategy with Example, Win Rate 41")
- Wait for valid BOS: Price must close decisively beyond the structure for a valid BOS.
: Meaning, 5 Types, Trading Strategy with Example, Win Rate 42")
- Enter on Pullback (LTF): After a valid BOS, shift to a lower timeframe such as 15 min or 5 min. Wait for price to get in the area of interest such as the order block or demand zone. You can also enter the trade if one internal BOS aligns with a major trend.
: Meaning, 5 Types, Trading Strategy with Example, Win Rate 43")
- Manage Risk: Put your stoploss below or above the area of interest or recent swing low or high. Follow 1:2 RR for target or higher timeframe swing points.
: Meaning, 5 Types, Trading Strategy with Example, Win Rate 44")
BOS is mostly used for confirmation instead of speculation. The performance of BOS increases when aligned with higher timeframe, liquidity context, and disciplined execution.
How Can You Avoid False BOS Signals?
There are three important parameters to check before validating a BOS. The parameters are mentioned below.
- Wait for candle close: A candle should give a decisive closing beyond the previous structural point. A wick break often gives a false BOS signal.
- Check higher timeframe trend: A formation of BOS against the major trend often leads to false signals with higher failure rate.
- Watch for the retest: A genuine BOS sustains after breaking the structure level and holds the broken level as support/resistance, whereas false BOS fails quickly.
A valid BOS shows close, acceptance, and continuation. Anything else is usually noise.
How to Use BOS in Forex Trading?
In forex trading BOS is used to confirm the continuation and directional bias. Traders mostly use a higher timeframe to mark BOS because the Forex market is open for 24 hours for 5 days a week, it creates constant price fluctuation and stoploss hunting on a lower timeframe. direction of the trend on a higher time frame to decide the trend bias and execute entries on a smaller timeframe in the same direction.
Whereas, a higher timeframe such as 4 hours or Daily provides more reliable BOS because it reflects broader institutional participation across multiple sessions. Hence, use BOS in forex trading on a higher time frame to confirm market trend, then drop down to a lower time frame to plan a trade when price retraces the important zone.
What Indicators can help Identify BOS Easily?
There are four well known indicators to identify BOS easily. Although the BOS is purely a price action concept, these indicators can make BOS easier to spot, confirm, and filter false breaks, especially for Forex traders.
- ZIgZag: This indicator automatically marks the structural points on charts such as swing highs and swing lows specially on higher time frames. Traders can monitor such structural points for BOS.
: Meaning, 5 Types, Trading Strategy with Example, Win Rate 45")
- Moving Averages: Moving Averages helps to filter the BOS, a bullish BOS above EMA is more reliable. Similarly, a bearish BOS is more reliable when formed below EMA.
: Meaning, 5 Types, Trading Strategy with Example, Win Rate 46")
- Volume: Volume will help you to find strong and valid BOS. A BOS with strong volume is more reliable than the BOS with less volume.
: Meaning, 5 Types, Trading Strategy with Example, Win Rate 47")
- Relative strength Index (RSI): A formation of bullish BOS with RSI above 50 is more reliable. Similarly, a bearish BOS with RSI below 50 increases the reliability. Also if the RSI is showing divergence near BOS, it could be a failure.
: Meaning, 5 Types, Trading Strategy with Example, Win Rate 48")
A trader can use the combination of the above indicators to increase the probability of finding a reliable BOS using the right Trading Indicators.
Is BOS a Profitable Trading Strategy?
Yes, BOS is a profitable trading strategy but only when it is used with the right context. It is important to understand that BOS alone is not a complete strategy, it is a structural framework which allows traders to align themselves with dominating trends.
Profitability of BOS increases when combined with order block, supply and demand, and internal market structure with proper risk management.
However, BOS often fails when traders trade against the higher-timeframe trend or ignore liquidity and volatile session timing, which can derail even a well-planned Profit Target.
What is the Win Rate of BOS?
The win rate of BOS varies widely on how it is used, filtered, and executed. ePlanet Brokers tested the BOS trading setup on different active sessions and time frames.
In their strategy comparison table, they list estimated performance metrics for three BOS trading approaches.
| Strategy | Timeframe | Win Rate (Approx) | R/R Ratio | Trades/Month |
| London Breakout | 1H–4H | ~65% | 1:2 | 8–12 |
| New York Reversal | 4H–Daily | ~70% | 1:3 | 4–6 |
| Weekly Structure | Weekly–Daily | ~55% | 1:4 | 2–3 |
These figures are examples used to illustrate the relative performance of different BOS methods on their site. However, they come with typical disclaimer language that performance isn’t guaranteed.
Benefits vs Limitations of Using Break of Structure
The benefits vs limitations of using break of structure is mentioned below in the table.
| Aspect | Benefits of BOS | Limitations of BOS |
| Trend Identification | Confirms a genuine shift in market direction by breaking key highs or lows | Can fail if the break is against a strong higher-timeframe trend |
| Trade Clarity | Reduces confusion by focusing only on meaningful price structure | Structure interpretation can be subjective (wick vs close, internal vs external) |
| Signal Quality | Filters random price noise and avoids indicator overload | Frequent false signals during low-volume or manipulated moves |
| Entry Planning | Enables high R:R entries on pullbacks or retests after the break | Entries may feel late as BOS confirms after the move begins |
| Timeframe Flexibility | Works across all timeframes due to its fractal nature | Lower timeframes produce more fake BOS due to market noise |
| Market Alignment | Keeps traders aligned with institutional momentum | Ineffective in sideways or range-bound markets |
| Strategy Compatibility | Combines well with liquidity, supply-demand, RSI, volume, and EMA | Weak performance when used as a standalone strategy |
| Risk Management | Clear invalidation levels improve stop-loss placement | Poor risk-reward if taken without confirmation or retest |
BOS is mostly used for confirmation instead of speculation. The performance of BOS increases when aligned with higher timeframe, liquidity context, and disciplined execution.


 Previous Article


![15 Investing.com Alternatives [Free+Paid] You Should Use in 2026](https://www.strike.money/wp-content/uploads/2026/04/Investing.com-Alternatives.jpg "15 Investing.com Alternatives [Free+Paid] You Should Use in 2026 68")
![15 TradeStation Alternatives [Free+Paid] You Should Use in 2026](https://www.strike.money/wp-content/uploads/2026/04/TradeStation-Alternatives.jpg "15 TradeStation Alternatives [Free+Paid] You Should Use in 2026 69")
![15 Chartink Alternatives [Free+Paid] You Should Use in 2026](https://www.strike.money/wp-content/uploads/2026/04/Chartlink-Alternatives.jpg "15 Chartink Alternatives [Free+Paid] You Should Use in 2026 70")
: Overview, 10 Types of Indicators, Settings for Different Markets 72")

 : Definition, Formula, calculation, Uses, Advantages Vs limitations 74")


: How We Used This 70/30 Indicator in 6 High Win-rate Strategies 78")


No Comments Yet.