The best time frame in the stock market depends on how you want to read price movement and how quickly you expect trades to play out. Best Time Frame for Trading in the stock market also informs the traders about the trend reading, spot reversal, and entry and exit planning.
Various traders apply different time windows, some will take shorter timeframes and get faster opportunities, others will take longer timeframes and get a better and more consistent picture of the trend. Timing is important since it helps to sift the noise, make decisions regularly, and fit your analysis to your personal style of trading.
What Are Trading Timeframes?
Trading Timeframes are specific periods of time that traders and investors use on the price charts in order to understand and interpret the price movement and reaction to make trading decisions. Each time frame reveals varying degrees of information on the market action.
The most common timeframes are are M1 (1-minute), M5, M15, M30, H1 (1-hour), H4, D1 (daily), W1 (weekly), and MN (monthly) available on platforms such as TradingView or MetaTrader.
How do Timeframes Affect Trading Decisions?
Timeframes directly influence how you read the market, make entries, set stop-losses, and manage risk. Each timeframe shows a different “version” of the trend, and that changes the decisions you take.
- Impact on Market Perception: Smaller timeframes indicate a rapid change in trends and make movements appear larger than normal. The longer periods reflect more smooth and clear trends. Your chosen timeframe determines how you view the market.
- Impact on Entry & Exit Timing: Short timeframes make you enter and exit the trade very frequently, whereas, the long timeframes make you wait for a stronger setup..
- Impact on Risk Management: Shorter periods have narrow stop-losses because of noise and volatility. Longer periods permit broader stops that have more consistent trend structure.
- Influence on Trading Psychology: Faster charts lead to emotional decisions and overtrading whereas longer periods help to be more patient and disciplined.
- Influence on Strategy Choice: Scalping, intraday strategies and swing/positional systems all apply fine on 1m -5m, 15m-1H charts and Daily-Weekly charts, respectively.
The timeframe you choose directly controls how you see the market, and the way you see the market decides when you enter, where you exit, and how much you risk.
Different Types of Timeframes Traders Use for Trading
There are three different types of timeframes in trading. The types are lower timeframe, medium timeframe, and higher timeframe.
Lower Timeframes
In the stock market, lower timeframes refer to price charts that display market activity over short intervals, such as 1-minute, 3-minute, 5-minute,and 15-minute. This timeframe is commonly used by scalpers and intraday traders.
Characteristics of Lower Timeframes
- High Volatility and Noise: Lower timeframe are faster and exhibits more noise or fluctuation compared to higher timeframes
- More Trading Opportunities: The faster pace of a lower timeframe provides more trading opportunities.
- Psychological Challenges: High speed and constant price fluctuation can lead to impulsive and emotional trading decisions.
- Requires Active Monitoring: Traders trading at a lower timeframe requires constant monitoring during the market hours to manage and modify their trades actively.
Lower timeframe offer frequent trades, but requires strong discipline, quick decision-making, and emotional control
Medium Timeframes
Medium timeframes typically include 30-minutes, 1-hour, 2-hour, and 4H-hour, providing balance between noise and clarity. This timeframe is commonly used by intraday and swing traders.
Characteristics of Medium Timeframes
- Trade Duration: This time frame is usually used by swing traders where positions are held for a few hours to several days, or even a few weeks.
- Reduced Noise: Medium Timeframe filters out minor price fluctuations, providing clearer signals.
- More Time for Analysis: It allows traders to have more time to research and make decisions compared to high-pressure day trading.
- Trend Identification: Helps identify clear, sustainable trends and chart patterns that might be missed on shorter timeframes.
The medium timeframes are balanced between speed and reliability, which makes them the best timeframes for trend traders.
Long-Term Timeframes
The long-term time frames include Daily, Weekly, and Monthly charts, primarily used by long-term investors and positional traders. These charts represent significant market trends, macro cycles and better price formations that move in weeks, months or even years.
Characteristics of Long-Term Timeframes
- Investment Horizon: Positions are held for months, years, or even decades, allowing the investment to benefit from long-term economic growth.
- Reduced Stress and Time Commitment: Investors and positional traders do not need to monitor the market constantly.
- Lower Transaction Costs: The infrequent trading nature results in significantly lower brokerage and tax costs compared to short-term trading.
Long-term timeframes focus on big trends and long-term growth, which is mostly suitable for investors
Difference between Low time frame vs High Time Frame
The difference between Low time frame vs High Time Frame is mentioned below in the table.
| Feature | Low Timeframe | High Timeframe |
| Examples | 1M, 3M, 5M, 15M | Daily, Weekly, Monthly |
| Trade Type | Scalping, Intraday | Swing, Position, Long-term |
| Signal Frequency | High – frequent signals | Low – fewer but stronger signals |
| Trend Clarity | Less clear, noisy | Clearer, major trend visible |
| Stop-Loss & Target | Tight stops, small targets | Wider stops, larger targets |
| Decision Speed | Fast decisions required | Slower, more time for analysis |
| Risk | Higher probability of false signals | Lower risk due to reduced noise |
| Emotional Stress | High – quick trades | Low – patient trades |
| Best Use | Short-term profit capture | Long-term trend following |
All the timeframe have their own advantage and disadvantage, but the choice depends on a trader’s style, patience, and risk tolerance
How to Choose the Right Timeframe?
Choosing the right timeframe for trading totally depends on your trading style, risk tolerance, available time, and market conditions to optimize signal clarity and profitability. There are four major steps to choose the right timeframe for trading. The steps are identifying the trading style, considering risk tolerance, checking market volatility and time availability.
1. Identify Your Trading Style: Different traders use different charts based on how long they hold positions and how quickly they want to trade.
| Trading Style | Preferred Timeframes | Purpose |
| Scalper | 1M – 15M | Fast trades, quick entries and exits |
| Intraday Trader | 30M – 4H | Trend-based setups within the same day |
| Swing / Position Trader | Daily – Weekly | Long-term moves and higher-accuracy trends |
2. Consider Your Risk Tolerance: Risk tolerance shapes timeframe selection in trading, balancing stop-loss sizes, trade frequency, and emotional demands for strategies like Fair Value Gaps on Nifty.
- Lower timeframe: It has small stop-losses, rapid trades, higher emotional stress.
- Higher timeframe: It has wider stop-losses, fewer trades, more patience, less stress.
3. Check Market Volatility: Higher volatility market suits lower timeframes for short-term profits. whereas, a stable and trending market suits higher timeframes for swing/position trades.
4. Match Your Time Availability: Select timeframe based on your availability. The lower timeframe requires more attention and fast execution, whereas the higher timeframe requires less monitoring and is suitable for part-time traders.
Selecting the right timeframe transforms market noise into actionable clarity—tailor it to your style for enduring success.
How often Should a Trader Switch Their Primary Trading Timeframe?
A trader should rarely switch their primary trading timeframe once a strategy is established and performing as expected. Consistency is the key of effective trading, and frequent switching around, also referred to as chart-hopping, may result in confusion, emotion-based trading, and non-consistency.
When a Switch Might Be Consider
A change in the primary trading timeframe might be considered under specific circumstances.
- Significant Lifestyle Changes: If the traders availability for the market monitoring changes significantly, they may need to move to a longer timeframe to manage their new schedule.
- Strategy Review and Optimization: A trader can consider changing their timeframe during the performance review of their trading strategy to increase the efficiency of the setup.
How to Trade using Multi Timeframe Analysis(MTFA)?
Traders use Multi Timeframe Analysis(MTFA) as a top down approach to see the full market picture, trend, structure, and precise entry points by combining higher, medium, and lower timeframes. It improves accuracy because every timeframe has its own purpose.
There are three major steps how a trader uses Multi Timeframe Analysis(MTFA). The steps are identifying the trend using a higher timeframe, spotting patterns or zones on medium timeframe and taking entry on lower timeframe.
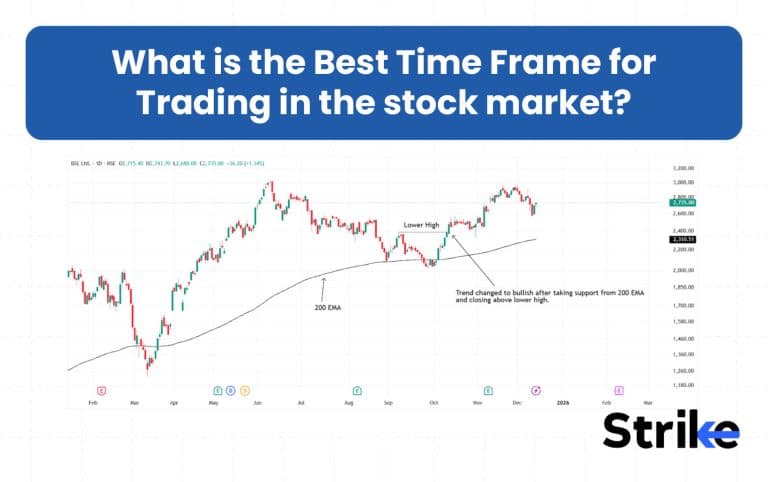
Identifying the major trend using higher timeframe (HTF): Use Daily or H4 time frame to identify the broader market trend, such as up, down or sideways. Mark the important levels or zones. This helps to decide big pitcher bias.

In this pitcher we can clearly see BSE stock changed its trend from bearish to bullish after taking support from 200 EMA, indicating broader trend has changed to bullish.
Move to a medium timeframe (MTF) to spot zones and patterns: Use 1H or 30-minute to refine levels and find trading setups at important levels markets on HTF. It helps identify patterns, liquidity zones, or premium/ discount areas.

Switch to the lower timeframe (LTF) to time your entry: Use 5-minute or 15-minute for entry. Watch for breakout of patterns or reversals at support and resistance zones marked on MTF. This helps taking precise entry with small stoploss.

Manage the trade with higher timeframe (HTF) levels: Targets are usually based on HTF liquidity levels, swing highs or lows, and large FVG or imbalance zone. Similarly you can use MTF or LTF to exit the market once price forms an opposing structure.
Hence, a valid Multi Timeframe Analysis(MTFA) requires trend from HTF, setup confirmation from MTF, and clean entry signal from LTF. Together all three deliver high-probability trade.
Timeframe Settings Used by Different Types of Traders
Timeframes used by different types of traders such as scalpers, day traders, swing traders and positional traders are mentioned below.
Timeframe Used by Scalpers
Scalpers usually use lower time frames such as 1-minute, 3-minute, 5-minute to capture small and rapid movements multiple times during the sessions. Traders also use a 15-minute and 1-hour timeframe to check trend direction and key levels.
- Scalpers aim to capture 5–20 point moves or very small price inefficiencies.
- Lower timeframes show micro-structure, liquidity grabs, and quick volatility spikes.
- Price moves fast, so traders rely on tight stop-losses, instant decisions, and rapid execution.
- Market noise is high, but scalpers use it to their advantage by trading the rapid push-and-pull around intraday support/resistance.
Ideal for traders who can sit in front of the screen continuously and react quickly.
Timeframe Used by Day Traders
The time frame used by day traders is usually 5-minutes, 15-minutes, and 30-minutes to plan entries, whereas the 1H, 4H, Daily timeframe is used to study broader market context and support/resistance. This captures the move in the market which lasts for a few minutes to a few hours within the same trading day.
- Medium timeframes provide cleaner structures, breakout levels, and trend confirmation.
- Day traders monitor volatility around market open, news events, and session shifts.
- Stops are moderate, trades last longer than scalpers, and decisions require both speed and structure.
Ideal for day traders who prefer controlled intraday movement without holding positions overnight.
Timeframe Used by Swing Traders
Swing traders mainly use a 4-hour, and daily timeframe to capture the multiday moves, using 1-hour or 30-minute charts only to refine entries. Swing traders aim to ride the trend from several days to weak.
- Medium-to-high timeframes show strong market structure, clearer trend continuation, and higher accuracy.
- Price noise is lower, making patterns like breakouts, pullbacks, and FVGs more reliable.
- Swing traders use wider stop-losses and plan trades in advance rather than reacting instantly.
Ideal for traders with daytime jobs or those who prefer slower, more predictable market behavior.
Timeframe Used by Positional Traders
Positional traders mainly use Daily, Weekly, and Monthly timeframe to capture large trend movements and long-term cycles. Positional traders rarely use a lower timeframe because their trade lasts for the weeks to months.
- High timeframes reveal major market direction, macro structure, and long-term support–resistance.
- Signals are fewer but far more reliable, with minimal intraday noise.
- Stop-losses are wider, but targets are significantly larger, often aligning with fundamental or macro trends.
Ideal for traders who prefer patience, stability, and big-picture investing rather than short-term volatility.
These timeframes align with fundamental catalysts like earnings, interest rate cycles, macro trends, and seasonal moves.
What Timeframes are Used by Forex Traders?
Forex traders use a wide range of time frames depending on their style of trading, because the forex market is open 24hours for 5 days a week.
- Scalpers: Scalpers use 1-minute to 5-minute timeframe as forex pairs are highly liquid and volatile, this timeframe allows traders to capture micro-movements, allowing quick entries/exits.
- Day Traders: Day traders use a 15-minute, 30-minute, 1-hour time frame, as it reduces noise while still giving multiple intraday setups. This time frame works best in London and New York.
- Swing Traders: 4-hour and Daily timeframe are most popular among forex traders for showing strong, reliable trends that last several days. Forex markets often respect higher time frames due to global liquidity flow.
- Position Traders: Weekly and Monthly best for positional trades as it captures major economic cycles, interest rate trends, and currency strength shifts.
Usually in forex trading, higher timeframes like 4-hour and Daily are extremely popular for clarity, reliability, and reduced noise.
What is the Best Timeframe for Options Trading?
The timeframe for option trading depends on the strategy and style of trading, but the most common timeframe used in option trading is given below.
- Lower to medium timeframe: Timeframes such as 5-minute to 1-hour are usually used for intraday option buying because option buying always has a risk of premium decay. A lower timeframe allows traders to capture a precise entry to catch momentum needed for quick premiums gains.
- Medium to higher timeframe: 1-hour, 4-hour and Daily is well suited for option sellers as they want strong trend direction and stable zone. Higher timeframe produces more reliable signals and reduces risk of sudden spike ideal building credit spreads with better trend conviction during option trading.
What is the Best Timeframe for Technical Analysis?
The daily timeframe is considered best for technical analysis mainly because of the following four reasons.
- Each candle represents full-day sentiment = strong reliability.
- Removes market noise seen on lower timeframes.
- Patterns like breakouts, triangles, double tops/bottoms are clearer and more accurate.
- Works for all markets: stocks, forex, crypto, commodities.
Traders often do technical analysis on daily charts, refine it on 1H/4H, and enter on 15M–5M.
What is the Best Timeframe for Fundamental Analysis?
Weekly and monthly timeframes are best for fundamental analysis because fundamentals move the market slowly which is best reflected on weekly and monthly charts.
- This timeframe shows a true macro direction and removes all the short term noise.
- Helps investors decide long-term buy/hold or sector rotation strategies.
Investors combine fundamental analysis with higher timeframes to align long-term decisions with major market direction.
What Trading Timeframe is Profitable for Beginners?
The most profitable trading timeframe for beginner traders is generally a longer timeframe such as the daily or 4-hour chart. This timeframe smooths out the market noise and gives more time to traders for making thoughtful decisions, which align better with the learning process of beginner traders.
Shorter timeframes such as 1 minute and 5 minute moves too fast for beginners, causing confusion, emotional decision and overtrading. Hence, a longer timeframe provides clear trends and learning patterns for beginners.
What is the Timeframe for Advance Traders Use?
Advanced traders do not use one fixed timeframe to trade, instead they master one primary timeframe and combine it with different other timeframes to increase the accuracy and reliability. This combination of different timeframes is called multi-timeframe analysis.
Advanced traders use multi-timeframe based on their specific strategy, market conditions, and personal style. Their expertise lies in how they integrate different perspectives to gain an edge.
How to Set Up Timeframes on a Trading Chart?
There are five major steps to to set up the timeframe on a trading chart. The steps are mentioned below.
Step 1: Open Your Trading Platform
Launch your preferred desktop software or access the web-based charting platform such as strike.money, tradingview, Investopidia or charting.

Step 2: Navigate to Your Desired Asset
Select the financial instrument of your choice to analyze, such as stock, currency pair (EUR/USD), or commodity.

Step 3: Locate the Timeframe Selection Menu
Look for the toolbar usually located at the top of the charting platform interface. You should see a section which displays various time options like “D” for Daily, “W” for Weekly, “M” for Monthly, and various numbers for minute-based charts.

Step 4: Select Your Primary Timeframe
Click on the desired timeframe from the menu to apply it to the main chart display. The chart will instantly adjust to show price data aggregated over that specific period (e.g., each candle or bar on a daily chart represents one full day’s trading activity).

Step 5: Customize Your View
Most platforms, including tradingview allow you to add custom timeframes or save your preferred layout.
By following these steps, you can effectively configure your trading charts to match your specific trading strategy and analytical needs.
What is 10 AM Rule in Stock Trading?
The 10 AM Rule stock trading suggests that traders and particularly beginners should not make any major trades before or shortly after 10:00AM (Eastern Time in the U.S.). The logic behind this is that the opening 30 minutes of the market (9:30 AM to 10:00 AM ET) are generally the most unpredictable and volatile in terms of the market trading day driven by overnight news, gap openings, and institutional orders, which can create false breakouts and whipsaws for intraday traders.
By about 10 AM, volume and volatility typically normalize, and the day’s initial trend or trading range becomes easier to read, so entries taken after this time tend to be based on more stable information
What is the 4-Hour Strategy?
The 4-Hour Strategy is a trading method which uses the 4-hour time period (H4) as the main chart to identify the patterns, significant setups, and high-probability areas. It is mostly used by swing traders and intraday trend traders since it provides the clear trend identification, strong signal, higher-quality trades and flexible holding.
How do traders actually use it?
- Use H4 as a primary chart to spot the main trend, support and resistance.
- Use a lower timeframe, such as 1H or 30M to refine entries.
- Set wider stop-losses but aim for larger targets due to stronger trend continuation.
4-H provides perfect balance between accuracy and frequency, allowing traders to plan the trade without worrying about small market fluctuations.
What are Stock Market Timings & Holidays?
Stock Market Timings play a crucial role in how every timeframe behaves, because each candle forms within fixed trading hours and scheduled market holidays.
Understanding timeframes is incomplete without knowing when the market opens, closes, and pauses. To explore this connection further, the detailed breakdown continues on the dedicated page titled “Stock Market Timings.”


 Previous Article


![15 Investing.com Alternatives [Free+Paid] You Should Use in 2026](https://www.strike.money/wp-content/uploads/2026/04/Investing.com-Alternatives.jpg "15 Investing.com Alternatives [Free+Paid] You Should Use in 2026 88")
![15 TradeStation Alternatives [Free+Paid] You Should Use in 2026](https://www.strike.money/wp-content/uploads/2026/04/TradeStation-Alternatives.jpg "15 TradeStation Alternatives [Free+Paid] You Should Use in 2026 89")
![15 Chartink Alternatives [Free+Paid] You Should Use in 2026](https://www.strike.money/wp-content/uploads/2026/04/Chartlink-Alternatives.jpg "15 Chartink Alternatives [Free+Paid] You Should Use in 2026 90")


 : Definition, Formula, calculation, Uses, Advantages Vs limitations 94")


No Comments Yet.