The Chaikin Money Flow (CMF) is a technical indicator that measures the volume of money flow during a specific period. The Chaikin Money Flow indicator was developed by Marc Chaikin, and is used to identify the possible buying and selling pressure on the stock. It is a momentum indicator, which is a great help in understanding how and where the market will head in near future.A trader calculates the Chaikin Money Flow using an underst anding of the Accumulation / Distribution Line (A/D) and the CMF formula.
: Definition, How it Works, Calculations, and Trading 36")
In one of the more useful applications of Chaikin’s Accumulation/Distribution Line, it is converted to form the Chaikin Money Flow. The CMF is created by taking the difference of the A/D line (see above) and a Simple Moving Average of the A/D line. This line is then graphed with the zero line in the middle at both positive and negative values. From this new line, the CMF is used to identify potential trend reversals as well as strength of trend. A rising CMF (typically over 0.10) would indicate that the stock is increasing its buying pressure and a falling CMF (typically lower than -0.10) would indicate the stock may undergo selling pressure.
What is Chaikin Money Flow (CMF)?
The Chaikin Money Flow (CMF) is an indicator used to measure the volume of money that flows into and out of an asset. It was developed by Marc Chaikin who believes that. The 21 day represents a month of trading sessions and should be a good representation of the buying and selling pressure over the last month. One month is about as far out that traders can filter out the random noise (better known as the volatility) that short term price corrections cause in the market and distort the overall trend. The CMF indicator is less volatile and less prone to whipsaws by using a longer time frame. CMF indicators are suitable on Daily and weekly time frames.
The CMF considers both price and volume data, which helps in providing insights into the strength of an asset’s trend and potential reversals. The CMF helps generate trading signals, which are the entry and exit points for a stock during a specific period of time, using the weighted average of this data.
The CMF indicator is based on the concept of the Accumulation Distribution Line (A/D line), which calculates an asset’s total accumulation and distribution over a given period.
The CMF is commonly used to confirm a trend, measure a trend’s strength or identify potential trend reversals or breakouts.
Who invented the Chaikin Money Flow (CMF) indicator?
The Chaikin Money Flow (CMF) indicator was developed by Marc Chaikin in the 1980s. Marc Chaikin was a well-known stock market analyst and researcher. Marc Chaikin made significant contributions in the field of technical analysis and is the founder of Chaikin Analytics, which is a financial analytics firm.
The CMF was developed based on the concept of Accumulation and Distribution lines which was developed by Marc Chaikin and Larry Williams. The CMF slowly gained popularity among readers and analysts as an important tool in technical analysis. The CMF is now a commonly used indicator to make informed trading decisions.
How does the Chaikin Money Flow (CMF) indicator work in Technical Analysis?
The Chaikin Money Flow is a technical analysis indicator that is used to measure the buying and selling pressure in a stock over a period of time. The CMF indicator reveals the momentum behind a trend, that is, whether the trend will be going up or down and whether it is likely to reverse.
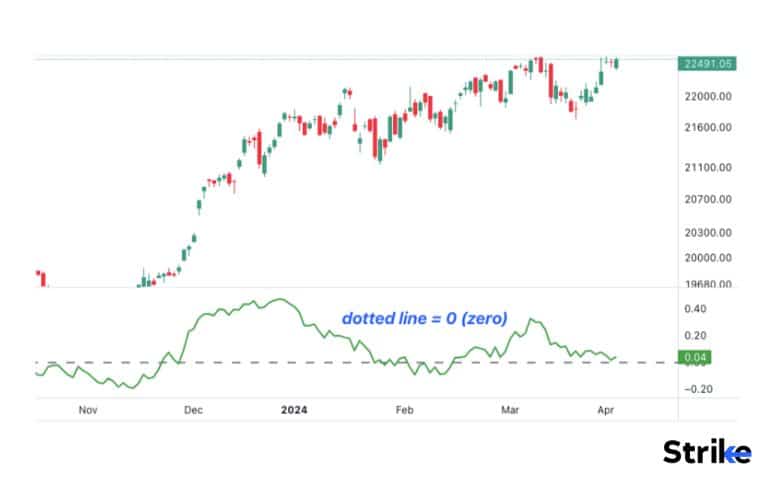
The CMF is known as an oscillator, as it is an indicator in technical analysis that floats around a range. Here is an image of the CMF on a chart.
: Definition, How it Works, Calculations, and Trading 37")
Chaikin Money Flow is displayed as a green or red oscillator around a 0-line, which ranges from +1 to -1. It rarely reaches these extreme points because it will take the script to close 21 consecutive times above the high or low for CMF to reach +1 or -1.
The CMF keeps oscillating across the zero dotted line. If the green line (CMF) oscialles above zero line, the script is in an uptrend whereas if the CMF oscillates below zero line, the script is in a down trend.
The indicator oscillates above and below the zero line with positive readings and negative readings. The positive readings indicate an upward trend, and the negative readings indicate a downward trend.
: Definition, How it Works, Calculations, and Trading 38")
An example of how CMF can assist technical analysts and traders is shown in the chart above.
The CMF indicator is based on the concept of the Accumulation Distribution Line (A/D line), which calculates an asset’s total accumulation and distribution over a given period. The CMF indicator calculates the weighted average of accumulation and distribution and plots it over a range from +1 to -1. A CMF value above 0 and between 0.10 and 0.40 indicates buying pressure, that is more accumulation, whereas a value below 0 and floating between -0.10 and -0.40 indicates selling pressure, which is more distribution.
The CMF value of 0 indicates that there is equal buying and selling pressure and that the stock is most likely floating around in a trendless state. Rarely CMF touches +1 or -1 because it would take 21 consecutive closings above high or low for CMF to touch the extreme levels.
How to identify Chaikin Money Flow (CMF) in a stock chart?
The Chaikin Money Flow (CMF) is identified depending on the position of the CMF and the zero line. The bullish and bearish divergences also help in identifying the Chaikin Money Flow (CMF). The CMF also oscillates around the 0-line, which ranges from +1 and -1.. The indicator oscillates above and below the zero line with positive readings and negative readings, which are displayed as red or green.
The positive readings indicate an upward trend, and the negative readings indicate a downward trend. The CMF above 0 indicates net buying (accumulation) pressure and the CMF below 0 indicates net selling (distribution) pressure. The CMF is also used to identify trend changes. When the CMF crosses above the 0 line, it indicates that there is net buying pressure in the market. This could be a sign that the market is about to enter a bullish trend. When the CMF crosses below the 0 line, it indicates that there is net selling pressure in the market. This could be a sign that the market is about to enter a bearish trend.
What is the Formula for Chaikin Money Flow (CMF)?
The formula for the Chaikin Money Flow (CMF) is as follows:
- CMF = (N – period sum of MFV) (N – period sum of volume ),
where MFV = Money flow multiplier volume
N is usually 20 or 21 periods, and it can be adjusted according to the preference of the trader.
How to Calculate the Chaikin Money Flow (CMF)?
The Chaikin Money Flow (CMF) can be calculated in 2 steps.
- The Accumulation or Distribution line:
The Accumulation or Distribution line measures the money flow volume for each trading period, which serves as the basis for the Chaikin Money Flow. The formula for the A/D Line is as follows:
- Money Flow Multiplier = [(Close – Low) – (High – Low)] (High – Low)
- Money Flow Volume = Money Flow Multiplier Volume
The Money Flow Multiplier ranges between -1 and 1, depending on the closing price’s position within the day’s range. The Money Flow Volume then considers both the Money Flow Multiplier and the volume traded during the period.
- Chaikin Money Flow Formula:
The Chaikin Money Flow is calculated by dividing the sum of the Accumulation or Distribution values over a chosen period, which is usually 20 or 21 days divided, by the total volume over the same period.
CMF = (Σ(AD Line) / Σ(Volume)) Period
The result is a value oscillating between -1 and 1, with positive values indicating buying pressure and negative values indicating selling pressure.
The calculation part remains a theoretical and mathematical concept as the indicator is freely available on all the charting platforms like tradingview, Strike.money.
How does the volume affect Chaikin Money Flow (CMF) calculations?
The volume is an important element in the Chaikin Money Flow (CMF). The first step in the calculation of the Chaikin Money Flow (CMF) is calculating the Accumulation or Distribution line, which measures the money flow volume. The money flow multiplier is necessary for this calculation because it determines the price range, which indicates the buying and selling pressure. The Money Flow Multiplier is then multiplied by the trading volume to calculate the Money Flow Volume. A higher Money Flow Volume indicates stronger buying pressure, while a lower Money Flow Volume indicates stronger selling pressure.
The sum of volume is later taken to calculate the final CMF. The inaccuracy of the volume will provide a wrong indication to traders and investors.
How to use Chaikin Money Flow (CMF) in Trading?
The Chaikin Money Flow (CMF) is used in trading in 3 ways.
- Trend direction: The Chaikin Money Flow (CMF) is used to determine trend direction. The zero line helps signal an upward or downward trend. An upward trend, along with the price and volume, is indicated when the CMF is above the zero line.
A downward trend, along with the price and volume, is indicated when the CMF is below the zero line. Look at an example of the same attached below, when CMF crossed 0 line towards negative trajectory, price went in a downtrend whereas when CMF readings went positive, price went in an uptrend.
: Definition, How it Works, Calculations, and Trading 39")
- Trend Strength: The Chaikin Money Flow (CMF) is used to confirm the strength of the trend. A confirmation of the buying and selling pressure is indicated when the CMF aligns with the direction of the trend. An example of how CMF can represent trend strength is attached below. As long as the CMF kept oscillating above the 0 line, the market continued the uptrend, the CMF bounced from zero line into positive trajectory and the price managed to continue the bullish trend.
: Definition, How it Works, Calculations, and Trading 40")
: Definition, How it Works, Calculations, and Trading 40")
- Entry and Exit points: The Chaikin Money Flow (CMF) is used as a tool to confirm entry and exit points. An entry in a long position is suggested when the CMF confirms a positive money flow in the uptrend, and an entry in a short position is suggested when the CMF confirms a negative money flow in the downtrend.
These are a few ways to use the Chaikin Money Flow (CMF) in trading. It is important to combine CMF with other indicators and implement a proper risk management technique before trading.
How can traders use Chaikin Money Flow (CMF) to identify trading opportunities?
Chaikin Money Flow (CMF) is used to identify trading opportunities, traders look for crossovers of the CMF with the zero line. A crossover above the zero line indicates that money is flowing into the security, which could be a sign of a bullish trend. A crossover below the zero line indicates that money is flowing out of the security, which could be a sign of a bearish trend.
- To confirm trends, traders can look for divergences between the CMF and the price of the security. A divergence occurs when the CMF moves in the opposite direction of the price. This can be a sign that the trend is weakening and could be about to reverse. A classic example of bullish divergence is attached in an example below which shows the weekly chart of Nifty50. Candlestick patterns and signals from multiple indicators could have gathered to formulate a trading plan to place long positions.
- To gauge measure market sentiment, traders can look at the CMF’s level. A high level of CMF indicates that there is a lot of money flowing into the security, which could be a sign of bullish sentiment. A low level of CMF indicates that there is not much money flowing into the security, which could be a sign of bearish sentiment.
: Definition, How it Works, Calculations, and Trading 41")
It is important to note that CMF is just one of many technical indicators that traders can use. It is important to use CMF in conjunction with other indicators and to understand the risks involved in trading.
What is the best trading strategy for Chaikin Money Flow (CMF)?
There is no best trading strategy for Chaikin Money Flow (CMF), as it depends on the specific market and the trading style of the trader. The trend confirmation strategy and divergence strategy are good strategies that incorporate CMF in conjunction with other tools.
What is the best time frame for trading Chaikin Money Flow (CMF)?
The best time frame for trading the Chaikin Money Flow (CMF) is 21 days. It is the standard CMF period. The principle behind the Chaikin Money Flow is that more accumulation will take place depending on how close the closing price is to the high.
What Indicator works well with Trading Chaikin Money Flow?
Many indicators work well with trading the Chaikin Money Flow. A few of them are Moving Averages (MA), Relative Strength Index (RSI), Moving Average Convergence Divergence (MACD), Bollinger Bands, and Volume-based indicators like Volume Weighted Average Price (VWAP). These indicators enhance the reliability of the Chaikin Money Flow (CMF).
How can Chaikin Money Flow (CMF) verify other Technical Indicators or Chart Patterns?
Chaikin Money Flow (CMF) is used to verify other technical indicators or chart patterns based on a few factors, like confirmation of trends and divergence signals. The Chaikin Money Flow is used to generate buy and sell signals for traders and investors. An upward trend is confirmed when the CMF crosses above the zero line, signaling increased buying pressure. A downward trend is confirmed when the CMF crosses below the zero line, which indicates increased selling pressure.
The divergence of signals is also an important factor. Divergence is when the price of an asset is moving in the opposite direction of a technical indicator like the Chaikin Money Flow (CMF).
: Definition, How it Works, Calculations, and Trading 42")
Chart uploaded above is 1 hour time frame chart of Nifty50. Observe how negative and positive divergences got created between price and CMF to provide back to back short and long trading opportunities. Confirmation from other indicators are supposed to be taken before executing trade setup.
The divergence between the price and the CMF also provides valuable trading signals and chart patterns. A potential trend reversal and weakening buying pressure are indicated when the price reaches a new high but the CMF does not reach it, forming specific chart patterns. A diminishing selling pressure and a possible trend reversal are indicated when the price reaches a new low while the CMF does not confirm the new low.
Is Chaikin Money Flow (CMF) Accurate?
No, the Chaikin Money Flow (CMF) is not 100% accurate. No indicator or tool is accurate enough to predict future market sentiment, thus traders should look at precision of indicators. The Chaikin Money Flow relies on volume data, which is not accurate in smaller, regulated markets. Traders should have access to reliable data, as it produces false trading signals.
Is Chaikin Money Flow (CMF) reliable?
No, the Chaikin Money Flow (CMF) is not reliable as a standalone indicator. The Chaikin Money Flow has to be used in conjunction with other indicators, tools, and analysis techniques. Indicators like the Moving Average (MA), Relative Strength Index (RSI), and Bollinger Bands have to be used by traders to rely on the Chaikin Money Flow (CMF).
Do Traders commonly use Chaikin Money Flow (CMF)?
Yes, the Chaikin Money Flow (CMF) indicator is commonly used by traders in technical analysis. The Chaikin Money Flow (CMF) is a common tool used to confirm the strength of trends and provide valuable insights to traders, which helps them formulate a proper trading strategy.
What are the advantages of Chaikin Money Flow (CMF)?
These are the four advantages of the Chaikin Money Flow (CMF).
- Confirmation of the direction of a trend: The Chaikin Money Flow (CMF) helps traders confirm the direction and strength of a trend. The alignment of the Chaikin Money Flow with the direction of the price trend helps the traders analyze the buying and selling pressure.
- Exit signals: The Chaikin Money Flow provides possible exit signals when there is potential for a trend reversal. The divergence between the price and the Chaikin Money Flow (CMF) signals a warning sign of a potential trend reversal. Traders use this information to exit their positions.
- Flow of Money: The Chaikin Money Flow (CMF) is a technical indicator that measures the volume of money flow during a specific period. This provides valuable insights and provides data to analyze the flow of money into and out of a security.
- Application: The Chaikin Money Flow (CMF) is applicable for different markets, such as stocks, forex, and cryptocurrencies. It is used for trading instruments and different time frames, depending on the trader’s strategy .
These are the advantages of the Chaikin Money Flow (CMF), which is used by traders and investors to develop a successful trading strategy and make informed trading decisions. Traders use the advantages to find the optimal setting that aligns with their trading strategy and risk tolerance.
What are the disadvantages of Chaikin Money Flow (CMF)?
These are the five disadvantages of Chaikin Money Flow (CMF).
- Lagging indicator: The Chaikin Money Flow (CMF) is considered a lagging indicator that trails the price. The Chaikin Money Flow relies on historical data, which lags the whole process and does not provide timely signals.
- False Signals: The Chaikin Money Flow produces false signals during range-bound market conditions like high volatility or in illiquid markets. The values fluctuate around the zero line.
- Time period: The calculation of Chaikin Money Flow will have a significant impact depending on the choice of the period. A shorter period will lead to more frequent signals but with an increased risk of false signals, and a longer period will provide more reliable signals but may be slower to react to changes in market conditions.
- Standalone indicator: The Chaikin Money Flow cannot be used as a standalone indicator. The Chaikin Money Flow has to be used in conjunction with other indicators, tools, and analysis techniques. Risk management principles and other market news are also important.
These are the disadvantages, and it is important that traders and investors use the Chaikin Money Flow (CMF) and other technical analysis tools and indicators to confirm signals and minimize the risk of poor trading decisions. Traders must also find the optimal setting that aligns with their trading strategy and risk tolerance.
What is the difference between the Chaikin Money Flow (CMF) and the Money Flow Index?
There are 5 main differences between the Chaikin Money flow (CMF) and the Money flow index (MFI).
| Chaikin Money Flow (CMF) | Money Flow Index (MFI) |
The Chaikin Money Flow Oscillator is similar to Moving Average Convergence Divergence (MACD) because it uses Exponential weighted moving averages (EMAs) to analyse momentum. | 1) The Money Flow Index is similar to a volume weight Relative Strength Index (RSI), which is based on price gains and losses over a period of time. |
The Chaikin Money Flow oscillates between -1 and +1. These ranges indicate accumulation (buying pressure) and distribution (selling pressure). | 2) The Money Flow Index ranges between 0 and 100. These ranges indicate an overbought or oversold condition. |
The Chaikin Money Flow is used as a short or medium-term indicator calculated over 20 or 21 days. | 3) The Money flow index is used as a short-term indicator calculated over 14 days. |
The Chaikin Money Flow gives more importance to the relationship between price and volume. | 4) The Money flow index gives more importance to the price and money relationship. |
The Chaikin Money Flow is used to identify potential trend reversals or confirm the strength of an existing trend. | 5) The Money flow index is used to identify a possible price reversal or correction and indicates a potential buying opportunity. |
The Chaikin Money Flow (CMF) and Money Flow Index (MFI) are used to analyse the flow of money. Traders and analysts choose between the two indicators depending on their trading styles and strategies.


 Previous Article


![15 Investing.com Alternatives [Free+Paid] You Should Use in 2026](https://www.strike.money/wp-content/uploads/2026/04/Investing.com-Alternatives.jpg "15 Investing.com Alternatives [Free+Paid] You Should Use in 2026 46")
![15 TradeStation Alternatives [Free+Paid] You Should Use in 2026](https://www.strike.money/wp-content/uploads/2026/04/TradeStation-Alternatives.jpg "15 TradeStation Alternatives [Free+Paid] You Should Use in 2026 47")
![15 Chartink Alternatives [Free+Paid] You Should Use in 2026](https://www.strike.money/wp-content/uploads/2026/04/Chartlink-Alternatives.jpg "15 Chartink Alternatives [Free+Paid] You Should Use in 2026 48")
: Overview, 10 Types of Indicators, Settings for Different Markets 50")

 : Definition, Formula, calculation, Uses, Advantages Vs limitations 52")


: How We Used This 70/30 Indicator in 6 High Win-rate Strategies 55")


No Comments Yet.