Open Interest (OI) is one of the most critical indicators for options and futures traders because it reveals the total number of outstanding contracts that remain active in the market. Open interest helps traders understand the depth of participation and the strength behind market moves.
Traders often combine open interest with price and volume to get a three-dimensional view of the market. Price shows direction, volume shows intensity, and open interest shows conviction. Together, these three elements help traders differentiate between false moves and real trends.
What Is Open Interest?
Open Interest is the total number of outstanding derivative contracts that remain unsettled in the market at a given time. Open interest includes all positions that are open but not squared off, expired, or exercised.
For every open contract, there are two parties: one long and one short. If you buy a NIFTY 25,000 Call option and someone else sells it to you, open interest increases by one contract. That contract remains part of open interest until either you sell it back or your counterparty closes their position. Once both sides square off, OI decreases.
Unlike volume, which resets daily, open interest is cumulative. For instance, if 100 contracts are created on Monday, OI is 100. If on Tuesday another 50 contracts are created, OI becomes 150. If on Wednesday 70 contracts are closed, OI falls back to 80. This running tally gives traders an idea of how many contracts remain in play and how much liquidity is available in that strike or contract.
Traders watch open interest closely because it signals market commitment. A high OI suggests that many traders are interested in that strike, making it liquid and reliable for entry or exit. Low OI means limited participation, which increases slippage and execution risk.
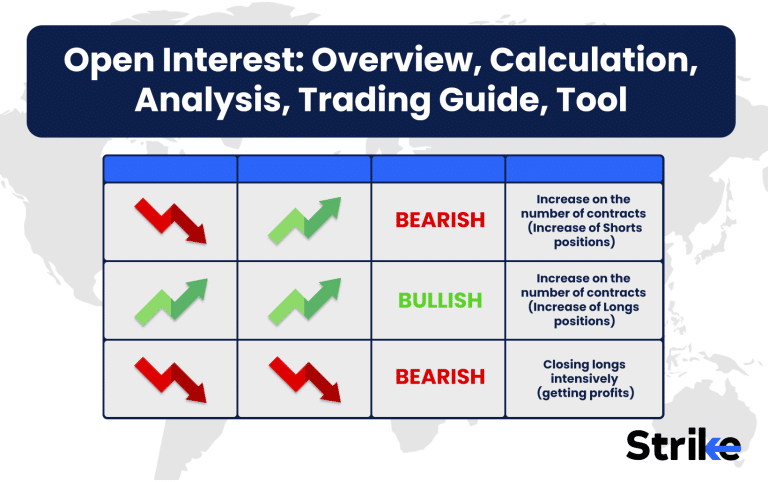
In practical terms, OI helps traders differentiate between short covering, fresh long buildup, long unwinding, and fresh short buildup. For example
- Price ↑ + OI ↑ → Long buildup (bullish)
- Price ↓ + OI ↑ → Short buildup (bearish)
- Price ↑ + OI ↓ → Short covering (temporary bullish)
- Price ↓ + OI ↓ → Long unwinding (temporary bearish)
This framework makes open interest one of the most versatile tools in derivative analysis.
How is Open Interest Calculated?
Open Interest is calculated by taking the total number of contracts opened and subtracting the total number of contracts closed. The formula is:
OI = Total New Contracts Opened – Total Contracts Closed
Let’s illustrate this with a simple example.
- Suppose Trader A buys 1 lot of NIFTY Futures from Trader B. This creates a new contract because both are entering fresh positions. Open interest increases by 1.
- If Trader C sells 1 lot of the same contract to Trader D, again both are opening new positions. OI increases by another 1. Now total OI is 2.
- Later, if Trader A sells his lot to Trader E, and Trader E is opening a fresh position while A is closing, OI remains unchanged at 2.
- If Trader B also closes his short position by buying from someone who is closing, OI decreases by 1.
So, OI changes only when both sides open or both sides close simultaneously. If one opens and the other closes, the net impact on OI is zero.
Example in Options

Imagine 500 contracts of NIFTY 25,500 Calls are traded in a day. Of these:
- 300 are new contracts opened by fresh buyers and sellers.
- 200 are just traders closing out their earlier positions.
In this case, OI increases by 300 and decreases by 200, giving a net OI increase of 100 contracts.
Futures Example

On Day 1, OI in Reliance Futures = 1,000.
On Day 2, 300 new contracts are opened, and 100 are closed.
New OI = 1,000 + 300 – 100 = 1,200.
This systematic method makes OI a reliable statistic, unlike raw volume, which can exaggerate activity without showing real positioning.
How Open Interest Works
Open Interest works as a live counter of trader positions that shows whether new money is entering the market or existing positions are being exited. It reflects both liquidity and conviction behind a trend.
There are four primary scenarios.
- Price ↑ and OI ↑ = Long Buildup
New buyers are entering, pushing prices higher. Strong bullish sign. - Price ↓ and OI ↑ = Short Buildup
New sellers are entering, pushing prices down. Strong bearish sign. - Price ↑ and OI ↓ = Short Covering
Shorts are closing positions, which pushes prices up temporarily. Less sustainable. - Price ↓ and OI ↓ = Long Unwinding
Longs are closing positions, leading to price decline. Again, less sustainable.
For example, during the Union Budget week, OI in BANKNIFTY options often rises sharply as traders take positions on both sides. If BANKNIFTY rallies and OI also climbs, it means bulls are adding positions and the rally has strength. But if OI falls during the rally, it’s more about short sellers covering, which is not as reliable.
Why Open Interest Matters
Open Interest matters because it shows how much conviction and liquidity exists behind market trends. Price alone gives direction, but OI tells you if the trend is sustainable.
Another key reason why OI matters is in expiry trading and max pain analysis. High OI strikes often act as natural barriers. If the highest OI Call strike is at 25,500, it signals resistance, while the highest OI Put strike at 25,000 signals support. Option writers defend these levels because they benefit from expiry within this range. Traders use this information to predict expiry levels, also called “pinning.”
How to Read Open Interest Trends
Open Interest trends are read by comparing changes in OI with changes in price. This helps traders identify whether the market is building fresh positions or unwinding old ones.
The four main combinations are
- Price ↑ + OI ↑ = Long buildup → bullish, new longs entering.
- Price ↓ + OI ↑ = Short buildup → bearish, new shorts entering.
- Price ↑ + OI ↓ = Short covering → bullish but temporary.
- Price ↓ + OI ↓ = Long unwinding → bearish but temporary.
Daily OI trend charts help in identifying whether participation is strengthening or weakening. A simple rule is: rising price with rising OI confirms trend continuation, while diverging signals warn of reversals.
Thus, reading OI trends is about aligning price direction with trader commitment. Price tells you where the market is moving, while OI tells you whether traders believe in it enough to commit capital.
How to Analyze Open Interest for Support and Resistance Levels
Open Interest helps identify support and resistance because large OI clusters act like barriers. Traders defend these levels since they represent zones of heavy exposure.
For example, suppose NIFTY has maximum Put OI at 25,000 and maximum Call OI at 25,500. This means traders expect expiry between these levels. As long as NIFTY stays within this range, option writers profit, so they aggressively defend it. That’s why prices often bounce from high Put OI levels (support) and get rejected near high Call OI levels (resistance).

To analyze OI for support and resistance
- Look at the option chain to identify strikes with the highest OI.
- Track changes in OI during the day. Rising Put OI at 25,000 means stronger support, while falling Put OI means weakening support.
- Use OI heatmaps to visualize where large positions are concentrated.
- Check if OI buildup is shifting up or down with price. If Call OI moves higher along with price, it signals bullish momentum.
Thus, OI clusters are like invisible walls in the market. They represent where traders have maximum exposure and will defend or unwind based on price movement.
How to Trade Using Open Interest
Traders use Open Interest to confirm market direction, manage risk, and design option strategies. It works best when combined with price and volume.
Some practical strategies
- Breakout Confirmation → If price breaks resistance with rising OI, it confirms fresh long buildup. Traders enter confidently. If breakout happens with falling OI, it’s likely false.
- Trend Continuation → When price is rising and OI keeps climbing, it shows bulls are adding positions. Swing traders hold longs.
- Short Covering Rallies → If price rises but OI falls, traders book profits quickly because the rally is temporary.
- Iron Condor Adjustments → Traders use OI to identify high Call and Put OI levels as expiry barriers. They structure iron condors around these zones and adjust when OI shifts.
- Position Sizing → Traders take larger positions when OI is high because liquidity is strong. In low OI strikes, they reduce size to avoid slippage.
OI trading is not about prediction but about confirmation. It helps traders filter out weak moves and focus on setups where money flow supports price action.
Which Tools to Track Open Interest
Traders track Open Interest using option chain platforms, broker terminals, and analytics software like Strike Money. NSE provides daily OI data, but traders prefer real-time tools for accuracy.
- Strike : Specialized platform for derivatives analytics. Provides OI charts, heatmaps, and event-based signals.
- NSE Option Chain: Free, shows OI by strike, updated during the trading day.
- Sensibull / Opstra: Widely used by retail traders. Provide OI visualization, strategy building, and payoff charts.
- Broker Terminals: Platforms like Zerodha Kite, Fyers, and ICICI Direct provide integrated OI with charts.
- Institutional Terminals (Bloomberg/Reuters): Provide global OI and derivatives analytics across asset classes.
Heatmaps and change-in-OI graphs are particularly powerful. They show where OI is building or unwinding intraday. Professional traders rely on these tools to track shifting support and resistance zones.
How Often is Open Interest Updated?
Open Interest is updated daily by exchanges, with intraday updates available on trading platforms. NSE and BSE publish OI data at the end of the day for all futures and options contracts. However, brokers and analytics tools provide near real-time updates with only a few minutes of delay.
For example, if you check the NSE option chain during market hours, you will see intraday changes in OI for each strike. This allows traders to track fresh buildups or unwinding during the day. Retail-friendly platforms like Sensibull or Opstra provide continuous refreshes so traders don’t need to wait until market close.
The frequency of updates matters because OI is most useful when analyzed in real time. Suppose BANKNIFTY breaks above 52,000. If OI in Calls at 52,500 starts falling and Put OI rises sharply, it signals traders are repositioning bullish intraday. Without real-time updates, traders would miss this early clue.
Institutional desks often use Bloomberg or Reuters terminals for live OI monitoring across multiple exchanges globally. Retail traders rely on broker terminals like Zerodha Kite, Angel One, or Upstox, which pull exchange data every few minutes.
Thus, while OI is officially end-of-day, traders access it intraday through analytics platforms. The timeliness of OI data defines whether it is useful for scalping or only for swing/positional analysis.
How to Identify “Smart Money” Activity using Open Interest?
Smart money activity in OI is identified by sudden large changes in positions at specific strikes. Institutions often take positions quietly, but their footprints are visible in OI.
Traders combine OI with volume, delta, and volatility shifts to confirm smart money. Key signals include:
- Sudden OI jumps at strikes away from ATM (anticipating big moves).
- Unusual OI + IV spikes before events like RBI policy or earnings.
- Put-Call Ratio (PCR) distortions, where institutions load one side.
- Unwinding at critical levels, showing that institutions are defending or abandoning zones.
Thus, smart money reveals itself in OI because large players cannot hide their exposure. By watching these patterns, retail traders align themselves with institutional flows rather than fight against them.
Is Open Interest Bullish or Bearish?
Open Interest itself is neither bullish nor bearish—it depends on the context with price. OI shows positioning, but the direction depends on whether longs or shorts dominate.
The four key scenarios are
- Rising Price + Rising OI = Bullish (long buildup).
- Falling Price + Rising OI = Bearish (short buildup).
- Rising Price + Falling OI = Bullish but weak (short covering).
- Falling Price + Falling OI = Bearish but weak (long unwinding).
Retail traders often misinterpret OI as automatically bullish when it rises. The truth is OI only means more contracts are open. It could be longs or shorts. Only when combined with price does the signal become clear.
What is High Open Interest?
High Open Interest means many traders hold positions at a strike or contract. It signals liquidity, strong participation, and the presence of institutional traders.
High OI also provides better execution. Tight bid-ask spreads allow traders to enter and exit without much slippage. This is why professional traders prefer strikes with consistently high OI rather than thinly traded contracts.
Thus, high OI = strong liquidity + institutional participation + reliable technical zones.
What is Low Open Interest?
Low Open Interest means very few traders are participating in that contract. It reflects poor liquidity and low conviction.
For example, deep OTM strikes often have very low OI. If NIFTY is at 25,000, a 27,000 Call expiring this week might have negligible OI. This shows traders don’t expect that level to come into play.
Low OI strikes have wide bid-ask spreads, making them risky. A trader might buy a contract at ₹5 but find no exit, or get forced to sell at ₹2. This slippage eats into profits.
Institutional traders avoid low OI contracts because they cannot enter or exit large positions without moving the price. Retail traders also should avoid them unless they are purely speculative lottery trades.
Thus, low OI = low conviction + poor liquidity + high execution risk.
Why Does Open Interest Go Up?
Open Interest goes up when new positions are created. If both a buyer and seller open fresh contracts, OI increases.
This usually happens when fresh money flows into the market. For instance, before earnings season, traders open new option positions anticipating volatility. Similarly, in trending markets, fresh long or short buildups add to OI.
An increase in OI with rising price shows bullish enthusiasm. An increase with falling price shows bearish conviction. Both cases reflect fresh capital entering, strengthening the trend.
Thus, OI goes up because traders are opening new contracts, either for speculation or hedging.
Is Open Interest a Leading or Lagging Indicator?
Open Interest is usually a lagging indicator, but sometimes it gives early warnings. Since OI reflects already created positions, it mostly confirms existing trends.
For example, rising price with rising OI confirms a bullish trend. But OI can also act as an early signal when it diverges from price. If price rises but OI keeps falling, it means shorts are covering, not fresh buying. This often warns that the rally is weak and may reverse.
Institutional traders use OI divergence as a contrarian signal, often comparing it to other Leading or Lagging Indicators to gauge market sentiment. If price breaks support but Put OI does not reduce, it suggests traders still believe in the level—a insight that is often more timely than traditional Leading or Lagging Indicators—and indicates that price could bounce back.
What’s the Difference Between Open Interest & Volume
Volume measures daily trading activity, while Open Interest measures outstanding positions. Both are important but serve different purposes.
- Volume = contracts traded intraday. Even if a contract is bought and sold 10 times, volume is 10.
- Open Interest = net contracts open at the end of the day. If those 10 trades were between the same two parties, OI may remain 1.
For example, NIFTY 25,000 Call might see a volume of 5 lakh in a day but OI increase of only 50,000. This shows most activity was intra-day, not new positions.
Traders use volume to measure activity spikes and OI to measure conviction. If both rise together, it signals strong participation and trend continuation. If volume rises but OI doesn’t, it’s mostly intraday noise.
Thus, volume is about flow, while OI is about stock of positions.


 Previous Article


![15 Investing.com Alternatives [Free+Paid] You Should Use in 2026](https://www.strike.money/wp-content/uploads/2026/04/Investing.com-Alternatives.jpg "15 Investing.com Alternatives [Free+Paid] You Should Use in 2026 16")
![15 TradeStation Alternatives [Free+Paid] You Should Use in 2026](https://www.strike.money/wp-content/uploads/2026/04/TradeStation-Alternatives.jpg "15 TradeStation Alternatives [Free+Paid] You Should Use in 2026 17")
![15 Chartink Alternatives [Free+Paid] You Should Use in 2026](https://www.strike.money/wp-content/uploads/2026/04/Chartlink-Alternatives.jpg "15 Chartink Alternatives [Free+Paid] You Should Use in 2026 18")
: Overview, 10 Types of Indicators, Settings for Different Markets 20")

 : Definition, Formula, calculation, Uses, Advantages Vs limitations 22")


: How We Used This 70/30 Indicator in 6 High Win-rate Strategies 26")


No Comments Yet.