A triple bottom is a chart pattern used for technical analysis, which shows the buyers are taking control of the price action from the sellers. The triple bottom chart pattern is formed after a prolonged downtrend where bears are in control of the market. The triple bottom chart pattern consists of three equal consecutive lows, followed by a price breakout.
The first bottom is formed just because of the regular market action, the second bottom is a sign that the bulls are accumulating strength and getting ready for a potential reversal. The third bottom shows that there is solid support in place. The bears are going to give up, when the price breaks through resistance levels.
The formation of a Triple Bottom Pattern is seen as an opportunity by traders to enter a bullish position. The triple bottom pattern indicates a shift in market sentiment from selling to buying. It implies that a certain price level has been reached where the stock or asset has found support, and buyers are starting to act more actively. The third dip underlines the strength of the support level, whereas the first two troughs show attempts to break below the support level that failed.
The fact that it pinpoints a big support level where there has traditionally been heavy buying pressure makes it a desirable entry point signal for traders. The risks associated with this pattern include false signals and price volatility which is eliminated by using other confirmatory signals before making trading decisions.
What is the Triple Bottom Pattern?
The Triple Bottom Pattern is a bullish reversal pattern that is formed after a bearish trend. The Triple Bottom Pattern indicates a potential change in the market sentiment after the sellers failed to break the support in three continuous attempts.
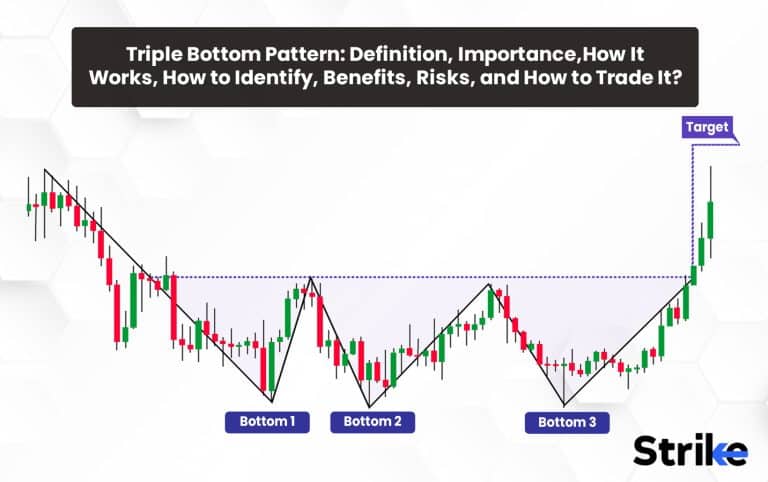
The triple bottom, as its name implies, is made up of three successive lows that are formed at almost the same level separated by two minor peaks or rallies. Analysts and traders have long studied and researched the Triple Bottom Pattern. It has grown in popularity as a result of its effectiveness in predicting trend reversals and offering traders advantageous entry points for capitalizing on bullish price movements.

The price initially dips to a low point in this pattern before rebounding. It then gradually starts to drop once more to approximately the same level. The price recovers again before falling to the same or a very similar low level a third time, after the second dip. The price chart shows a pattern that resembles three bottoms as a result of the lows occurring repeatedly.
The triple bottom pattern is seen by traders as a signal that the asset’s price has reached a strong support level. Three lows at the same price point indicate that purchasing pressure is greater than selling pressure, which ultimately results in a bullish reversal. This pattern is frequently used by traders to spot prospective buying opportunities or to confirm a change in the sentiment of the market.
The triple bottom is a widely used pattern in technical analysis for mainly three types of financial markets including equities, commodities, and currencies.
How Does the Triple Bottom Pattern Work?
The triple bottom pattern works on the principles of support and resistance levels in technical analysis. It develops when a support level is reached three times by the price without a major decline below it. Buyers enter the market, raising the low when the price reaches this point. This steady support at the same level over time points to rising demand and a waning bearish attitude. The pattern is confirmed, when the price rises above the resistance level created by the small peaks between the lows, signaling a potential trend reversal. Buyers demonstrate sufficient strength to get past earlier resistance and this ultimately raises the price, with this breakout.
Traders frequently look for higher trading activity as the pattern’s lows emerge and a spike in volume as it breaks out for extra confirmation. The triple bottom pattern allows traders the chance to establish long positions as they expect an upward price movement and serves as a visual indication of a change in market sentiment from negative to positive. The traders are able to take advantage of the subsequent bullish price action, by visualizing and understanding the simple working of the Triple Bottom Pattern.
How Importance is Triple Bottom for Technical Analysis?
The Triple Bottom Pattern is highly vital for the process of technical analysis as it helps in determining the sentiments of the market by simply examining the position of consecutive highs and lows. The triple bottom pattern holds significant importance in technical analysis because of the below mentioned three reasons.
Trend reversal signal. It is known that the triple bottom pattern is a sign that the trend is about to change from being bearish to bullish. It implies that the prior downward trend is weakening and that buyers are taking control, possibly resulting in an upward price movement. Traders and analysts pay particular attention to this pattern, as it offers important insights into future market behavior.
Identification of a strong support level. The triple bottom pattern aids in the identification of a strong support level. The price often reaches this level before reversing course, indicating that there is strong demand for the asset at that price. Traders use this support level as a guide to enter long positions.
Psychological impact. Participants in the market generally experience psychological effects from the triple bottom pattern. Traders who missed the initial bounces get interested in buying the asset as the price gets closer to the third bottom out of concern that they miss out on a huge reversal. This infusion of new purchasers helps to keep the upward trend going, once the pattern is confirmed.
The Triple Bottom Pattern is widely used for technical analysis because of the above-mentioned reasons. Technical analysis is a wider field and using Triple Bottom is just a part of it. Traders similarly also use other patterns to make effective trading strategies.
How Can You Identify a Triple Bottom Pattern on a Chart?
The identification of a Triple Bottom Pattern on a chart requires a basic understanding of specific characteristics and price movements. The six-step guide on how to identify the Triple Bottom Pattern is mentioned below.
Three distinct lows should be observed. Traders should look for three key low points that are almost at the same level on the price chart. A horizontal or almost horizontal support line is formed by these consecutive lows.
Find minor peaks. There should be two small peaks or rallies between the three lows. These peaks represent transient amounts of resistance.
Volume should be observed. Keep an eye on the volume as the pattern takes shape. The first and third troughs typically see more trading volume, which suggests possible buying pressure.
Draw trendlines. Join the highs (minor rallies) and lows (trendlines) together. This validates the pattern’s structure and makes it easier to visualize and trade.
Wait for a breakout. Wait for the price to cross above the resistance level created by the smaller peaks to confirm the breakout. The triple bottom pattern is validated by this breakthrough.
Analyze volume at breakout. Make sure that the breakout is accompanied by a considerable rise in trading volume by analyzing the volume during the breakout. A stronger breakout and more volume enhance the reliability of the pattern.
The identification of the triple bottom, like all the other technical analysis patterns, requires the skills and expertise of the trader. It’s the trader’s expertise and discretion that plays a major role in the effective utilization of this pattern. Regular Practice, observation, and consistent learning are vital for improving pattern recognition skills.
What are the Parts of the Triple Bottom Pattern?
The triple bottom pattern consists of easy to observe parts that are used for spotting the pattern by the traders on a price chart. The four major parts of the Triple Bottom Pattern are listed below.
Troughs or Lows. Three distinct troughs or lows are present at the start of the pattern. These price lows signify the points at which the asset has bottomed out and started to rise again. The three lows in a triple bottom pattern should form a horizontal or nearly horizontal support line.
Peaks or Rallies. There are two minor peaks or rallies in between the lows in the chart pattern. These peaks illustrate transient resistance levels where the price was under pressure to rise but were unable to do so. The triple bottom pattern’s distinctive “bottom, peak, bottom, peak, bottom” structure is made up of these peaks that separate the lows.
Support Level. The triple bottom pattern’s three low points form a sturdy support level. This level serves as a price floor, as a result of its historical significance in restraining additional price decreases. A trend reversal occurs as a result of the repeated bounces off this support level, which indicate that buying pressure is greater than selling pressure.
Breakout. The triple bottom pattern’s breakout is a key component. It happens when the price rises above the resistance level created by smaller peaks or rallies. The breakout validates the pattern and denotes the possibility of a change in market attitude. Traders frequently look for greater volume during the breakout, to confirm the legitimacy of the pattern.
Traders recognise and understand the triple bottom pattern by using these above mentioned physical components of the pattern as visual clues on the price chart. Traders obtain insight into probable trend reversals and make wise trading decisions by comprehending the pattern’s elements.
What are the Potential Benefits of the Triple Bottom Pattern Used as a Trading Decision?
The triple bottom pattern, when used as a trading decision tool, offers four potential benefits to traders as listed below.
Visual Clarity: The triple bottom pattern is a visually identifiable and recognizable pattern for traders due to its unique construction and structure. This clarity makes identification simpler and less subjective when identifying patterns. Traders quickly identify the pattern on price charts, facilitating quick decisions and prospective trading opportunities.
Clear Price Levels: Traders use the triple bottom pattern’s clear price levels for a variety of objectives. The support level created by the triple bottom pattern is used as a benchmark for determining risk-reward ratios, profit targets, and potential resistance levels. These prices improve the accuracy and potency of trading techniques.
Versatility across Timeframes: The triple bottom pattern is seen in a variety of timeframes, from short-term to long-term charts. Traders use this pattern in day trading, swing trading, and position trading, among other types of trading, due to its adaptability. It allows for adaptability to various market circumstances and time frames.
Risk management: Traders set stop-loss orders with clarity using the triple bottom pattern as a guide. Setting a stop-loss below the pattern’s lowest point helps to minimize potential losses, in an event where the pattern fails or market conditions change. The trader’s capacity to manage their total portfolio and safeguard their capital is improved by this component of risk management.
It is crucial to keep in mind that traders should exercise caution and take other aspects like market conditions, fundamental analysis, and personal experience for making trading decisions, even if the triple bottom pattern is advantageous.
What are the Risks of the Triple Bottom Pattern Used as a Trading Decision?
The Triple bottom pattern is a valuable tool for traders, but it also carries certain risks that should be considered when using it as a trading decision. The three major risks associated with the Triple Bottom Pattern used as a trading decision are listed below.
False Signals: The triple bottom pattern does not always give accurate results, just like any other technical analysis pattern. False signals are always a possibility, where the pattern does not result in the anticipated trend reversal. Trading decisions based only on the pattern’s existence result in losses since market conditions, unexpected news events, or other factors could render it incorrect.
Price Breakdown Risk: There is a chance that the price will decline further and breach the support level, despite the triple bottom pattern’s potential for an upward trend reversal. Traders should have adequate risk management strategies in place, such as stop-loss orders, to reduce possible losses in case the pattern fails.
Time and patience: Time and patience are key factors in the triple bottom pattern’s formation and confirmation. Traders must be patient and wait for the pattern to finish developing, before making a trade. Missed trade chances or protracted periods of inactivity are the outcome of this. The pattern needs to be checked on a regular basis to make sure it’s still viable, which takes traders’ time and focus.
These above-mentioned risks are mitigated through practice, experience, and a disciplined approach to trading. Traders become more adept at identifying and interpreting the triple bottom pattern, by honing their skills and gaining experience in technical analysis.
How To Trade the Triple Bottom Pattern?
A triple bottom has three swing lows at the same support level, swing highs in between, and declining volume with each test of support. The pattern completes when price breaks resistance decisively on expanding volume.
To trade, go long on the breakout with a stop under the lows. Conservative traders may wait for a pullback before entering. Set a target at the pattern height added to the breakout price. Manage the trade with stops, partial profit taking and trailing stops.
Look for momentum oscillator confirmation and expanding volume on rallies. Failed breakouts quickly reverse back into the pattern – exit long positions if this happens as buyers failed to take control.
The triple bottom signals potential trend reversals after prolonged declines. With sound risk management, traders use this pattern to profit from upside breakouts and rebounds in oversold markets. Mind failure rates and employ prudent strategy.
How Does Triple Bottom Pattern Indicate a Trend Reversal?
The triple bottom pattern indicates a potential trend reversal because it shows the balance of power shifting from sellers to buyers. As the price tests support three times with declining volume, selling pressure is waning. The swing highs in between also indicate buying interrupting the downtrend. When the price then breaks out above resistance decisively on heavy volume, it signals buyers have overwhelmed sellers and a reversal may occur.
The pattern reflects the bearish sentiment that was driving the prior downtrend being overtaken by renewed bullishness. It marks a level where bears could not push the price lower and increasingly aggressive buyers took control. The series of three failed support breaks with declining energy points to bears losing control to bulls. The upside resistance breakout confirms the handover from selling pressure to buying pressure. This price action and volume behavior indicates an oversold bounce and reversal may be unfolding. Traders use the triple bottom to capitalize on this sentiment shift from bearish to bullish.
When to Place a Stop Loss for Triple Bottom Pattern?
A crucial risk-management strategy while trading the triple bottom pattern is putting in a stop-loss order. It helps to reduce possible losses, in the event that the pattern fails or the market conditions alter. The placement of the stop-loss order for a triple bottom pattern changes, depending on the trader’s risk tolerance, the time frame, and the particulars of the pattern. The top three approaches for placing a stop loss for Triple Bottom Pattern are mentioned below:
Below the Lowest Low: A typical strategy is to position the stop-loss order just below the triple bottom pattern’s lowest low. It indicates that the pattern has failed and the negative trends continue if the price breaks below this level. This level serves as a crucial support zone. Setting the stop-loss below this point helps safeguard financial assets in the event of a breakdown.
Support Confirmation: Traders mostly decide to set the stop-loss order just below the pattern’s support level as an alternative. This provides a cushion to take into account potential price changes or fictitious breakouts. Traders hold their positions with a tighter stop-loss placement by confirming that the price remains above the support level.
Time-Based Adjustments: Traders who choose a more flexible strategy think about changing the stop-loss order in response to changes in time or price.
The placing of stop loss should take into consideration market aspects like the trader’s risk tolerance, the state of the market, and the particulars of the triple bottom pattern being traded.
Does Triple Bottom Indicate an Opportunity to Enter a Bullish Position?
Yes, the Triple Bottom indicates an opportunity to enter a bullish position. A probable trend reversal from selling (bearish) to buying (bullish) is indicated by the pattern, which also shows that purchasing pressure is greater than selling pressure. The triple bottom pattern is frequently seen by traders as evidence that a bottom has been reached and that the price will likely rise upward.
A breakout above the smaller peaks between the lows, which confirms the triple bottom pattern, acts as a signal to start a bullish position. Traders open long positions in anticipation of the price continuing to rise following the breakout.
Is Triple Bottom Generally Seen as Three Equally Lowes Bounces Off Support?
Yes, The triple bottom pattern is generally characterized by three relatively equal lows that bounce off a support level. The word “equally” usually suggests symmetry but in reality the three lows are not needed to have the same price or length. The main emphasis is on the overall pattern formation, instead of perfect equality.
Each low in a triple bottom pattern denotes a test of the support level when buying interest subdues selling pressure. The fact that the three lows generally occur at the same price level suggests a solid support zone where buyers are routinely intervening to halt further declines.
Traders evaluate the triple bottom pattern, based on the overall composition and the behavior of buyers and sellers at each low. The repeated bounces off the support level, which signify the fatigue of selling pressure and the appearance of buying interest, are what give this pattern its significance.
Are There Any Real-World Examples of Successful Triple Bottom Pattern Trades?
We observe the USD/JPY currency pair is going through a lower trend, on a daily chart. The bears make three unsuccessful efforts to breach below a horizontal support level near the $108.50 level. At least eight occasions of the price interacting with that level are seen on the chart, indicating that there have been more than just three touches of the $108.50 handle.

The three lowest prints or lows on the chart, which are located around the $108.50 level, are highlighted in this case because they show situations where the bears tried to break below the support but were unable to continue applying pressure to the price lower. These lows imply that buying activity increased each time the price approached that point, potentially signaling a change in market sentiment.
A breakout above the minor peaks between the lows, which confirms the reversal and presents a potential buying opportunity. It is watched by traders looking at this chart, who will read the three highlighted lows as potential indicators of a triple bottom pattern.
Can I Combine the Triple Bottom Pattern with Other Technical Chart Patterns?
Yes, we can combine the triple bottom pattern with other technical chart patterns. This practice gives a more comprehensive and robust trading approach. Trading decisions are further supported and the likelihood of profitable transactions is increased by including supporting patterns. It enhances its ability to identify high-probability trade setups and increases the overall efficiency of the trading approach.
The triple bottom pattern and breakout tactics, for example, are both used by traders. Traders use breakout tactics to enter the trade if the pattern is confirmed by a breakout over the resistance level. This entails putting purchase orders above the breakout level or holding off on making a trade until a decline allows for a retest of the breakthrough level.
What are the differences between Triple Bottom and Double Bottom Patterns?
The bullish reversal patterns triple bottom and double bottom are both frequently used in technical analysis. Both of these are having structural distinctions that are easily observable in the below charts.

A price reversal is followed by two equal lows that make up the double bottom pattern. It suggests a possible trend change from a bearish to a bullish one. The pattern is formed when a price level is reached twice and it is not severely broken below. A peak (resistance level) should occur between the two lows to distinguish them. It shows a higher likelihood of an upward price movement once the price breaks over the resistance level, validating the pattern.
The triple bottom pattern, on the other hand, entails three key lows that are roughly equal and are followed by a price reversal. The triple bottom pattern differs slightly from the double bottom pattern, it provides further proof. A pattern is formed, when a support level is reached three times by the price without dipping significantly below it. Two minor peaks (resistance levels) should have emerged between the three lows to differentiate them. The triple bottom pattern is formed when the price surpasses the resistance level created by the smaller peaks, signaling a potential trend reversal to the upside.


 Previous Article


![15 Investing.com Alternatives [Free+Paid] You Should Use in 2026](https://www.strike.money/wp-content/uploads/2026/04/Investing.com-Alternatives.jpg "15 Investing.com Alternatives [Free+Paid] You Should Use in 2026 40")
![15 TradeStation Alternatives [Free+Paid] You Should Use in 2026](https://www.strike.money/wp-content/uploads/2026/04/TradeStation-Alternatives.jpg "15 TradeStation Alternatives [Free+Paid] You Should Use in 2026 41")
![15 Chartink Alternatives [Free+Paid] You Should Use in 2026](https://www.strike.money/wp-content/uploads/2026/04/Chartlink-Alternatives.jpg "15 Chartink Alternatives [Free+Paid] You Should Use in 2026 42")


 : Definition, Formula, calculation, Uses, Advantages Vs limitations 46")


No Comments Yet.