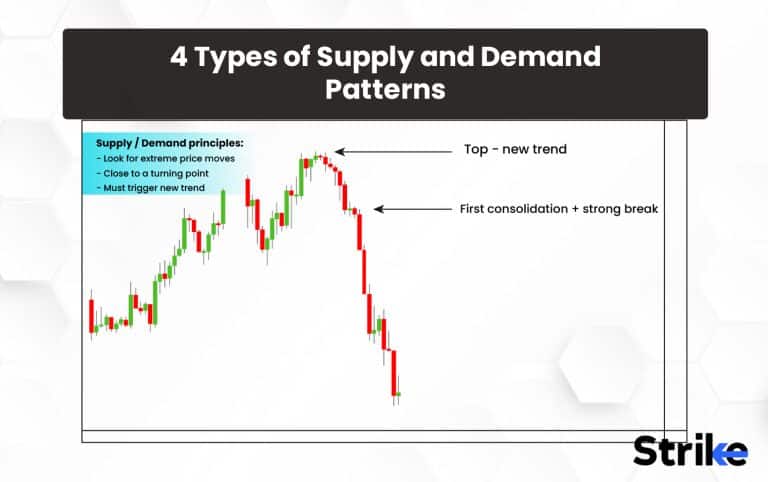
Supply and demand patterns are price movement structures that develop at trend reversals and form the trend. Supply and demand is the connection between the quantity of a good or service that producers want to sell at various costs and the quantity customers want to purchase. It serves as the primary approach for determining prices in economic theory. A supply zone is a range of prices at which sellers are ready and able to offer a particular good or service for sale, whereas a demand zone is a range of prices at which buyers are willing and able to buy a particular good or service. The rise in price leads to supply growth and demand decline. Supply is limited, and demand is increased when the price falls.
Supply refers to the amount of a good or service that producers can offer for sale at a given price and time. The quantity supplied typically increases as the price of the good or service rises, as producers are motivated to increase production and earn higher profits.
Demand, on the other hand, refers to the amount of a good or service that consumers can buy at a given price and time. The quantity demanded decreases as consumers are motivated to seek substitutes or reduce their consumption as the price of the good or service rises.
One of the primary elements that affect the price and quantity of products and services in the market system is the link between supply and demand. Prices are typically constant when supply and demand are in balance, but when there is a substantial imbalance, prices can change quickly.
The 4 most common types of supply and demand patterns are Drop base rally, Rally base drop, Rally base rally, Drop base drop.
These are the 4 most common types of supply and demand patterns. One has to consider these patterns to make more informed decisions about pricing, production, and resource allocation, ultimately leading to a more efficient and prosperous economy.
1. Drop Base Rally
The drop base rally is a trending price pattern that shows how demand has developed on the price chart. It is a pattern that occurs when the price of an asset experiences a sharp decline (drop), usually due to market forces such as economic or geo-political events. It is then followed by a period of consolidation where the price remains relatively stable and forms a base.

The consolidation phase occur for a period of days, weeks, or even months as traders and investors reassess the value of the asset and wait for new information to emerge.
The asset’s price experience a sudden and sharp increase (rally), once the base has been established. This increase could be due to various factors, including positive news about the asset, changes in market sentiment, or increased demand for the asset.
The drop base rally pattern is a bullish technical analysis pattern that can occur in financial markets. It is characterized by an initial price drop, followed by a base’s formation and a subsequent rally in price.
2. Rally Base Drop
The rally base drop is a price pattern typically appearing at market turning times. It is a pattern that occurs when the price of an asset experiences a sharp price increase (rally) followed by a period of consolidation where the price forms a “base” or sideways trading range and then experiences a significant price decrease (drop).

The traders and investors frequently see the rally base drop pattern as a negative indication. It implies that the asset’s price has peaked and will likely continue falling. This drop happen due to various things, including profit-taking on the part of investors, a change in market mood, or unfavorable information regarding the asset or the market it trades on.
The traders and investors use this pattern to decide whether to purchase or sell an item. Investors choose to sell an asset if the price of the asset suffers a rise, a base-forming consolidation, and a subsequent decline. Traders, on the other hand, can perceive it as a bullish signal and decide to purchase the asset, if an investment declines, consolidates in a base, and then rallies.
3. Rally Base Rally
The rally base rally is a pricing pattern that shows how demand is developing.It makes distinctive areas on the chart that boost demand and the number of buyers there.

The base is formed as the price of an asset trades within a relatively narrow range, indicating a period of uncertainty and indecision in the market. The buyers and sellers are in a state of equilibrium, and the price is said to be “consolidating” or “trading sideways” during this period.
The price breaks out of the range once the base is formed and begins to rally strongly in the opposite direction. This is seen as a bullish signal, often used to indicate a potential trend reversal or the start of a new uptrend.
4. Drop Base Drop
The drop base drop is a pricing pattern that indicates supply development. Its characteristics include a sharp price decline, a period of price consolidation at a lower point, and a further price decline below the consolidation point.

This pattern shows a change in the dynamics of supply and demand, with an early imbalance leading to a significant decrease in price. Buyers enter the market during the consolidation period, stabilizing prices for a moment. The selling pressure, eventually, overpowers demand, causing another plunge.
The drop base is a resistance level in this pattern and must be broken for prices to rise again. Traders and analysts use this pattern to spot possible purchase points at the base or sell points when the price falls beneath the consolidation level.
The drop base drop pattern emphasizes the importance of comprehending supply and demand dynamics in financial markets and how they affect price changes.
These are some of the patterns which help the businesses and traders to make decisions which are in profit for their businesses.
What is Supply and Demand?
The connection between the quantity of an item or service that producers are willing to offer and the quantity that customers are willing and able to acquire at a particular price level is described by the fundamental economics concept of supply and demand.
The law of supply states that as an item or service’s price rises, producers will increase the price they provide, contrary to the rule of demand, which claims that as a commodity or service’s price rises, customers will demand fewer goods or services. These laws combine to form a supply and demand curve that illustrates the connection between the cost of an item or service and the quantity that will be supplied and requested in a market.
Supply refers to the quantity of products or services that manufacturers can prepare and sell at a specific price. Producers are more eager to manufacture and sell more of a product when its price rises since it is more profitable for them. Demand refers to the quantity of products or services customers are willing to purchase at a specific price. Customers are more likely to buy more of a product as its price drops since it is now more affordable.
Supply and demand zone is a fundamental economic idea that clarifies how markets operate and prices are set. We better understand how to allocate resources and set prices, by examining the variables that affect supply and demand resulting in a more effective and prosperous economy.
How Does Supply and Demand Work?
Supply and demand is a fundamental principle in economics that explains how markets work and how prices are determined. The basic idea is that the prices will increase when the demand for a good or service is high and the supply is low. The prices tend to decrease on the other hand, when the supply is high and the demand is low. The equilibrium point where the quantity supplied and quantity demanded are equal is known as the equilibrium point, where the market price tends to settle without external factors.
The two underlying concepts governing supply and demand are the law of demand and supply.Customer demand for a commodity or service falls as its price rises, according to the law of demand. This is because people will be less likely to purchase if a product or service is costly. People, on the other hand, are willing to buy as a good or service’s price drops. Consumers are more likely to purchase a product or service if the price is lower.
The law of supply, on the other hand, states that when the cost of an item or service rises, producers must supply more of it. Higher prices will encourage manufacturers to create and market a good or service. Manufacturers, on the other hand, supply less as an item or service’s cost drops. This is because manufacturers will be less inclined to make and sell an item or service’s price is too low.
A fundamental idea in economics, supply and demand, helps us comprehend how markets operate and how prices are set. We better understand how to allocate resources and set prices, by examining the variables that affect supply and demand, resulting in a more effective and prosperous economy.
What Does the Supply and Demand Pattern Indicate?
Supply and demand patterns represent the link between the quantity of an item or service that producers are willing to provide and the quantity customers can acquire at a specific price level. These patterns help in observing consumer and producer behavior in a market and explain how prices are established.
Prices often rise when an item or service is unavailable due to strong demand and insufficient supply. A surplus is created and prices tend to go down when supply is large and demand is low. The equilibrium point is where supply and demand are equal, and this is where the market price will typically settle in the absence of any outside influences.
One can forecast future prices and quantities of goods or services by examining the supply and demand trends in a market, and we modify our plans as necessary. We could boost output or raise pricing if demand for specific products or services rises to take advantage of the market conditions. We, on the other hand, need to change our production levels or reduce our pricing to be competitive, if we know that supply is growing.
How Do Supply and Demand Patterns Impact Market Dynamics?
The price and amount of products or services bought and sold in a market are determined partly by supply and demand patterns, which are crucial in determining market dynamics. A product’s price increases when it’s lacking and there is significant demand for it. Prices usually drop and result in a surplus, when a product’s supply is high and demand is low. The equilibrium point is where supply and demand are equal, and this is where the market price will typically stabilize in the absence of any outside influences.
Supply and demand trends, essential in establishing market dynamics, influence the price and quantity of goods and services purchased and sold in a market. Prices often increase when a product is in short supply and has a high demand. A surplus develops, and prices often decline when a product’s supply and demand are high and low. The market price will generally settle at equilibrium without outside forces when supply and demand are equal.
Market dynamics are also impacted by variations in supply and demand, which affect producer competitiveness. There is an incentive for companies to expand output when demand is strong, which results in more competition and lower pricing. Companies need to fight more fiercely for consumers, when there is less demand, resulting in lower pricing and more significant innovation.
Supply and demand patterns play a significant part in setting pricing, the volume of sales, and producer competitiveness. Understanding these trends will help market players make better price, output, and resource allocation choices, eventually resulting in a more prosperous and efficient economy.
What are the Determinants of Supply?
The determinants of supply are the various factors influencing the quantity of a good or service producers are willing to supply at a given price. Five of the key determinants of supply are listed below.
- Production costs: The cost of producing a good or service, including raw materials, labor, and overhead, can affect the quantity of a good or service producers are willing to supply. Higher production costs can lead to lower supply, while lower production costs can lead to higher supply.
- Technology: Technological advancements can increase production efficiency, leading to an increase in supply.
- Government policies: Government policies such as subsidies, taxes, and regulations can affect the cost of production and the incentives for producers, which can impact the supply of goods and services.
- Competition: The level of competition in a market can affect the supply of goods and services, as producers are more or less willing to supply a good or service depending on the level of competition they face.
- Natural factors: Natural factors such as weather, natural disasters, and environmental conditions can impact the supply of goods and services, especially for industries such as agriculture and mining.
The different factors that impact the production and supply of products and services in a market are collectively known as the determinants of supply.
What are the Determinants of Demand?
The determinants of demand are the various factors influencing the quantity of a good or service that consumers can purchase at a given price. Five of the key determinants of demand are listed below.
- Income: Income is a significant determinant of demand, as it affects the purchasing power of consumers. Higher-income levels generally lead to higher demand for goods and services, while lower income levels lead to lower demand.
- Price of related goods: The cost of associated goods, such as substitutes or complements, can affect the demand for a particular interest or service. For example, the price of a substitute good increases, then consumers switch to the original good, increasing demand.
- Consumer preferences: Consumer preferences, such as taste, style, and fashion, can affect the demand for goods and services. Changes in consumer preferences lead to shifts in demand for certain products.
- Population: The size and demographics of the population can affect the demand for goods and services. An increase in population, for example, leads to higher demand for goods and services.
- Advertising and marketing: Advertising and marketing can influence consumer preferences and increase the demand for certain goods and services.
The different elements that affect customers’ willingness and capacity to buy products and services collectively make up the determinants of demand.
How can businesses respond to changes in supply and demand patterns?
There are several methods for businesses to react to shifts in supply and demand trends. A company can boost production or change its price policy to meet the rise in demand of a product. Alternatively, a company decides to scale back production, modify prices, or look into new markets or product lines to compensate for a drop in demand.
Businesses alter their sourcing tactics, look for new suppliers, or invest in new technologies in reaction to supply changes to boost productivity and lower production costs. They could adjust prices to reflect supply and demand dynamics changes or look into alternative income sources or business models to respond to shifting market conditions.
Companies that can react swiftly and successfully to changes in supply and demand patterns are more likely to prosper in today’s quickly changing market. Businesses handle shifting market conditions and seize new opportunities as they present themselves by remaining flexible and adaptive.
What Factors Influence the Formation of Supply and Demand Patterns?
There are mainly 5 factors namely competition, technology etc that influence the formation of supply & demand patterns. These factors are listed below.
- Market competition: The market competition level can influence supply and demand. Businesses need to adjust their pricing or production strategies to remain competitive, which impacts both supply and demand patterns.
- Consumer preferences: Consumer preferences and trends can influence the demand for certain goods and services, leading to changes in supply and demand patterns.
- Technological advancements: Technological advancements can impact supply and demand patterns by changing how goods and services are produced and consumed.
- Government policies and regulations: Government policies and regulations, such as taxes, tariffs, and trade restrictions, can impact both supply and demand patterns by affecting the cost of production and the incentives for businesses.
- Economic conditions: Economic conditions such as inflation, recession, and unemployment can impact both supply and demand patterns by affecting consumer behavior and the cost of production.
A complex interaction of factors, such as market competition, customer preferences, technological advances, environmental causes, and economic situations, affects how supply and demand patterns develop. Understanding these elements and their interactions can help firms allocate resources more wisely and set prices, resulting in a more effective and prosperous economy.
How can businesses Use supply and demand patterns to Predict Market changes?
Businesses can use supply and demand patterns to predict market changes and make more informed pricing, production, and resource allocation decisions. Here are 3 ways businesses can use supply and demand patterns to predict market changes are listed.
- Collect and analyze market data: Businesses can collect and analyze data on sales, customer behavior, and industry trends to identify patterns in supply and demand. This data is used to make informed predictions about future market changes.
- Monitor competitor behavior: Businesses can monitor the behavior of competitors in the market to identify changes in supply and demand patterns. This can provide valuable insights into changing customer preferences and emerging industry trends.
- Analyze macroeconomic indicators: Businesses can analyze macroeconomic indicators such as GDP, inflation, and unemployment to gain insights into broader economic trends that may impact supply and demand patterns.
These strategies along with chart patterns are used to analyze supply and demand patterns. This can help businesses stay ahead of the competition and adapt to changing market conditions, ultimately leading to long-term success and profitability.
What is Demand Forecasting in the Supply Chain?
Demand forecasting is a process of predicting the future demand for goods or services in a supply chain. It involves analyzing historical data, market trends, and other factors to estimate the demand for a product or service over a specific period of time. Demand forecasting is essential to supply chain management, as it helps businesses plan production, inventory, and logistics based on anticipated demand.
Accurate demand forecasting can help businesses to optimize their supply chain operations and reduce costs by avoiding overproduction or underproduction. Businesses can adjust pricing strategies, marketing campaigns, and other business decisions by anticipating future demand to align with market trends and consumer preferences.
An example of demand forecasting is when a clothing retailer uses historical sales data and market research to predict future demand for certain clothing items. The retailer can analyze sales data from previous years to identify trends and patterns in consumer behavior, such as seasonal fluctuations or changing fashion trends. They can also conduct market research to identify emerging trends and customer preferences.
What is Supply Forecasting?
Supply forecasting is a process of predicting the future availability of goods or services in a supply chain. It involves analyzing various factors that can affect the production and delivery of a product or service, such as raw materials availability, production capacity, and logistics constraints.
Supply forecasting is essential to supply chain management, as it helps businesses to plan their operations and meet the anticipated demand. Accurate supply forecasting can help businesses to avoid stockouts, optimize inventory levels, and reduce the costs associated with production and delivery.
An example of supply forecasting is a company that manufactures solar panels. The company would need to predict the future supply of raw materials such as silicon, a key component of solar panels. The company could use historical data on silicon production, trends in the semiconductor industry, and other factors to estimate the future supply of silicon.
What Does Supply and Demand Curve Mean?
The supply and demand curve is a graphical representation of the relationship between the quantity of a product that producers are willing to supply and the quantity that consumers are willing to purchase at various price levels. It shows how market equilibrium is reached.

The supply curve slopes upward from left to right, indicating that as the price of a good or service increases, suppliers are willing to produce and sell more of it. This relationship is based on the law of supply, which states that as the price of a good or service increases, producers have the incentive to supply more of it because they can earn higher profits. Suppliers, on the contrary, are willing to produce and sell less as the price of a good or service decreases.
For example, the quantity supplied by producers increases, as the product price increases. The upward-sloping supply curve indicates this. Producers are willing to supply 100 units of the product at a price of Rs, 2. The quantity supplied increases to 250 units as the price increases to Rs. 8..
| PRICE OF THE PRODUCT | QUANTITY OF THE PRODUCT |
| 2 | 150 |
| 4 | 200 |
| 6 | 250 |
| 8 | 300 |
The demand curve slopes downward from left to right, indicating consumers are willing to purchase less of a good or service as it increases. This relationship is based on the law of demand, which states that as the price of a good or service increases, consumers will seek out substitutes or reduce their overall consumption, decreasing order. Consumers, on the contrary, are willing to purchase more of it, as the price of a good or service decreases.
For example, the quantity demanded by consumers increases, as the price of the product decreases. The downward-sloping demand curve indicates this. Consumers are willing to purchase 150 units of the product, at a price of Rs.8. The quantity demanded increases to 300 units, as the price decreases to Rs. 2.
| PRICE OF THE PRODUCT | QUANTITY OF THE PRODUCT |
| 2 | 300 |
| 4 | 250 |
| 6 | 200 |
| 8 | 150 |
The intersection of the supply and demand curves is called the market equilibrium point. This is where the quantity of the product supplied by producers is equal to the quantity demanded by consumers, and the price is stable. Any shift in the supply or demand curves will result in a new market equilibrium point and a change in the price and quantity of the product exchanged in the market.
The supply and demand curve is useful for analyzing market dynamics and understanding how price, supply, and demand changes affect market outcomes.
Can I Use the Supply and Demand Pattern to Predict the Market Trend?
Yes, market trends can be predicted using supply and demand patterns. The basic concept of supply and demand is that when the demand for a certain commodity or service rises, the price will follow since a finite amount of that good or service is a finite amount of that good or service available. The price will fall, on the other hand, when supply grows in relation to demand. This implies you can forecast market trends by studying supply and demand patterns.
For example- demand for a commodity is rising quickly, but the supply is still constrained. You can anticipate that the price of the product will rise in the future. Alternatively, you forecast that the price will drop in the future if the supply of a certain product is growing, but the demand is largely steady.
Is Drop Base Drop Bearish?
Yes, the “Drop Base Drop” pattern in supply and demand analysis is considered a bearish pattern. This is due to the pattern’s indication of a downward tendency in an asset’s or commodity’s price, with a sharp decline followed by a period of stabilization before another decline occurs.
This pattern is used as a signal by traders and investors who use technical analysis, candlesticks to sell or short an asset or commodity since it denotes the possibility of an extended negative trend.
Is Rally Base Rally Bullish?
Yes, Rally base rally pattern in supply and demand analysis is considered a bullish pattern. The pattern typically occurs when there is a strong uptrend in a particular asset or security, followed by consolidation or base formation, and then a resumption of the uptrend. This pattern can indicate a strong demand for the asset or security, and the consolidation period can provide a good buying opportunity for traders and investors.
This pattern suggests that demand is strong, as buyers are willing to continue purchasing at higher prices even after a period of consolidation. Traders and investors, as a result, interpret this pattern as a bullish signal and consider buying into the market in anticipation of further price increases.
Is Price the Basis of Supply and Demand?
Yes, price is the basis of supply and demand. It acts as a key factor in the formation of supply and demand. The price of a good or service is determined by the intersection of supply and demand in the market. The price tends to decrease when the supply of a product exceeds demand, and the price tends to increase when demand exceeds supply.


 Previous Article


![15 Investing.com Alternatives [Free+Paid] You Should Use in 2026](https://www.strike.money/wp-content/uploads/2026/04/Investing.com-Alternatives.jpg "15 Investing.com Alternatives [Free+Paid] You Should Use in 2026 64")
![15 TradeStation Alternatives [Free+Paid] You Should Use in 2026](https://www.strike.money/wp-content/uploads/2026/04/TradeStation-Alternatives.jpg "15 TradeStation Alternatives [Free+Paid] You Should Use in 2026 65")
![15 Chartink Alternatives [Free+Paid] You Should Use in 2026](https://www.strike.money/wp-content/uploads/2026/04/Chartlink-Alternatives.jpg "15 Chartink Alternatives [Free+Paid] You Should Use in 2026 66")
: Overview, 10 Types of Indicators, Settings for Different Markets 68")

 : Definition, Formula, calculation, Uses, Advantages Vs limitations 70")


No Comments Yet.