Candlesticks are the representation of price movement that takes place in the price of a stock. Candlesticks are the major part of technical analysis. A single candlestick can indicate the opening, closing, high and low price of a stock at a particular time. The overall trend of the price movement is represented by candlesticks. Regular occurring candlestick patterns are used by traders to predict short term price movements.
Candlesticks represent the traders sentiment towards security. The candlesticks are used by traders to decide when to enter and exit trades. Identifying candlestick patterns and using technical tools for buying and selling securities form the foundation of technical analysis.
Candlestick patterns were developed in Japan before it was introduced into the western world. The origin of using candlesticks has two different schools of thought, both of which originated from Japan.
The candlestick consists of 3 major parts based on which the candlestick pattern is read. All candlestick patterns are read and analyzed on the basis of these 3 parts i.e, the upper shadow, the body and the lower shadow.
The different combinations of the upper shadow, the lower shadow and the body results in different candlestick patterns. Each candlestick pattern represents different scenarios in the market and helps the traders time their entry and exit in the market.
What Are Candlesticks?
The price movement of a stock can be represented in terms of graphical representations using candlesticks. These graphical representations have a tendency to repeat themselves during the course of time. These repeated patterns are used for technical analysis. The repeated patterns are referred to as Candlestick Patterns. Candlestick patterns are analyzed to predict short-term future movement of stocks. These patterns also depict market sentiments.
Candlestick Patterns are mainly classified into two types:
- Bearish candlestick patterns: The Bearish candlestick pattern gets its name from fact that bears use their claws to strike down other animals. The Bearish candlestick thus indicates the downward trend of a stock. The appearance of Bearish candlesticks denotes that more sellers (of the stock) have entered the market as compared to the buyers (of the stock). Since the sellers outnumbered the buyers the price of the stock fell. A large number of buyers tried to resist the sell-off of the stock If the bearish candlesticks had large upper shadows.
- Bullish candlestick patterns: The Bullish candlestick pattern gets its name from the fact that Bulls use their horns to swing up on other animals. The Bullish candlesticks thus indicate the upward trend of a stock. The appearance of Bullish candlesticks denotes more buyers (of the stock) have entered the market as compared to the sellers ( of the stock). Since the buyers outnumbered the sellers the price of the stock rose. A large number of sellers tried to sell off the stock if the bullish candlestick had a large lower shadow.
What is the Origin of Candlesticks Pattern?
Candlestick patterns were developed in Japan before it was introduced into the Western world. The American author Steve Nison introduced the candlesticks to the modern world in his book “Japanese Candlesticks Charting Techniques” published in 1991. The origin of using candlesticks have two different schools of thought:
- The candlesticks were developed by a Japanese rice trader named Munehisa Homma
- The candlesticks were developed in the late 1800 during the Meiji period in Japan.
The method of candlesticks was adopted and still used because of its ease of reading and understanding the movement of prices. Later the method was used to predict future price movements as well.
What Do Candlesticks Indicate?
Candlesticks are graphical representations that indicate the price where a stock has opened, closed, its high and low price. The change in prices that is observed in terms of candlesticks are traders’ sentiment towards a particular stock. The traders can decide on buying and selling the stock by observing market sentiments. Candlesticks can be used to observe 3 aspects of a stock. They are as given below.
- The past performance of a stock: The stock’s previous day/week/month or even year performance can be analyzed using the candlesticks of that period. The past performance of a stock is mainly used by fundamental analysts for long-term trading. Fundamental analysis involves observing how stock prices held up during different periods of time.
- The current performance: The current market sentiment towards the stock can be gauged to measure the volatility in the market.
- Short-term future performance: The technical analysis of a stock is done using candlestick which helps provide short term future performance. The repeated patterns provide the future direction of the price moment.
The candlesticks are the easiest way of representing the overall performance of a security. The candlesticks help traders interpret the price information of different securities.
What Are the Parts of A Candlestick?
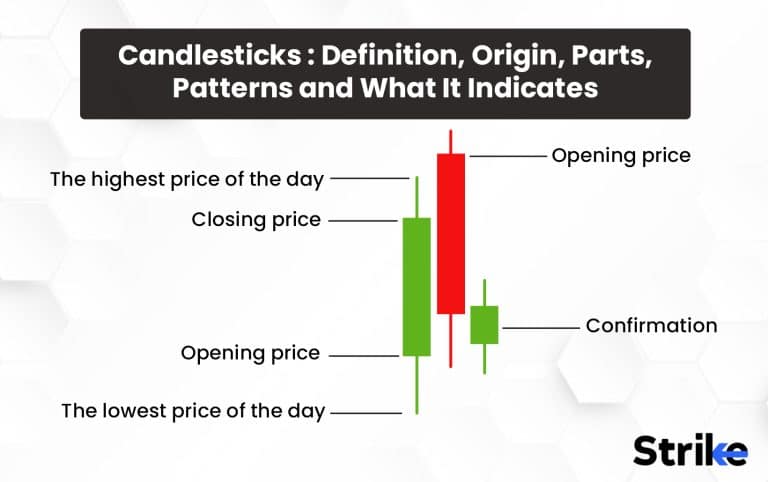
The candlesticks provide vital information by using its 3 components. The 3 components of a candlestick are:
- The Upper Shadow/Upper Wick: The Upper Shadow represents the movement of the stock price above its open and close prices at a particular point of time. The greater difference in high and the open/close price is indicted by the large upper shadow.
- The Real Body: The Real Body of a candlestick measures the gap between the opening price and the closing price of a stock. The Real Body of a stock can be of 2 colors. The colors indicate whether the stock is bullish or bearish. A green/white real body is formed if the opening prices are lower than the Closing prices. A red/black real Body is formed if the closing prices are lower than the Opening prices.
- The Lower Shadow/Lower Wick: The Lower Shadow represents the movement of the stock price below its open and close prices at a particular point of time. A large lower shadow indicates that there were more bears in the market.
The body and the two shadows thus, form the basis of reading a candlestick.
What Are the Major Points of Candlestick?
A candlestick provides 4 vital information by using its 3 components.The vital information provided by the candlestick are:
- The Opening Price: The opening price of a stock is the price at which the stock is valued at the beginning of a trade-day or during the start of a particular period. The openings of candles are compared to check whether the prices are following a bullish or bearish trend. The greater the opening price of the current candle (as compared to the previous candle’s closing) the greater the bullish movement and vice versa.
- The Closing Price: The closing price of a stock is the price at which the stock is traded at the end of a trade day or the end of a particular period. The closing price of the security can act as the yardstick with which future openings can be compared.
- The High: The highest point of a candlestick is referred to as The High. The High represents the highest value at which a stock has reached during a particular day or period. The increasing highs indicate a bullish trend.
- The Low: The Lowest point of a candlestick is referred to as The Low. The Low represents the lowest value at which a stock has reached during a particular day or period. The consecutive lows indicate a bearish trend.
The combination of the highs, lows, opening and close are used to form candlestick patterns to predict different trends.
How to Read the Candlestick Patterns?
Reading a candlestick can be done by analyzing the different parts of a candlestick. The body of a candle provides the Opening and Closing prices of a stock. The Upper and Lower shadow of a candle provides the highs and lows of the stock. The traders can use the candlesticks to understand the price range of the stock they observe. Green color is attributed to bodies of candlesticks if the stock is having a bullish uptrend. Red color is attributed to the bodies of candlesticks if the stock has a bearish trend.

The above figure shows the candlestick pattern of a stock that is facing a huge sell off initially. The initial sell off is denoted with red candlesticks forming one below the other. The trader can read the candlestick and use technical tools to decide whether to enter into a trade or not. The initial fall of the stock prices stabilizes after a few candlesticks. The stock prices move upwards which is denoted by the green candlesticks. Thus the trader understood:
- Consecutive Red candlesticks denote heavy selling action of the stock.
- A combination of Red and Green candlestick after the initial fall denotes the volatility of the price.
- Consecutive Green candlesticks denote heavy buying action of the stock.
A trader will be able to identify patterns from the information provided by the candlestick that will help them make decisions. Four other details about the stock can be obtained using the candlesticks. The image above depicts some
- Red candlesticks that have a short Upper Shadow shows the stock price opened near its high of the day/particular period.
- Red candlesticks that have long Upper Shadow shows the stock price opened away from its high of the day/particular period.
- Green candlestick that has a short Upper Shadow shows the stock price closed near the high of the day/particular period.
- Green candlestick that has a long Upper Shadow shows the stock price closed away from the high of the day/particular period.
Each candlestick indicates the market condition and the buy/sell action taking place.
What Are Candlesticks Patterns?
Candlestick patterns are indicators of price movements.The candlesticks have a tendency to repeat themselves during the course of time. These Candlestick patterns are analyzed for predicting short term future movement of stocks.These patterns also depicts market sentiments. Candlestick Patterns are mainly classified into two types:
- Bearish candlestick patterns: The Bearish candlestick pattern gets its name from the fact that bears use their claws to strike down other animals. The Bearish candlestick thus indicates the downward trend of a stock.The appearance of Bearish candlesticks denotes more sellers (of the stock) have entered the market as compared to the buyers (of the stock). The price of the stock falls as the number of sellers are greater than the number of buyers. It indicates that a large number of buyers have tried to resist the sell off if the bearish candlestick has large upper shadows.

The above figure depicts an example of a Bearish candlestick pattern. The Bearish candlestick pattern displayed above is commonly referred to as the Bearish Engulfing pattern. A Bearish trend is indicated with the red candlestick engulfing the previous green candlestick. The difference between the closing of the Bullish candle and the opening of the Bearish candle is referred to as “Gap up opening” in the above figure.
- Bullish candlestick patterns: The Bullish candlestick pattern gets its name from the fact that Bulls use their horns to swing up on other animals. The Bullish candlesticks thus indicate the upward trend of a stock. The appearance of Bullish candlesticks denotes that more buyers (of the stock) have entered the market as compared to the sellers ( of the stock). The price of the stock rose as the number of buyers outnumbered the sellers. Large number of sellers causes the bullish candlestick to have a large lower shadow.

The bearish and bullish candlesticks form the basis of technical and fundamental analysis.
The above figure depicts an example of a Bullish candlestick pattern called the Morning Star pattern. The Morning Star pattern indicates a Bullish movement in the market. The Morning Star pattern begins after the formation of a large Bearish candle. Following the large Bearish candlestick comes the small Bullish/Bearish candlestick.Thereafter the market witnesses an uptrend changing from Bearish to Bullish.
What Are the Bullish Candlestick Patterns?
Bullish candlestick patterns are the patterns that indicate an uptrend in the market. Bullish candlestick patterns are formed when the buyers, referred to as Bulls, try to increase the price of a stock by buying more of it. All Bullish candlesticks have a common pattern of having its closing price greater than its opening price. Identifying Bullish candlestick patterns will help in identifying how market prices move.
Different Bullish candlestick patterns are recognized to form different strategies. The 6 basic Bullish candlestick patterns are as given below:
1. Bullish Engulfing
The Bullish engulfing pattern (as shown in the figure) consist of a small Bearish red candle engulfed by a larger Bullish green candle.

The 3 features of the Bullish engulfing candle are as given below:
- The Bullish engulfing candle has its opening price equal to or lower than the close price of the Bearish candle.
- The body of the Bullish candle will be greater than the entire Bearish candlestick that appeared before.
- The Bullish Engulfing candle’s close price will always be above the Bearish candle’s opening price.
The bullish engulfment is the basic uptrend pattern. Identifying bullish engulfing along with other technical tools increases accuracy in day trade.
2. Hammer
The Hammer candlestick is the basic signal for a trend reversal in the market. The formation of a Bullish hammer pattern will result in the market movement from Bearish to Bullish.

The 5 features of the Bullish hammer are as follows:
- The Bullish hammer pattern is formed at the end of a downtrend (after a bearish candle).
- The Bullish hammer has the body close to the high because of the bulls dominance over the bears.
- The hammer is formed when a stock trades at a significantly lower price than its opening price and will have its close price nearer to its opening price at the end of a particular period/day.
- The formation of a Bullish hammer results in trend reversal in the market and will result in the price of the stock increasing.
- The increase in the price of the stock after the formation of a Bullish hammer is called “Confirmation”.
The strength of the uptrend is proportional to the gap up that takes place in the candlestick following the hammer candlestick. A greater gap up denotes a stronger uptrend and vice versa.
3. Inverted Hammer
The Inverted Hammer candlestick pattern is a Bullish candlestick pattern that indicates gradual trend reversal of the market. The Inverted Hammer candlestick is made of a candle with a smaller lower shadow/wick and a large upper shadow/wick.

The Upper shadow of the candlestick is twice or more than twice the lower wick of the candlestick. The reason for the trend reversal and the formation of the shape can be attributed to 5 factors:
- The stock will face a bearish trend initially, and the prices move down till the price stabilizes .
- The price of the stock stabilizes after the buying and selling pressure cancels off each other and the price of the stock closes at the same closing price.
- The buyer pushes the price up above its opening price after the price stabilizes but the prices come down due to the selling pressure (thus forming the larger upper shadow).
- The buyers will out-buy the selling thus causing the Inverted Hammer to emerge.
- The trend continues with another green Bullish candle to form following the previous trend while maintaining the same low price.
The future movement can be predicted by the strength of the Bulls by observing the body of the candle.
4. Piercing Line
The Piercing Line Candlestick pattern is a potential short term reversal pattern from Bearish to Bullish. The major difference of this pattern from the rest of the Bullish pattern is that it’s a slow indicator. The Piercing Line is used by comparing 2 candlesticks.

The Piercing Line is identified using 4 characteristics:
- It forms near the final points of a downtrend where the price stabilizes
- The Piercing Line begins next to a Bearish candlestick.
- The Bullish candlestick’s opening price will be lower than the closing price of the Bearish candle.
- The Bullish candle closes halfway above the opening of the Bearish candle.
The Piercing Line candlestick is a two part candlestick. The first day the sellers play a role in bringing a Bearish movement in the market. The second day the buyers take hold and push the price to a Bullish trend. This reversal in trend indicates that the sellers have exhausted their sellings and the buying overpowers it. The pattern thus proves to be a reliable uptrend forecast.
5. Morning Star
The Morning Star pattern involves three candlestick patterns. The Morning Star pattern is a Bullish pattern. The pattern begins at the end of a downtrend.

The Morning Star pattern starts off with a tall red Bearish candlestick. The second candlestick consists of a short body and a long upper/lower shadow (Bullish or Bearish depending upon the market sentiment). The third candlestick formed is a long Bullish one that indicates an uptrend. The 3 key aspects of the Morning Star are
- The pattern indicates a bullish trend reversal pattern.
- The difference between the opening price and closing price shows the strength of the Bullish upswing.
- The trend reversal indicates the exhaustion from the sellers and the increased demands from the buyer.
The length of the body of the green/ Bullish candlestick determines the strength of the upward price movement.
6. Three White Soldiers
The Three White Soldiers also referred to as the Three Advancing Soldiers are indicators of the downtrend reversal.

The Three White Soldiers appear after a long downtrend. The pattern indicates that the Bulls have started becoming stronger than the Bears. The 5 key characteristics that help to identify the Three White Soldiers are as follows:
- The pattern appears at the end of a downtrend.
- Three consecutive Bullish candlesticks will be formed one after another.
- The Bullish candles will have long bodies and have little or no shadows at both ends.
- The closing of the Bullish candle should be above the closing of the previous Bullish candle
- The opening price of the second Bullish candle in the pattern must be between the high price and the upper body of the previous day’s Bullish candle.
The third Bullish candle should have its low price near the closing price of the previous day’s Bullish candle.
The 6 candlestick patterns mentioned form the base of bullish patterns.
What Are the Bearish Candlestick Patterns?
The Bearish candlestick pattern indicates a trend reversal from Bullish to Bearish. Resistance in the uptrend is one of the things a Bearish Candlestick denotes when it appears in the charts . The Bearish candlestick appears at the top of an uptrend. The patterns come into place after the buyers have exhausted their demands for the stock and the selling sentiment takes over the market.
Different types of Bearish candlesticks are recognized to form different patterns. The 6 basic Bearish candlestick patterns are:
1. Bearish Engulfing
The Bearish engulfing patterns are characterized by a Bullish green candle being overshadowed by a Bearish red candle.

The pattern will consist of a Bullish candle that will have a long lower shadow and a small body. The second candle formed will be a Bearish red one with its opening above the body of the previous Bullish candle and has a greater high and low as compared to the previous candle. Bearish engulfing patterns occurs due to the buyers losing dominance to the sellers. With the sellers taking over the market trend turns to bearish.
2. Hanging Man
The Hanging man candlestick pattern is a Bearish candlestick pattern that indicates a trend reversal. The Hanging man pattern appears at the top of an uptrend.

The pattern looks similar to the Hammer pattern but the only difference is the place at which the pattern appears. The 4 key aspects of the Hanging Man pattern are as follows:
- The pattern has a long lower shadow and a short or non-existing upper shadow with a small body close to the high.
- The large lower shadow is caused by the heavy buying and selling of huge volumes of the stock.
- The pattern appears at the top of an uptrend thus it indicates the exhaustion of the buyers and the sellers taking over.
- The Hanging Man indicates potential sell off in the short future.
The hanging man belongs to a category of candlestick called the spinning tops as the pattern consists of only a single candlestick.
3. Shooting Star
The Shooting Star candlestick pattern is a basic Bearish candlestick pattern. The pattern indicates a Bearish trend reversal.

The Shooting Star pattern is similar to the Inverted Hammer pattern but the only difference is the trend at which it appears. The Shooting Star pattern appears at the end of an uptrend. The pattern indicates a sell off in the near future. The 5 key aspects of the Shooting Star pattern are as follows:
- The Shooting Star is characterized by a long upper shadow with a short or non-existing lower shadow.
- The pattern has a small body close to is Low price
- The large upper shadow is caused by the initial opening price which was further pushed forward by the buyers.
- The buyers will get exhausted and the selling takes place which brings the closing price near its Low.
- The pattern always appears at the top of an uptrend and is included in the category of spinning tops as only one candlestick is involved.
- The Shooting Star indicates the beginning of a trend reversal.
The strength of the down trend can be estimated by analyzing the difference in gap down opening that initiates the downtrend.
4. Evening Star
The Evening Star candlestick pattern is a 3 candlestick pattern.

The pattern starts off with a Bullish candlestick which indicates more buying than selling of a stock. The second candlestick involved can be Bullish or Bearish depending upon the market sentiment. The second candle will have a small body with little upper and lower shadow. The third candle will be a Bearish candlestick that indicates a downtrend of the price. The Evening Star candlestick consist of 5 main features:
- The initial Bullish candle will have a long body which indicates the dominance of the buyers over the sellers.
- The second candlestick referred to as the STAR opens with a gap up from the previous candlestick.
- The Bearish candlestick opens with a gap down from the second candlestick and continues the trend of having a sell off.
- The body of the Bearish candle closes near the middle of the Bullish candle
- Both the initial and the final candles have lower lows than the “STAR” candle.
The evening star pattern requires more technical tools in order to utilize it effectively.
5. Three Black Crows
The Three Black Crows is a Bearish candlestick pattern that signals a trend reversal in the market. The Three Black Crows is the counterpart of the Three White Soldiers depicts a Bullish uptrend.

The Three Black crows consist of 3 candlesticks that are formed after an uptrend reaches its peak. The Three Black Crows consist of 5 main characteristics:
- The formation of the Three Black Crows begins with the buyers trying to push the opening price higher than the previous close
- The buyers initially succeed but the sellers soon take hold of the trend and begin to push the price down.
- The sell off pressure results in the formation of the first “BLACK CROW”
- The trend continues as the sellers dominate more and more causing the second Bearish candle to open at a lower price than the first Bearish candle’s closing price.
- A third black crow candle is formed in accordance with the sell off. The opening price will thus be near the midpoint of the second Bearish candle.
The strength of the reversal relies on the gap down at which the candle opens . The greater the gap down the greater the trend reversal.
6. Dark Cloud Cover
The Dark Cloud Cover is a Bearish pattern. Unlike the other patterns discussed, the Dark Cloud Cover is difficult to read when it appears.

The Dark Cloud Cover is similar to the Piercing Line candlestick, the major difference being the point at which the candlestick is formed. The Dark Cloud Cover forms at the end of an uptrend. The partial exhaustion of the Bulls along with the overpowering of the Bears cause the formation of the Dark Cloud Cover. The 5 characteristics that helps to identify the Dark Cloud Cover pattern are as follows:
- The Dark Cloud Cover pattern is found at the end of an uptrend where the Bulls are slowly losing its dominance in the trend.
- The pattern appears next to a Bullish candle pattern. The pattern has an opening price above the close price of the Bullish candle.
- The Dark Cloud Cove has a closing price below the mid of the Bullish candle.
- There will always be a gap up between the closing of the Bullish candle and the opening of the Dark Cloud Cover candle.
- There will always be a gap down between the closing of the Dark cloud cover candle and the opening of the Bearish candle that forms afterwards (It indicates the beginning of the trend reversal).
The 6 bearish candlestick patterns help the trader get an idea of how the bearish movement takes place in the market.
What Are Other Important Patterns to Look At?
There are 4 more candlestick patterns that are common to both Bullish and Bearish candlesticks. These 4 candlestick patterns are as follows:
1. Spinning Top
The Spinning Top candlestick pattern is a single candlestick pattern that can appear at the end of both Bullish and Bearish trends.

The Spinning Top candlestick pattern indicates a trend reversal from either Bullish to Bearish or vice-versa. 5 common characteristics are shared by both bullish and bearish candlesticks. These characteristics can be used to identify Spinning Top patterns. The 5 characteristics are:
- They are single candlestick patterns.
- The body of the candlesticks are small.
- The upper and lower shadow of the candlestick are long and the body should be halfway along the previous candlesticks.
- The formation of the pattern indicates that the buying and selling pressures from the Bulls and the Bears are high and they are canceling off each other.
- The pattern has a large gap between its high and low and a small gap between its opening and closing price.
The Bullish Spinning Top appears at the end of a down trend and the Bearish spinning top appears at the end of an uptrend. Both patterns will be recognized if the trader is familiar when the up/down trend is coming to an end
2. Doji
The Doji candlestick pattern can be of Bullish or Bearish nature. The Doji candlestick appears when the stocks are bought and sold heavily.

The Doji pattern is formed when the demand and supply of the stock/market is equal and cancels each other. The Doji candlestick can be divided into 5 depending on who takes control first (the buyers or the sellers) :
- Doji Star:- A Doji Star can either be Bullish or Bearish depending on the trend. A Bullish Doji Star which resembles the addition sign (+) appears after downtrend. The pattern is put to technical analysis if the candlestick that appears after it opens above the Bullish star of the pattern. The Bearish Doji star, similar to the Bullish one, resembles an addition sign (+) and appears after an uptrend. The trend is said to turn Bearish if the candle forming after the star is below the Bearish star sign.
- Long Legged Doji:- The Long Legged Doji appears as both a Bullish and Bearish trend signal. The Long Legged Doji sign signifies that the opening and the closing prices of a stock are almost the same. The high and low of the candlestick varies greatly. The Long Legged Doji suggests ambiguity in the market. The Long Legged Doji is taken as a sign of high volatility in the market.
- GraveStone Doji:- The GraveStone Doji pattern is considered as a Bearish candlestick pattern that indicates a trend reversal in the market. The pattern is formed when a candlestick has opening, closing and low prices near to each other and a long upper shadow. The upper shadow indicates how the buyers dominated initially but later lost control to the sellers.
- Dragonfly Doji:- The Dragonfly Doji is considered to be a signal for bullish trend reversal in the market. The candlestick consists of an opening, closing and high close to each other and a long lower shadow. The Dragonfly Doji is the counterpart of the GraveStone Doji. The candle is formed when the security/market faces high sell off initially but later the buyers tend to bring the price back up near its opening price.
- Four Price Doji:- As all the points of the candle (open,close, high, low) lie on the same point the Four price Doji is named as such. The Four Price Doji is an indication of high trade volumes taking place in the market.
The Doji generally represents that sellers and buyers cancel out each other and high ambiguity remains in the market (as shown in the picture above). The trend after Doji can either be bullish or bearish.
3. Rising Three Methods
The Rising Three Methods candlestick pattern appears during a Bullish trend. The pattern consists of 5 candlesticks that indicate the gradual increase in the price levels.

The gradual level increase is met with resistance causing the price to fall. Note that the price stays inside a particular range. The fall in prices is again broken by the greater buying demand. This causes the price to break the price range and continue the uptrend. The 5 features of the Rising Three Method Candlestick pattern are as given below:
- The initial and the last candlesticks of the pattern are Bullish in nature. They tend to indicate the trend of the price movement through their Bullishness.
- The second, third and the fourth candlesticks are Bearish. These candlesticks stay in between the high of the initial candle and the low of the final candle.
- The initial 4 candles tend to maintain a price range which is near to the middle of the body of the last candle.
- The strength of the breakout will be determined by the body of the final candle. A break out to a high price will happen if the body of the candle is large and vice versa
- The gap up between the 5th candle and the candle that follows determines the strength of the uptrend.
The uptrend will be maintained by the buying power.
4. Falling Three Methods
The Falling Three Method candlestick is the counterpart of the Rising Three Method candlestick pattern. Falling Three Method candlestick pattern appears during a Bearish trend.

The pattern consists of 5 candlesticks that indicate the gradual decrease in the price levels. The gradual level decrease is met with resistance causing the price to rise. Note that the price stays inside a particular range. The rise in prices is again broken by the greater selling demand. This causes the price to break the price range and continue the downtrend. The 5 features of the Falling Three Method Candlestick pattern are:
- The initial and the last candlesticks of the pattern are Bearish in nature. They tend to indicate the trend of the price movement through their slight Bearishness.
- The second, third and the fourth candlesticks are Bullish. These candlesticks stay in between the high of the initial candle and the low of the final candle.
- The initial 4 candles tend to maintain a price range which is near to the middle of the body of the last candle.
- A strong break out to lower prices happens if the candle’s body is large and vice versa.
The gap down between the 5th candle and the candle that follows determines the strength of the downtrend. The strength of the downtrend thus depends the gap down
These 4 patterns are the most commonly appearing ones that can be used in day trade. The other patterns are variations of the patterns discussed above. The proper understanding of the mentioned patterns will build a fundamental base for technical analysis
What Are the Most Powerful Single Candlestick Patterns?
The candlestick patterns that help predict the price movement with a single candlestick are referred to as Single candlestick patterns. The Single candlestick patterns are easy to read and spot. They are used to indicate market trend reversal. Identifying and using Single candlestick patterns forms the base of technical analysis. The 5 most powerful single candlestick patterns are the following:
- Doji: The classic Doji candlestick pattern appears at times of high buying and sell off taking place. The classic Doji has large upper and lower candlesticks and has its open near its close. The Doji signifies ambiguity in the market. The appearance of the Doji results in market reversal.
- DragonFly Doji: The DragonFly Doji pattern is a variation of the Doji pattern. The DragonFly Doji consists of a long lower shadow and a little or no upper shadow. The pattern consists of opening, close and high close to each other. The candle is formed when the security faces high sell off initially but later the buyers tend to bring the price back up near its opening price.
- GraveStone Doji: The GraveStone Doji pattern is another variation of the Doji pattern. This pattern is the counterpart of the DragonFly Doji. The pattern consists of a candle with an opening, closing and the low at the same place and has a large upper shadow. The upper shadow indicates how the buyers dominated initially but later lost control to the sellers.
- Spinning Top: The Spinning Top candlestick can appear for both Bullish and Bearish trends. The Spinning top candlestick is formed when the opening price is near the high. The pattern has a large gap between its high and low and a small gap between its opening and closing price. The Bullish Spinning Top appears at the end of a down trend and the Bearish spinning top appears at the end of an uptrend.
- The Hammer: The Hammer candlestick is referred to as a sign of trend reversal from Bearish to Bullish.The Bullish hammer pattern is formed at the end of a downtrend.The Bullish hammer gets its shape from the intense buying and selling action taking place in the market. The hammer is formed when a stock trades at a significantly lower price than its opening price and will have its close price nearer to its opening price at the end of a particular period/day.
The single candlestick pattern thus forms the foundation of candlestick patterns. Learning to recognize these patterns will help understand the condition of the market.
What is a 3-Method Bearish Formation?
The Three Method Bearish candlestick is also referred to as the Falling Three Method candlestick. The three methods refer to the change from Bullish to Bearish pattern. The pattern consists of 5 candlestick patterns. The initial and the final candlestick are Bearish candlesticks.

The price begins to fall initially. The falling in price is broken up with the Bulls over powering the Bears. The second, third and the fourth candlestick are Bullish candlesticks that trade inside the price range. The upward movement of the price is met with resistance in each level. The 5th Candlestick indicates the trend reversal. The Bears overtake the Bull from the 5th candlestick which indicates the down trend.
Is Candlestick Pattern Analysis effective?
Yes, the candlestick pattern analysis is the most effective way to interpret and predict the movement of the market. The candlestick pattern analysis method is the most commonly used method of all time in the stock market. The analysis of the candlestick pattern and its effectiveness is repeatedly proven as each pattern predicts a short term future movement. 25 most commonly used candlestick patterns will help predict the market movements 90 percent of the time. The efficiency of each candlestick pattern can be improved by using other technical tools and considering more variables. 
The prediction and the success rate of each candlesticks pattern is shown in the table above.
Do the Candlestick Patterns work?
Yes, the candlestick patterns do work. The greatest evidence that candlestick patterns work, is in its relevance to this day. The candlestick pattern methods are one of the oldest methods for analyzing and it is still used by traders. Candlestick patterns are not accurate down to the last detail till other factors and tools are considered. The candlestick pattern increases its efficiency if it is used with other technical tools of trading.
Is the Triple Top Bullish or Bearish?
The Triple Top candlestick is a pattern that signals a Bearish trend reversal. The pattern will start to form during a Bullish uptrend. The uptrend is met with resistance due to the sell off. The price will follow a small downtrend which will again rise to similar levels as the initial one. The same process is repeated two more times with the price being inside a particular range not being able to break out. The Bulls finally exhaust their buying power and let the Bears take over. This will result in the falling of the prices and the beginning of a down trend. Four of the key features to note in the Triple Top pattern are as follows:
- The pattern can only be confirmed after the price trades in between a particular price range 3 times.
- The high of the patterns for 3 times should be equal or close to each other inorder for the pattern to be identified as a Triple Top pattern
- The breakout from the price range will result in a trend reversal where heavy sell off will occur.
- The strength of the down trend will depend on the difference of the high and the lows of the price range the stock traded in. The stock would have greater downtrend If there was great difference between high and the low
The triple top pattern should be used with other technical tools to accurately measure the strength of the breakout.


 Previous Article


![15 Investing.com Alternatives [Free+Paid] You Should Use in 2026](https://www.strike.money/wp-content/uploads/2026/04/Investing.com-Alternatives.jpg "15 Investing.com Alternatives [Free+Paid] You Should Use in 2026 250")
![15 TradeStation Alternatives [Free+Paid] You Should Use in 2026](https://www.strike.money/wp-content/uploads/2026/04/TradeStation-Alternatives.jpg "15 TradeStation Alternatives [Free+Paid] You Should Use in 2026 251")
![15 Chartink Alternatives [Free+Paid] You Should Use in 2026](https://www.strike.money/wp-content/uploads/2026/04/Chartlink-Alternatives.jpg "15 Chartink Alternatives [Free+Paid] You Should Use in 2026 252")
: Overview, 10 Types of Indicators, Settings for Different Markets 254")

 : Definition, Formula, calculation, Uses, Advantages Vs limitations 256")


No Comments Yet.