Hanging man candlestick pattern appears when the confidence is highest and it is typically created after a strong upward run. Hanging Man candlestick pattern tells a quiet story of hesitation, where price falls sharply during the session, then buyers step in to push it back up again. This creates a small pause in upward momentum. It is taken as a warning signal of trend reversal by traders.
What is a Hanging Man?
Hanging man is the bearish reversal candlestick pattern used in technical analysis which appears at the end of uptrend signalling potential shift in market trend. It looks like a hanging figure with a small body at the top with a long lower shadow.
Structure of Hanging Man
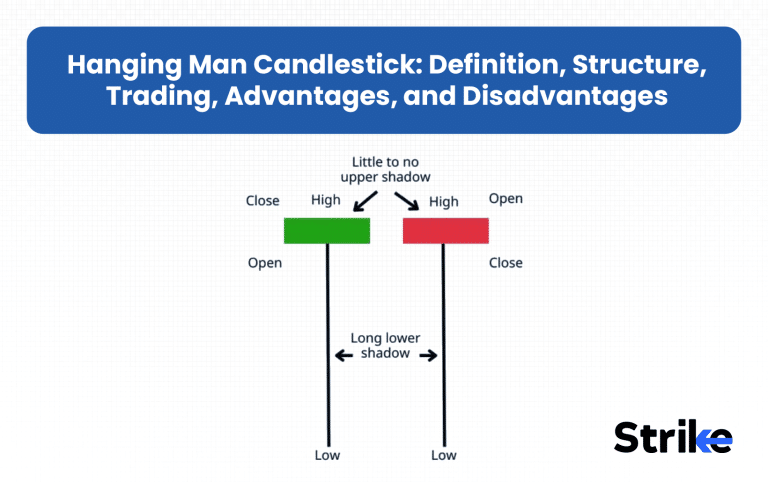
The structure of hanging man is characterized by three main distinct features. The features are a small real body, long lower shadow, and no upper shadow.

- Small Real Body: A small real body at the top of the candle, which can be either bullish (green) or bearish (red).
- Long Lower Shadow: It has a longer lower shadow that is typically twice the length of the real body. The lower shadow is the most crucial feature of Hanging Man, indicating that prices dropped significantly during the trading session but recovered somewhat by the close.
- No Upper shadow (or Very Small): A classic Hanging Man has little to no upper shadow suggesting price did not rise much above opening price during that particular trading session.
The color of the Hanging Man can be either red or green, but this colour difference is less important.
Psychology behind Hanging Man
The psychology behind Hanging Man represents a significant battle and potential shift in a market sentiment from bullish to bearish.
- Buyers initial control: The session starts with a strong uptrend with bulls boosting up price with confidence.
- Sellers Strike Back: During the session, a sharp selling pressure pushes the price downwards forming a long lower shadow. This negative trend shows the first true indication of weakness in the current upward trend.
- Buyers Try to Recover: As price drops to significant intraday low, buyers try to regain control in order to push price back to the opening level. This indicates that the bulls are still active but need high efforts to gain control again.
- Partial Recovery with Hidden Weakness: Even though the candle closed near open, the longer lower shadow shows shift in momentum.
Hanging Man shows a psychological shift from confidence to fear, shifting market sentiment from bullish to bearish.
Is the Hanging Man a Bullish or Bearish Pattern?
Hanging Man is a bearish candlestick pattern. It typically represents bearish reversal when it appears at the top of an uptrend, implying that buyers drove the price higher but sellers regained control. However, buyers managed to recover some ground by the close, but the intraday selling pressure reveals underlying weakness in the uptrend. Bearish reversal gets confirmed when the next candle closes below the body of Hanging Man.
What does Hanging Man Indicate?
A Hanging Man indicates that sellers are starting to gain strength after buyers initially dominate. Buyers initially tried pushing prices higher, but sellers gained significant control during the session, pushing prices down sharply.
The Hanging Man is usually interpreted by traders as an indication to tighten stop-loss, reduce long positions or to prepare in case of a potential down-trend, which is further reinforced after a verification by the next candle closing beneath the body of the Hanging Man.
Hanging Man in Uptrend Meaning
A Hanging Man in an uptrend means the ongoing bullish momentum is getting weak. Although the price closes towards the upper end, the extended lower shadow indicates a high selling pressure throughout the day. This indicates weakness in the up trend and is an indication that there is a potential of a bearish reversal, particularly when the next candle supports the lower close.

Hanging Man in Downtrend Meaning
A Hanging Man in downtrend is not actually a Hanging Man, in this context the same candle shape becomes Hammer Candlestick. This candlestick appears at the bottom of the downtrend and suggests bullish reversal.Hanging Man in down trend or Hammer candlestick’s lower wick shows price rejection from lower level,indicating buyers are gaining strength and weakening of downtrend momentum.

What does Red Hanging Man Candlestick Indicate?
A Red Hanging Man indicates that buyers tried to regain control after strong selling pressure, but the candle still closed below the opening price. This shows that even though bulls intervened, they were unable to completely defeat the sellers. It indicates a potential bearish reversal, but the next candle’s confirmation is essential to confirming the change in momentum.

What does Green Hanging Man Candlestick Mean?
A Green Hanging Man means that buyers successfully regained control after strong selling pressure. Price fell sharply during the session, but Bulls drove prices back up to close above the opening price. It still indicates bearish reversal if formed on top of uptrend. However, when it emerges in a downward trend, it becomes a hammer candlestick pattern and clearly indicates a possible bullish reversal and a change in sentiment from selling to buying.

Does the Color of Hanging Man Matter?
The color of a Hanging Man doesn’t matter much because its shape and position carry more significance than whether it’s red or green. The key message comes from a long lower shadow and close near the open.
However, a red Hanging Man indicates slightly stronger bearish sentiment, while a green Hanging Man suggests slightly stronger buyer presence and weaker bearishness.
What does Inverted Hanging Man Indicate?
The Inverted Hanging Man is not a well recognised candlestick pattern. The Inverted Hanging Man name changes to shooting star when it appears after an uptrend or Inverted Hammer when it appears after a downtrend.
- Shooting Star: A Shooting Star pattern also forms after an uptrend, but it is the inverse of the Hanging Man. Instead of a long lower shadow, the Shooting Star pattern has a long upper shadow and a small real body near the lower end, suggesting strong selling pressure and a potential bearish reversal.

- Inverted Hammer: An Inverted Hammer pattern appears after a downtrend and signals a potential bullish reversal. The Inverted Hammer pattern has a small real body near the lower end and a long upper shadow, indicating buyers pushed the price up during the session but were unable to sustain the momentum, showing emerging buying pressure.

How to Identify Hanging Man Candlestick in Technical Analysis?
To identify a Hanging Man candlestick in technical analysis, look for these key characteristics aligned with your criteria. The criteria includes body, upper shadow and lower shadow.
- The candle should have a small real body near the high of the candle. The colour of the candle can be green or red.
- The lower shadow should be significantly long, usually at least 2–3 times the size of the real body. This long lower shadow indicates that sellers pushed prices down sharply during the session.
- The upper shadow should be very small or absent, reflecting price didn’t move much to the upside during the session.
It must appear after an uptrend, because context is what turns this shape into a Hanging Man. In Stock market Technical Analysis, this recognition framework helps traders spot potential turning points in the market using precise candlestick structure criteria.
When does Hanging Man Candlestick occur?
A Hanging Man candlestick occurs at the end of the uptrend signalling potential reversal or pause before downtrend. It forms when prices open higher, then fall significantly during the session, creating a small real body near the top of the trading range with a long lower shadow at least twice the length of the body, and little to no upper shadow.
How often does Hanging Man Candlestick happen?
Hanging Man candlestick happens fairly often and less frequently, but its frequency and reliability heavily depends on timeframe and market context. A study by Candlescanner found that Hanging Man Candlestick appears3% of the time on daily charts of S&P 500 stocks. However, on shorter timeframe charts such as 5min and 15 min, it appears more frequently but with less reliability due to market volatility.
How to Trade with a Hanging Man in the Stock Market?
To trade the stock market with a Hanging Man, we have three main setups depending on the market context and position of the pattern. The setups are simple reversal at resistance, pull-back and continuation in downtrend and multi confluence reversal.
Setup A: Simple Reversal at Resistance
This setup involves identifying Hanging Man at resistance and planning a reversal trade.

- Entry: Identify the Hanging Man at resistance level and enter the trade once confirmation candle closes below the low of Hanging Man candle.
- Stop-loss: Place your stop-loss just above the Hanging Man candle.
- Target: Set target for prior swing low or use R-multiples (2R / 3R) for risk-based targets. You can also use 10 or 20 EMA to ride extended reversals.
Setup B: Pull-back and Continuation
This setup involves identifying Hanging Man during pullback and trading the trend continuation to the downside.

- Entry: Look for the Hanging Man forming at a falling 20-MA or 50-MA after a price pullback in a persistent downtrend; enter the trade on confirmation (such as a bearish candle closing below Hanging Man low).
- Stop-loss: Place your stoploss just above the Hanging Man candle or below moving averages.
- Target: Set R-multiples (2R / 3R) for risk-based targets or stay in trade until trend reverses. You can also use 10 or 20 EMA to ride extended reversals.
Setup C: Multi Confluence Reversal.
This setup involves multi confluence along with Hanging Man, such as strong resistance level, Fibonacci retracement area, RSI bearish divergence, and a volume spike.
- Entry: Use a staggered scale-in strategy i.e, entry partially in beginning and add on positions as confirmation grows.
- Stoploss: Just above the high confluence level or the Hanging Man high.
- Target: Take partial profits at intermediate support level and trail the remainder until trend reverses or closes above 10 or 20 EMA.

Mentioned above are the examples of bearish trade using Hanging Man.
What is an Example of a Hanging Man Candlestick used in Trading?
Lets understand the Hanging Man Candlestick using a real time example of stock Hero Motocorp.

As we can see, the stock was trading below the 200 day period moving average, signalling a bearish trend. On 17th September 2021, stock went to test its 200 day EMA and formed a Hanging Man candlestick pattern near 200 day EMA.
This signals that the stock took a pullback, tested its 200 day EMA, where 200 EMA is acting as an resistance. Formation of Hanging Man near resistance in a downtrend suggests stock will continue its downtrend.

As we can see the stock continued to test the same resistance level two more times, again forming a Hanging Man, making that resistance more strong. Price reversed sharply and continued its downtrend after it broke the previous low.
How to Confirm/Avoid False Signals for Hanging Man?
To confirm the Hanging Man and avoid false signals, traders should combine price action, volume, indicator readings, and confluence major support/resistance and trend structures.
- Based on Price: Wait for the next candle to close below the low of Hanging Man, showing genuine bearish interest. Also watch for breaks of structure, such as crossing below a minor support or previous swing low.
- Based on Volume: Ensure the volume should be more than an average volume on Hanging Man candle or confirmation candle. This high volume suggests institutional or strong participant interest.
- Based on Indicator: Use indicators for confirmation such as RSI crossing below 50, or MACD giving bearish crossover or price rejecting and forming Hanging Man from upper bollinger band.
- Confluence with technical level: Look if Hanging Man is supported by multiple technical factors, such as support, resistance, trendline, moving averages, Fibonacci retracement, or market breadth confirmation. These setups with multiple confluences have higher reliability.
By combining these confirmation signals, traders dramatically reduce the risk of false Hanging Man entries and improve the reliability of their setups.
How to Backtest the Success Rate of Hanging Man?
There are five major steps to backtest the success rate of Hanging Man. The steps are
1. Rules Definition
Start by defining the exact criteria for identifying a Hanging Man.
- Candle structure: Candles should have a small real body at the top of the candle with a long lower shadow at least 2× the body size and very small or no upper shadow.
- Context: It must appear after an uptrend(e.g., previous 3–5 candles bullish).
- Confirmation rule: Next candle must close below the Hanging Man low to trigger a sell signal. With stop loss above Hanging Man and take profit of 2R or trailing stop.
2. Datasets & Tools
Use backtesting platforms or coding tools suited for historical data testing:
- TradingView Pine Script: Easiest for visual strategy creation and forward validation.
- Python (pandas + Backtrader): For professional quantitative backtesting with custom rules and metrics.
- Amibroker: For fast historical scans and large dataset backtests.
You’ll need OHLCV data for your target asset (e.g., stocks, forex, crypto) across multiple timeframes.
3. Metrics to Report
After running the backtest, focus on key performance metrics to gauge pattern effectiveness:
- Win rate (%): Proportion of profitable trades.
- Average win/loss: Mean gain vs. mean loss per trade.
- Profit factor: Ratio of gross profit to gross loss (above 1.5 is solid).
- Expectancy: Average expected return per trade = (Win% × Avg Win) – (Loss% × Avg Loss).
- Max drawdown: Largest peak-to-trough equity drop.
- Average holding period: Helps identify if the pattern works better short-term or swing.
4. Regime Testing
Evaluate the pattern under different market regimes and conditions to understand consistency
- Market trends: Use moving averages or ADX filters to filter bullish, bearish, and sideways markets.
- Asset classes: Equities, forex, commodities, or crypto
- Timeframes: Test from 5-min to daily or weekly to see where reliability peaks.
This ensures the Hanging Man isn’t just curve-fitted to one condition.
5. Robustness Testing
Finally, validate the stability and reliability of your results
- Walk-forward testing: Re-train and test your parameters on new data segments.
- Out-of-sample (OOS) validation: Hold back part of your data to verify true predictive power.
- Parameter sensitivity: Adjust body/wick ratio thresholds to see if performance remains consistent.
Robustness checks prevent false confidence and reveal whether the Hanging Man’s edge holds across markets and timeframes.
How Accurate is the Hanging Man Candlestick in Technical Analysis?
The Hanging Man candlestick pattern accuracy is moderate in technical analysis and not highly reliable on its own. Its accuracy is largely context dependent like market conditions, period and corroboration by other indicators or price action.
According to the study by Stelian Olar, an author of the trading bible. The accuracy of Hanging Man candlestick in technical analysis without confirmation is 30% – 40%. However, its accuracy increases to 55% to 80% if confirmed by subsequent bearish price action.
The reliability of Hanging Man can be further improved by using other technical indicators like volume, RSI, or moving averages to confirm the Hanging Man.
What is the Best Timeframe to Trade using Hanging Man?
The best time frame to trade using Hanging Man is daily, weekly, 4-hour and 1-hour timeframes.
The reliability of trading Hanging Man increases with higher timeframe, because they filter out market noise and reflect a broader market consensus.
| Trading Style | Best Timeframe | Reliability | Ideal Use |
| Scalping | 5–15 min | Moderate | Short-term intraday reversals |
| Swing Trading | 1H – Daily | High | Trend reversals or pullbacks |
| Position Trading | Weekly – Monthly | Very High | Long-term bottoms or accumulation zones |
Daily and weekly charts are generally the best for the Hanging Man due to their stronger signals, but shorter intraday time frames can be used effectively with the right confirmations.
What are the Benefits vs Limitations of a Hanging Man?
The benefits and limitations of the Hanging Man Candlestick Pattern is mentioned below in the table.
| Benefits | Limitations |
| Early warning sign of buyer exhaustion | Not a reliable reversal signal without confirmation |
| Helps identify potential tops in an uptrend | Appears frequently → many false positives |
| Simple and easy to recognize visually | Strong uptrends can completely ignore the signal |
| Works well when combined with volume, resistance, or indicators | Loses meaning in sideways/weak trends or illiquid stocks |
| Reveals intraday selling pressure and weakening bullish momentum | The long lower wick alone doesn’t guarantee a reversal |
| Good tool for tightening stops or booking profits | Requires confluence; cannot be used as a standalone trigger |
While the Hanging Man is a valuable tool for spotting potential bearish reversals, traders should use it cautiously and always seek additional confirmation before making trading decisions.
How Effective is a Hanging Man Candlestick in Technical Analysis?
The effectiveness of Hanging Man candlestick in technical analysis is moderate, but not when used alone. Its reliability heavily depends on market context, such as different market conditions, timeframe, volume and other technical indicators.
In a study by Thomas Bulkowski in Encyclopedia of Candlestick Charts, price increases 59% of the time after forming Hanging Man candlestick pattern, indicating pattern fails without confirmation.
Where does a Hanging Man Candlestick Pattern is Commonly used?
The Hanging Man Candlestick Pattern is commonly used at the top of an uptrend, at resistance levels or supply zones and during a pullback in a downtrend.
- At the Top of an Uptrend (Bearish Reversal Zone): The Hanging Man is used at the top of an uptrend because it reflects a shift in momentum from buying to selling. After sustained buying pressure, this pattern shows that sellers are stepping in, signaling a possible trend reversal downward.
- At Resistance Levels or supply Zones: It is also applied by traders on resistance levels as it helps them to confirm that selling interest is coming back at a known strong price level. It graphically depicts that there is resistance which is holding, and traders are confident to go into short positions.
- During a Pullback in an Downtrend: It is applied in this region since it assists in determining the completion of a pullback in a higher bearish trend. The occurrence of the Hanging Man at the top of a pullback will indicate that sellers are taking over and traders will be able to join the downtrend once again.
- In Conjunction with Indicators: Traders use it alongside indicators to filter out false signals. When a Hanging Man aligns with bearish divergence, moving average support, or volume spikes, it confirms strong sellers intent, improving trade accuracy and confidence.
The Hanging Man is commonly applied at uptrend top, resistance zones, pullbacks in downtrend, and alongside technical indicators to improve trade accuracy and risk management.
What Candlestick Patterns are Similar to Hanging Man?
There are three candlestick patterns similar to Hanging Man. The patterns are Hammer, Inverted Hammer and shooting star.
- Hammer: Both have long lower shadows and a small real body at the top. The difference lies in the position of the candle in the trend. Hammer forms at the bottom of the trend suggesting buyers strength and bullish reversal, whereas Hanging Man forms at the top of uptrend suggesting selling strength and bearish reversal.
- Inverted Hammer: An Inverted Hammer appears after a downtrend and signals bullish reversal. It has a small real body near the lower end and long upper shadow, indicating buyers pushed price up during the session but were unable to sustain the momentum, showing potential buying pressure.
- Shooting Star: A Shooting Star also forms after an uptrend, but it is inverse of Hanging Man. Instead of long lower shadow, it has upper shadow and small real body near lower end suggesting strong selling pressure and bearish reversal.


 Previous Article


![15 Investing.com Alternatives [Free+Paid] You Should Use in 2026](https://www.strike.money/wp-content/uploads/2026/04/Investing.com-Alternatives.jpg "15 Investing.com Alternatives [Free+Paid] You Should Use in 2026 52")
![15 TradeStation Alternatives [Free+Paid] You Should Use in 2026](https://www.strike.money/wp-content/uploads/2026/04/TradeStation-Alternatives.jpg "15 TradeStation Alternatives [Free+Paid] You Should Use in 2026 53")
![15 Chartink Alternatives [Free+Paid] You Should Use in 2026](https://www.strike.money/wp-content/uploads/2026/04/Chartlink-Alternatives.jpg "15 Chartink Alternatives [Free+Paid] You Should Use in 2026 54")
: Overview, 10 Types of Indicators, Settings for Different Markets 55")


 : Definition, Formula, calculation, Uses, Advantages Vs limitations 58")


No Comments Yet.