A piercing pattern is a two-day candlestick price pattern that includes a trading range of average or greater size on the first day, with the opening near the high and the closing near the low. A piercing pattern indicates a potential short-term change from an upward trend to a downward trend. It closely resembles a bullish engulfing pattern, which is a two-candle pattern and has a similar appearance.
Steve Nison first defined the piercing candlestick pattern in his 1991 book, “Japanese Candlestick Charting Techniques.” The pattern is based on old-school Japanese candlestick charting methods from the 18th century.
What is a Piercing Line Candlestick?
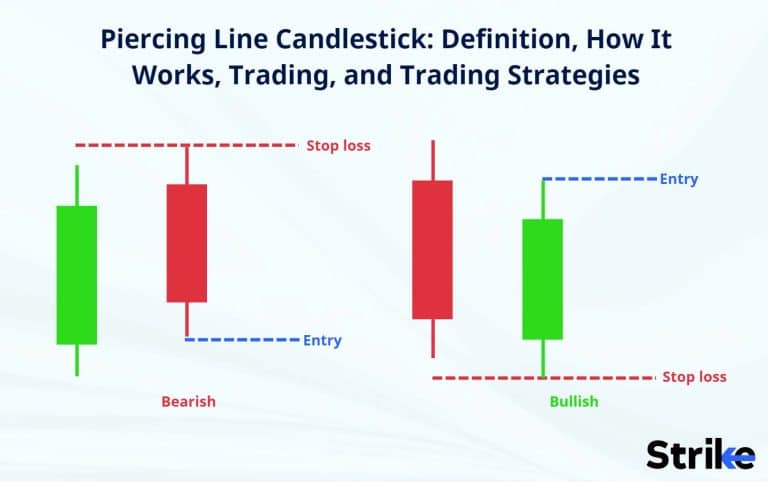
A piercing candlestick is a pattern used to spot possible price changes in the stock markets. A piercing candlestick consists of two candles, where the first candle is a long red/bearish candle, followed by a long green/bullish candle that opens below the previous day’s low. The green candle then closes above the midpoint of the previous day’s red candle, piercing it. The picture below depicts a piercing candlestick pattern.

A falling asset forms a long bearish candle that is then followed by a shorter bullish candle that closes above 50% of the bearish candlestick that came before it, forming a piercing candlestick pattern. The majority of traders use a visual method to choose whether to buy or sell the asset. The diagram below demonstrates how this pattern emerges.
This pattern indicates that buyers have gained control after a period of selling and is considered a bullish signal. Traders often use the piercing candlestick pattern along with other technical indicators to make trading decisions.
Bullish signs typically include the bulls’ rejection of the gap down. Even more bullish sentiment is added by the fact that bulls were able to push further up into the losses from the previous day. Bulls were successful in maintaining higher prices by reducing excess supply and raising demand.
What is the Psychology Behind the Piercing Line Candlestick Pattern?
The piercing line pattern psychologically represents a change in market mood from negative to bullish. A big drop in price and negative feelings are shown by the first day’s long red candle. Yet, the second day’s gap down offers optimistic traders a chance to enter the market at a discount. The positive sentiment intensifies as the price rises over the second day, and the closure above the midpoint of the actual body of the first day implies that buyers have taken control of the market. The piercing line pattern is frequently used by traders as a buy signal, signalling that the bearish trend may be coming to an end and a bullish trend may be beginning. Before making any trading decisions, traders should always double-check the pattern using other technical indicators and fundamental research.
What is an example of a Piercing Line Trading Strategy?
Let us look at an example of how to employ a piercing line trading strategy. Traders first search the market for a downward trend. They watch for a tiny bearish candlestick to appear once a downturn has been established. Then they search for a bullish candlestick that opens below the previous bearish candlestick’s low but closes above its midpoint. Traders that recognise this pattern open a long position at the bullish candlestick’s close and place a stop loss below the low of the preceding bearish candlestick. Traders finally take profits at a predetermined level, such as a resistance level or a Fibonacci retracement level. These tactics can help traders leverage the piercing candlestick pattern to potentially profit from market bullish reversals.
How to Identify Piercing Line Candlestick Patterns in Technical Analysis?
You must first confirm that the asset’s price is declining. The pattern you observe is not a piercing line if it is not. Second, there is a bearish candle on the left that frequently has a big body and little upper and lower shadows. Its length is an important consideration since this candlestick needs to be a little long. A bullish candle that closes roughly 50% higher than the preceding candlestick’s closure follows the bearish candle. There should be a tiny gap in this candle. This bullish candle typically opens lower than the other candlestick, as was demonstrated above.

The price closing above the bearish candle first informs them that the bearish trend is waning. The pattern alerts them to the impending beginning of a new bullish trend. Yet, when there is a false breakout pattern, it also alerts traders during technical analysis that there can be a negative continuation.
What Does the Piercing Line Candlestick Pattern Indicate to A Trader?
The Piercing Line pattern shows that the bulls are beginning to gain control and the bears are beginning to lose ground. The gap down between the first candlestick’s low and the second candlestick’s open creates a buying opportunity for traders who believe that the trend is reversing. The Piercing Line pattern can be used by traders as a signal to start long positions or close out short positions. Stop-loss orders must be placed to control risk in the event that the pattern does not result in the anticipated reversal.
How Should a Trader Reacts to Piercing Line Candlestick Pattern?
Traders may interpret it as a buy signal when a Piercing Line pattern appears on a price chart. The pattern suggests that the bulls have taken control after the selling pressure subsided. It’s crucial to keep in mind that no one indicator or pattern can ensure success, and every trade carries some degree of risk. Traders can take a few actions in response to a Piercing Line candlestick pattern. They must first confirm the validity of the pattern by making sure the second candle closes above the first candle’s midpoint. They should then think about the bigger picture of the market and search for additional signs or patterns that back up the bullish bias suggested by the Piercing Line pattern. Traders should control risk by placing stop-loss orders and analysing the trade’s risk-to-reward ratio. The trader may think about opening a long position if the Piercing Line pattern is verified and the market environment supports it. It is very important to keep a close eye on the price movement and be ready to close the position if the market turns against the trader after the trade has been placed. Traders can potentially profit while managing risk by using the Piercing line pattern by taking these actions.
Can you combine Indicators to Trade Piercing Line Candlestick Patterns?
Yes, using indicators along with the piercing line candlestick pattern can aid traders in making better trading decisions. The piercing line candlestick pattern is a bullish reversal pattern following a downtrend. It consists of two candles, the first of which is a long red candle and the second of which is a long green candle. Both candles open below the previous day’s low and close above the body’s midpoint. Traders frequently use indicators like the Moving Average Convergence Divergence (MACD) or Relative Strength Index (RSI) to confirm the potential reversal when trading this pattern. For example, this can add to the evidence that the trend is probably about to change if the RSI is oversold and starts to rise as the piercing line pattern develops. A potential trend reversal can be indicated if the MACD crosses above its signal line as the piercing line pattern develops.
Is the Stochastic Oscillator a good indicator to trade Piercing Line Candlestick Patterns?
No, a Stochastic Oscillator may not be the best indicator to use specifically for trading Piercing Line Candlestick Patterns, despite its usefulness in detecting overbought and oversold conditions. This is because the Stochastic Oscillator is better at spotting momentum and trend continuation, whereas the Piercing Line pattern is more of a trend reversal signal.
Is the Relative Strength Index (RSI) a good indicator to trade Piercing Line Candlestick Patterns?
No, the RSI should not be used as the sole basis for trading decisions, even though RSI can be used to confirm the strength of a Piercing Line pattern. You should take into account other elements like volume, trend lines, and levels of support and resistance.
What are the benefits of Pierce Line Candlestick Patterns?
The benefits of piercing line candlestick patterns is attributed to its simplicity, Listed below are three advantages of the pattern of piercing lines.
- Traders receive a clear signal from the piercing line pattern, which indicates that the market attitude may be shifting from pessimistic to bullish. This change in sentiment may indicate an opportunity for buyers. Traders can use this information to assist them to make more informed choices about when to enter or leave deals.
- The piercing line pattern is an indicator of a probable price reversal since it shows that the amount of selling pressure has diminished, which suggests that buyers may be stepping in and perhaps reversing the direction of the price.
- Traders frequently employ the piercing line pattern in conjunction with other technical indicators, such as moving averages or volume indicators, in order to confirm the possibility of a reversal and to boost the accuracy of their trades.
The piercing line pattern can be a helpful addition to a trader’s toolkit and can be an asset to the trader’s overall trading strategy when used with cautious risk management and in-depth study of the market backdrop,
What are the limitations of Pierce Line Candlestick Patterns?
Piercing line candlestick patterns have disadvantages despite their popular usage. Below are three main disadvantages to be noted.
- The piercing line candlestick pattern is only formed rarely. That makes the pattern much harder to anticipate.
- The piercing line candlestick pattern is not as effective as doji and morning star. The rate of false signals is higher compared to the mentioned patterns.
- Relying solely on piercing line patterns without considering other technical analysis tools or fundamental factors can lead to inaccurate trading decisions.
Many of the disadvantages of the pattern stem from its rarity. The best course of action is to not actively look out for it but rather take action when you see one.
Is a Piercing Line Candlestick Patterns Bullish or Bearish?
The Piercing Line candlestick pattern is viewed as a bullish reversal pattern. This pattern develops over the course of two days and is characterised by a long red candle on the first day, followed by a long green candle on the second day, with the green candle’s opening price being lower than the closing price of the first day and its closing price being higher than the midpoint of the first day.
Is Piercing Line Candlestick Patterns profitable?
Yes, trading using piercing line candlesticks is profitable. This pattern’s success is dependent on variables, including market conditions, timeframe, and other technical indicators. Piercing Line Candlestick Pattern traders should follow prudent risk management guidelines and make sure they have a clear trading strategy.


 Previous Article


![15 Investing.com Alternatives [Free+Paid] You Should Use in 2026](https://www.strike.money/wp-content/uploads/2026/04/Investing.com-Alternatives.jpg "15 Investing.com Alternatives [Free+Paid] You Should Use in 2026 28")
![15 TradeStation Alternatives [Free+Paid] You Should Use in 2026](https://www.strike.money/wp-content/uploads/2026/04/TradeStation-Alternatives.jpg "15 TradeStation Alternatives [Free+Paid] You Should Use in 2026 29")
![15 Chartink Alternatives [Free+Paid] You Should Use in 2026](https://www.strike.money/wp-content/uploads/2026/04/Chartlink-Alternatives.jpg "15 Chartink Alternatives [Free+Paid] You Should Use in 2026 30")
: Overview, 10 Types of Indicators, Settings for Different Markets 31")


 : Definition, Formula, calculation, Uses, Advantages Vs limitations 34")


No Comments Yet.