The dark cloud cover is a candlestick pattern that signals a momentum shift to bearish. The dark cloud cover appears mostly after a prolonged uptrend indicating a trend reversal to a downtrend. They show a particular security’s opening, closing, and high, and low prices over time.
The black cloud cover candlestick has the primary advantage of providing traders with an early indication to abandon long holdings or enter short positions, allowing them to capitalize on possible price decreases. One significant disadvantage of the dark cloud cover candlestick is that it can occasionally produce false signals, causing traders to make poor trading decisions.
The dark cloud cover occurs when a lengthy bullish candle is followed by a long bearish candle with closing below the previous candle’s midpoint. This pattern indicates that buyers were unable to maintain market power and that sellers have taken over, potentially resulting in a downward trend. This pattern is frequently used by traders as a signal to sell or enter short positions.
What is a Dark Cloud Cover Candlestick?
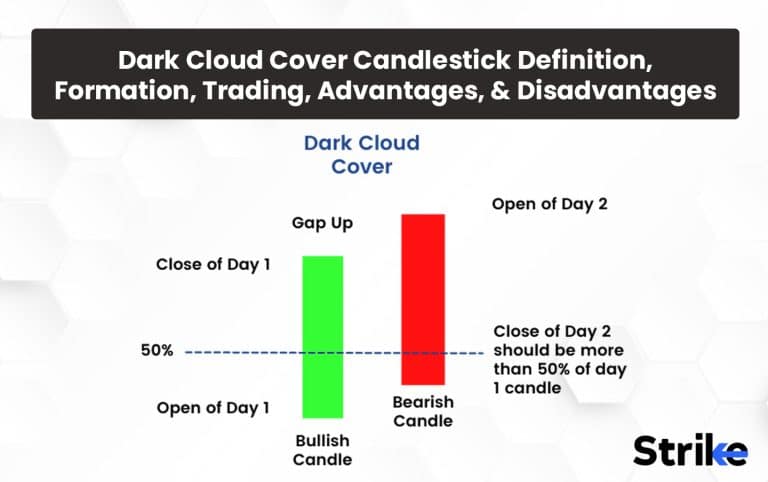
The Dark Cloud Cover candlestick pattern is a two-candle bearish reversal pattern that occurs at the end of a prolonged uptrend. The first candle is a lengthy bullish candle, showing that the market was in the hands of buyers. The second candle is a lengthy bearish candle that opens above the preceding candle’s high but closes below the previous candle’s middle, signaling that sellers have taken control of the market. Below is a pictorial representation of the candle.

The pattern consists of a lengthy bullish candle followed by a long bearish candle that opens above the previous candle’s high. The green candle is bullish and the red one is bearish in the above image. The second candle, however, closes below the previous candle’s midpoint, indicating a shift in market sentiment from optimistic to negative. This is the most important point that distinguishes dark cover candlestick from just two long bullish and bearish patterns appearing back to back. This pattern is frequently seen as a warning indication that the market is about to reverse from an uptrend to a decline but it sometimes occurs in non-trendy markets too. The applicability of trade signals in such situations is often thin.
The Dark Cloud Cover candlestick pattern is significant because it can provide traders with an early tip to abandon long positions or enter short positions. The pattern indicates that buyers were unable to maintain market power and that sellers have taken over. This pattern can be used as a signal for traders to sell or enter short positions, perhaps capitalizing on a downward trend.
How is a Dark Cloud Cover Candlestick Pattern created?
Traders seek for particular characteristics that distinguish the Dark Cloud Cover candlestick pattern from other patterns when identifying it. The dark cloud cover pattern is made up of two candles, the first of which should be a lengthy bullish candle, suggesting that buyers have won.

The second candle should be a lengthy bearish candle that opens above the preceding candle’s high but closes below the previous candle’s midpoint, indicating that the market has been taken over by sellers. Traders will recognize the Dark Cloud Cover candlestick pattern once these characteristics are identified.
When does the Candlestick Pattern of the Dark Cloud Cover appear?
The Dark Cloud Cover candlestick pattern appears following a market rise. It is a bearish reversal pattern that indicates that market sentiment is shifting from bullish to bearish. Look at the image below.

You can see here that the market is in a bullish trend in the beginning. The market turns bearish as soon as the dark cloud cover pattern appears.
The pattern is produced by two candles, the first of which is a long bullish candle and the second of which is a long bearish candle that starts above the previous candle’s high but closes below its midway. Traders often wait for the Dark Cloud Cover pattern to develop after an extended upswing, as it indicates that buyers are losing momentum and that a trend reversal is possible. The presence of the pattern may indicate a probable shift in market mood, allowing traders to sell or enter short positions.
How often does the Dark Cloud Cover Candlestick Pattern occur?
The occurrence of the Dark Cloud Cover candlestick pattern is determined by market conditions and the time frame under consideration. The pattern is a bearish reversal pattern that comes after an uptrend, and it indicates that market sentiment may be shifting from bullish to bearish. The pattern is more typical under volatile and uncertain market conditions with no obvious market direction. The pattern might serve as a clear indication for traders to change their trading tactics and safeguard their positions in such cases. The Dark Cloud Cover pattern may appear less frequently in stable and trending markets, as strong trends tend to last for a long time before reversing.
How to identify Dark Cloud Cover Candlestick Pattern in Technical Analysis?
Traders use specific steps to identify the Dark Cloud Cover candlestick pattern in technical analysis. Traders first look for an uptrend in the market to spot the pattern. They examine the first candle then, which should be a long bullish candle indicating buying pressure. They examine the second candle then, which should be a long bearish candle that opens above the high of the previous candle and closes below the midpoint of the first candle. The pattern is confirmed if the bearish candle closes below the previous day’s close. Refer to the image below.
Traders should also consider the length of the candles and the volume behind the pattern, as longer and more significant candles with higher trading volume can confirm the potential trend reversal.
What is the accuracy rate of Dark Cloud Cover Candlestick Pattern in Technical Analysis?
The accuracy rate of the Dark Cloud Cover candlestick pattern in technical analysis is generally considered to be reliable when it appears after an uptrend. But the accuracy can vary depending on the market conditions and other factors. Studies have shown that the reliability of the pattern increases when it is confirmed by other technical indicators, such as volume and momentum indicators. You should use the Dark Cloud Cover pattern as part of a larger technical analysis strategy, rather than relying on it as a standalone signal.
Is there a way to improve the accuracy of a Dark Cloud Cover Candlestick Pattern?
Yes, traders use four main tactics to improve the accuracy of a Dark Cloud Cover candlestick pattern in technical analysis. Use other technical indicators such as RSI, trade volume, or other pertinent indications to corroborate it to strengthen the pattern’s dependability. Another approach is to evaluate the larger market environment, as the pattern’s accuracy may be affected by market developments. Using several timeframes, such as daily and weekly charts, aid in confirming the pattern’s consistency. You can enhance your trading techniques by studying and backtesting the performance of the pattern in various market conditions in order to discover the most trustworthy setups.
What is the Success Rate of Dark Cloud Cover Candlestick Pattern?
The Dark Cloud Cover pattern is regarded as having a high success rate as a bearish reversal pattern, especially after a market rally. The pattern shows a transition from bullish to bearish momentum, and if corroborated by additional technical indicators and research tools, it can serve as a reliable tip for traders to enter a short position. But no trading method or pattern can predict market moves with absolute precision. The success rate of the Dark Cloud Cover pattern depends on variables such as market volatility, liquidity, and trader skill. You should always employ appropriate risk management measures, such as stop-loss orders, to safeguard trading funds and reduce potential losses.
How to Trade with a Dark Cloud Cover Candlestick Pattern in the Stock Market?
Trading with a dark cloud cover candlestick pattern is a simple three-step process. Below are the steps explained.
- The first thing to do is to identify the pattern. You are looking for a long bearish candle after a long bullish one. The image below is a pictorial representation.
- The second step is to confirm the trend with a technical indicator. You should use an indicator like RSI for this. You act on the trend when the indicator confirms what the patterns suggested.
- Dark cloud cover suggests a bearish market. You trade bearish markets mainly through shorting. Shorting is when you bet on the markets to fall. You may also exit your position (if you already had one) to avoid further loss.
It is ideal to consider the market conditions as well when trading with dark cloud candlesticks. The pattern could produce false signals in a choppy market or highly volatile market.
What is the Importance of Dark Cloud Cover Candlestick Pattern to Traders?
The Dark Cloud Cover candlestick pattern is important to traders because it can provide valuable information about potential market movements and help traders make informed trading decisions. The pattern is a bearish reversal pattern that appears after a strong uptrend and indicates a shift in momentum from bullish to bearish. This information is useful for traders who are looking to take a short position in the market or exit a long position.
The Dark Cloud Cover pattern provides traders with an opportunity for profit. Traders take a short position and potentially profit from the anticipated bearish movement in the market if the pattern is confirmed by other technical indicators and analysis techniques.
What Happens After a Dark Cloud Cover Candlestick Pattern?
The price is predicted to decline after a Dark Cloud Cover candlestick pattern, and traders place a short position in the market. This indicates that they want to sell the asset in the hopes of repurchasing it at a reduced price in the future and generating a profit. Traders may put a stop-loss order to limit their possible losses and a take-profit order to secure their potential winnings if the pattern is confirmed by additional technical indicators and analysis tools. They may also employ additional risk management approaches, such as position sizing and diversification.
The appearance of the pattern does not ensure that the price will decrease but only shows a probability. Traders should always employ appropriate risk management strategies and combine the pattern with other analysis approaches to establish the pattern’s reliability.
What Indicator is Best to Combine with Dark Cloud Cover Candlestick Pattern
Traders frequently employ momentum indicators or oscillators to confirm the trustworthiness of the Dark Cloud Cover candlestick pattern when combined with other technical indicators. The Relative Strength Index is a widely utilized indicator used with the Dark Cloud Cover pattern (RSI). RSI analyzes the strength of an asset’s price motion and helps traders spot overbought or oversold market conditions. The RSI in the overbought range and the Dark Cloud Cover pattern confirm the market’s impending bearish reversal.
Moving Averages, Volume Indicators, and MACD are other indicators that traders use to corroborate the Dark Cloud Cover pattern. Moving Averages assist traders in identifying the market’s trend, Volume Indicators in identifying the trend’s strength, and MACD in identifying the trend’s momentum.
Can you use Dark Cloud Cover Candlestick with RSI?
Yes, traders frequently use the RS) alongside the Dark Cloud Cover candlestick pattern to confirm the pattern’s trustworthiness and make informed trading decisions. The RSI analyzes the strength of an asset’s price motion and helps traders spot overbought or oversold market conditions. A potential bearish reversal in the market might be confirmed when the RSI is in the overbought range and the Dark Cloud Cover pattern develops,
The Dark Cloud Cover pattern emerging after an extended uptrend and the RSI is in the overbought range (over 70) indicates that the upswing is losing pace and that a probable negative reversal is likely.
Is it effective to use a Dark Cloud Cover Candlestick with MACD?
Yes, MACD is effective when used to confirm the direction of the trend in the market along with Dark cloud cover candlestick. The MACD line above the signal line is considered a bullish signal, indicating that the trend is up. The MACD line below the signal line is considered a bearish signal, indicating that the trend is down.
What is an example of a Dark Cloud Cover Candlestick Pattern used in Trading?
Below Dark Cloud Cover pattern used as a hypothetical example. A dark cloud cover pattern is determined when a bullish candle is followed by a bearish candle that starts above the preceding candle’s high but closes below its middle. Traders may examine additional technical indicators, such as the Relative Strength Index (RSI), Moving Averages, and Volume Indicators.

A trend is confirmed, if the RSI is in the overbought range and the Dark Cloud Cover pattern develops. Traders can enter a position, such as selling or shorting the asset once the pattern has been validated. Traders can set stop-loss and take-profit settings to limit risk. Watching the trade closely is essential for exiting if the price breaks above the high of the bearish candle, which could invalidate the pattern.
Is Dark Cloud Cover Candlestick Pattern Profitable?
Yes, the Dark Cloud Cover pattern can be profitable if used correctly. The pattern indicates a potential bearish reversal in the market and can be used to identify trading opportunities. However, it is important to confirm the pattern with other technical indicators and manage risk by setting stop-loss and take-profit levels.
Is a Dark Cloud Cover Candlestick Pattern a Bearish Reversal?
Yes, the Dark Cloud Cover candlestick pattern is a bearish reversal pattern. It occurs when a bullish candle is followed by a bearish candle that opens above the high of the previous candle but closes below the midpoint of the bullish candle. The pattern indicates that the bullish momentum in the market is weakening, and there is a potential for a bearish reversal.
What are the advantages of a Dark Cloud Cover Candlestick?
Dark Cloud Cover candlestick is particularly helpful in predicting downtrends. Below are four other main advantages of a dark cloud cover candlestick pattern.
Early entry levels: The occurrence of a dark cloud pattern at the start of a predicted downtrend results in attractive entry levels. Traders use the signal to short a stock or exit a trade.
Easy to identify: Traders may easily recognize dark cloud cover patterns. This makes it one of the easiest patterns for traders to identify and use. This factor makes it extremely easy to use for beginners as well.
Risk management: The formation of a Dark Cloud Cover pattern may signal a probable reversal if you are already in a long position, prompting you to consider taking profits or using risk management methods such as stop-loss orders.
Confirmation: The appearance of a dark cloud cover pattern can confirm other technical indicators or fundamental analyses that suggest a potential change in market sentiment, providing traders with added confidence in their analysis.
The Dark Cloud Cover pattern is useful for particularly those who are new to technical analysis. Its easy identification, early entry levels, risk management capabilities, and ability to confirm other technical indicators or fundamental analyses make it a valuable addition to any trader’s toolkit.
What are the disadvantages of a Dark Cloud Cover Candlestick?
The Dark Cloud Cover pattern is a useful tool for predicting market trends, but it is not foolproof. Below are their three main disadvantages.
False signals: The Dark Cloud Cover pattern can occasionally generate false signals. This can occur if the pattern is not corroborated by further technical or fundamental indications, causing traders who act on the signal to incur losses.
Doesn’t work on volatile markets: Dark Cloud Cover may be less trustworthy in highly volatile markets, as abrupt price swings may cause the pattern to emerge even when there is no genuine shift in market sentiment.
Lagging indicator: The Dark Cloud Cover pattern may not reveal information about a probable trend reversal until after it has already begun as it is a lagging indicator. Traders will need to combine the pattern with other indicators to gain a more full understanding of market developments.
Traders should be aware of the potential for false signals, the pattern’s lack of effectiveness in volatile markets, and its status as a lagging indicator for best results.
What are other Types of Candlestick besides Dark Cloud Cover?
Candlestick patterns are used to analyze market sentiment and predict future price movements. Below are five other types of candlestick patterns besides the Dark Cloud Cover.
Hammer: A bullish reversal pattern that has a long lower shadow and a small real body at the top of the candlestick.
Doji: A Doji pattern occurs when the opening and closing prices are almost the same, indicating indecision in the market.
Morning Star: A bullish reversal pattern that consists of three candles, with a long bearish candle, a small bearish or bullish candle, and a long bullish candle.
Shooting Star: Shooting star is a bearish reversal pattern that has a long upper shadow and a small real body at the bottom of the candlestick.
Bullish Engulfing: A bullish reversal pattern occurs when a small bearish candle is followed by a larger bullish candle that completely engulfs the previous bearish candle.
These are only a few examples of the plethora of candlestick patterns utilized in technical analysis. Each pattern possesses its own distinct qualities and can provide important insight into market patterns and prospective price moves.
Is Dark Cloud Cover Similar to Bearish Engulfing?
Despite the fact that both the Dark Cloud Cover and Bearish Engulfing candlestick patterns are bearish reversal patterns, there are significant variations between them. The Dark Cloud Cover pattern happens when a bullish candle is followed by a bearish candle that starts above the high of the previous candle but closes below its middle. The Bearish Engulfing pattern happens when a small bullish candle is followed by a larger bearish candle that totally engulfs the previous bullish candle. The Bearish Engulfing pattern is regarded as a stronger reversal indicator. The Bearish Engulfing pattern indicates a more dramatic shift from bullish to bearish momentum.
What is the difference between a Dark Cloud Cover Candlestick and a Piercing Line Candlestick?
The Dark Cloud Cover and Piercing Line candlestick patterns are two contrasting candlestick formations that suggest possible market reversals. The primary difference between the two patterns is their orientation and intensity. The Dark Cloud Cover pattern is a bearish reversal pattern. It comprises a bullish candle followed by a bearish candle that begins above the high of the preceding candle but closes below its middle. This pattern shows that the bullish momentum is waning, and a trend reversal is possible.
The Piercing Line pattern is a bullish reversal pattern that comes after a downturn. It comprises of a bearish candle followed by a bullish candle that opens below the low of the preceding candle but closes above its middle. This pattern implies that bearish momentum is diminishing and that a trend reversal is possible.


 Previous Article


![15 Investing.com Alternatives [Free+Paid] You Should Use in 2026](https://www.strike.money/wp-content/uploads/2026/04/Investing.com-Alternatives.jpg "15 Investing.com Alternatives [Free+Paid] You Should Use in 2026 40")
![15 TradeStation Alternatives [Free+Paid] You Should Use in 2026](https://www.strike.money/wp-content/uploads/2026/04/TradeStation-Alternatives.jpg "15 TradeStation Alternatives [Free+Paid] You Should Use in 2026 41")
![15 Chartink Alternatives [Free+Paid] You Should Use in 2026](https://www.strike.money/wp-content/uploads/2026/04/Chartlink-Alternatives.jpg "15 Chartink Alternatives [Free+Paid] You Should Use in 2026 42")
: Overview, 10 Types of Indicators, Settings for Different Markets 43")


 : Definition, Formula, calculation, Uses, Advantages Vs limitations 46")


No Comments Yet.