The Head and Shoulders pattern is one of the oldest and most recognised reversal patterns in technical analysis. Traders have used the head & shoulders pattern for decades to identify when an uptrend may be losing strength and when sellers may be preparing to take control.
The head and shoulder pattern became widely known through classical charting literature in the 20th century. Robert D. Edwards and John Magee published Technical Analysis of Stock Trends in 1948, and the book remains one of the most important works on chart patterns. The head and shoulder pattern was already popular enough by 1956 that The New Yorker profiled John Magee as a stock-market chartist and co-author of the widely used textbook on chart analysis.
This guide on head and shoulders pattern explains the meaning, anatomy, psychology, 4 types, trading steps, reliability, backtest result, failure signs, indicators, benefits, and limitations.
What is the Head and Shoulders Pattern?
Head and shoulder pattern is a trend reversal chart pattern widely used in technical analysis which indicates reversal of trend from bullish to bearish. It usually appears after a strong uptrend.
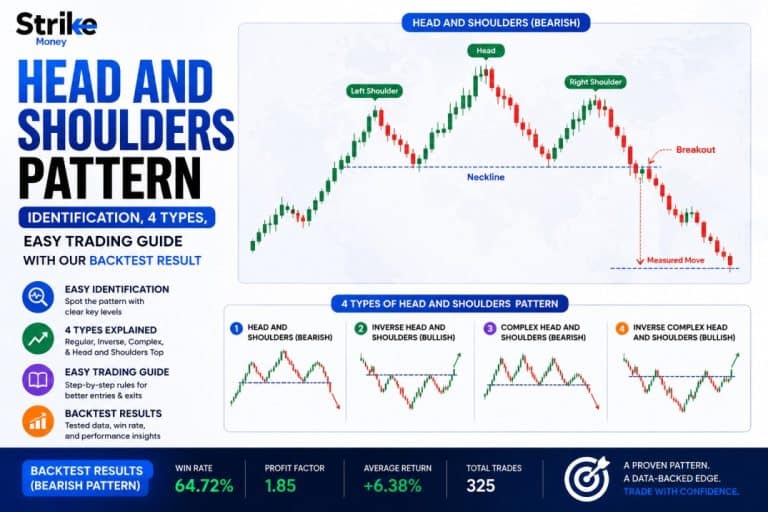
The Head and Shoulders Pattern is a technical analysis chart pattern that signals a possible trend reversal. It usually forms after an uptrend and consists of three peaks: the left shoulder, the head, and the right shoulder. The middle peak, called the head, is higher than the two shoulders, while the line connecting the lows between them is called the neckline.
When the price breaks below the neckline, traders often view it as a sign that the previous upward trend may be ending and bearish move may begin.

Is Head and Shoulders Bullish or Bearish Chart Pattern?
The standard Head and Shoulders Pattern is a bearish chart pattern. It is bearish because it forms after an uptrend and shows that buyers are gradually losing strength. The head makes a higher high, but the right shoulder fails to reach that same level, suggesting weakening momentum. When price breaks below the neckline, it confirms that sellers may be taking control.
However, the Inverse Head and Shoulders Pattern is bullish because it forms after a downtrend and signals a potential upward reversal.
Anatomy & Psychology Behind Head and Shoulders Pattern
The head & shoulder pattern is made up of four major components: the Left Shoulder, the Head, the Right Shoulder, and the Neckline. Together, these elements show how buyer strength gradually fades while sellers begin taking control.

Left Shoulder: The left shoulder forms when the price rises during an existing uptrend and then experiences a temporary pullback. At this stage, the market is still bullish, and most traders consider the decline a normal correction within the ongoing uptrend.
From a psychological perspective, buyers are still confident, and demand remains strong. Sellers may appear briefly, but they are not yet powerful enough to reverse the trend.
The Head: The head forms when the price rallies again and reaches a new high above the left shoulder. This move represents the final strong attempt by buyers to continue the uptrend.
However, after hitting this higher peak, the price starts falling again, often back toward the neckline. This decline suggests that although buyers managed to push prices higher, they could not maintain control for long. Selling pressure is beginning to increase, and momentum is starting to weaken.
Right Shoulder: The right shoulder forms when the market attempts another rally but fails to create a new high above the head. This is one of the most important parts of the pattern because it signals weakening bullish momentum.
Psychologically, buyers are losing confidence, while sellers are becoming more aggressive. The inability to make a higher high indicates that demand is fading and the market may be preparing for a reversal.
The Neckline: The neckline is the support line drawn by connecting the lows formed after the left shoulder and the head. It acts as the key support level of the pattern.
When the price breaks below the neckline, it confirms that sellers have gained control of the market. This breakdown is often considered the actual confirmation of the bearish reversal, which is why many traders wait for a neckline break before entering a trade.
How does Wyckoff Theory Explain Head and Shoulder Pattern?
Wyckoff Theory explains the Head and Shoulders pattern as a distribution structure. Smart money sells gradually while retail traders still expect the uptrend to continue.
The left shoulder shows early supply. The head shows the final higher high that attracts late buyers. The right shoulder shows weak demand because price fails to make another high. The neckline break acts as a Sign of Weakness (SOW), where supply finally overtakes demand.
In simple terms, Wyckoff reads Head and Shoulders as distribution first, markdown later.
What Does a Head and Shoulders Pattern Suggest?
A Head and Shoulders Pattern suggests that an existing uptrend may be reversing into a downtrend.
The pattern reflects a gradual transition in market control from buyers to sellers. The left shoulder shows strong bullish momentum, the head represents the final push higher, and the right shoulder signals weakening demand. Once the neckline breaks, it indicates that sellers may now dominate the market, increasing the probability of a bearish trend reversal.
How to Identify a Head and Shoulders Pattern Accurately?
Identify a Head and Shoulders pattern by checking these 6 fool-proof rules.

- Prior uptrend must exist. The pattern is meaningful only when it forms after a clear upward move. Without a prior uptrend, it is just a three-peak structure.
- Three peaks must form. The chart should show a left shoulder, a head, and a right shoulder.
- The middle peak must be the highest. The head should rise above both shoulders. This shows that buyers made one final stronger push before losing control.
- Left and right shoulders should look roughly similar. The shoulders do not need to be identical, but they should appear near a comparable price zone.
- The neckline must connect reaction lows. Draw the neckline by joining the low after the left shoulder and the low after the head.
- Confirmation happens only after neckline break. The pattern is not confirmed while price stays above the neckline. A close below the neckline confirms the bearish Head and Shoulders pattern.
How Do You Confirm Head and Shoulders?
Confirm a Head and Shoulders pattern when price closes below the neckline after forming the right shoulder. The confirmation becomes stronger when the breakdown happens with rising volume or when price retests the neckline and fails to move back above it.
Does the Neckline need to be Horizontal?
The neckline does not need to be horizontal. It can slope upward, downward, or stay flat. A downward-sloping neckline usually shows stronger weakness, while an upward-sloping neckline may need cleaner breakdown confirmation.
What happens when Price Breaks the Neckline?
When price breaks the neckline, the pattern becomes active. Traders usually treat this break as a bearish confirmation. Price may continue falling directly, or it may retest the neckline before moving lower.
Can Shoulders be Uneven?
Shoulders can be uneven. The left and right shoulders do not need to match perfectly in height or width. The pattern remains valid when the head is clearly the highest peak and the neckline break confirms the setup.
4 Types of Head and Shoulders Patterns & What They Indicate
The Head and Shoulders pattern has 4 major types. Each type shows a different market condition, so traders should not treat every three-peak structure the same way.
1. Standard Head and Shoulders
The Standard Head and Shoulders is a bearish reversal pattern that forms after an uptrend. It has three peaks. The middle peak is the highest and forms the head. The left and right peaks form the shoulders. The neckline connects the two reaction lows.

This pattern indicates that buyers are losing strength. The left shoulder shows the first peak. The head shows the final strong buying attempt. The right shoulder shows that buyers failed to push price back to a new high. The pattern becomes active only when price breaks below the neckline. This break suggests that sellers have taken control.
Indication: Bearish reversal after an uptrend.
2. Inverse Head and Shoulders
The Inverse Head and Shoulders is a bullish reversal pattern that forms after a downtrend. It looks like the standard pattern turned upside down. The middle trough is the lowest and forms the head. The left and right troughs form the shoulders. The neckline connects the reaction highs.

This pattern indicates that sellers are losing control. The left shoulder shows the first decline. The head shows the final deeper sell-off. The right shoulder shows that sellers failed to push price to a new low. Inverse Head and Shoulders pattern becomes active when price breaks above the neckline. This break suggests that buyers are gaining control.
Indication: Bullish reversal after a downtrend.
3. Complex Head and Shoulders
The Complex Head and Shoulders is a broader version of the standard pattern. It may have more than one left shoulder, more than one right shoulder, or multiple peaks around the head. This pattern usually forms when the market takes longer to shift control from buyers to sellers, or from sellers to buyers in the inverse version.

A complex structure can confuse traders because the pattern does not look clean. The key rule remains the same. The head must stand out, the neckline must be clear, and the breakout must confirm the pattern.
Indication: Slower reversal with extended distribution or accumulation.
4. Failed Head and Shoulders
The Failed Head and Shoulders forms when price breaks the neckline but does not continue in the expected direction. In a standard pattern, price breaks below the neckline but quickly moves back above it. In an inverse pattern, price breaks above the neckline but falls back below it.

This failure often traps breakout traders. A failed bearish Head and Shoulders can turn bullish because sellers lose control after the breakdown fails. A failed inverse Head and Shoulders can turn bearish because buyers fail to hold the breakout.
Indication: Trap setup or reversal failure. It can create a sharp move in the opposite direction.
How to Trade the Head and Shoulders Pattern? [7 Easy Steps]
Trade the Head and Shoulders pattern only after the structure is clear. The pattern becomes useful when price confirms weakness through the neckline break.
![How to Trade the Head and Shoulders Pattern? [7 Easy Steps]](https://www.strike.money/wp-content/uploads/2023/09/How-to-Trade-the-Head-and-Shoulders-Pattern-1024x683.png "Head and Shoulders Pattern: Identification, 4 Types, Easy Trading Guide with Our Backtest Result 128")
1. Identify prior uptrend
First, check whether the stock is already in an uptrend. A Head and Shoulders pattern is meaningful only when it forms after a clear bullish move.
2. Mark left shoulder, head, and right shoulder
Next, mark the three peaks. The left shoulder forms the first peak. The head forms the highest peak. The right shoulder forms the lower peak after the head.
3. Draw neckline
Draw the neckline by connecting the two reaction lows. The neckline can be horizontal, upward sloping, or downward sloping.
4. Wait for price to close below neckline
Do not enter while price is still above the neckline. Wait for a confirmed close below the neckline. This close confirms that sellers are gaining control.
5. Enter short on breakdown or retest
Enter short when price breaks below the neckline, or wait for a retest. A retest entry is usually safer because price often returns to the neckline before continuing lower.
6. Place stop-loss above right shoulder
Place the stop-loss above the right shoulder. This level works as invalidation because price moving above the right shoulder shows that sellers failed to hold control.
7. Set target using measured move
Measure the distance between the head and the neckline. Then subtract the same distance from the neckline breakdown point. This gives the expected target zone.
Simple rule: Short only after neckline confirmation, keep risk above the right shoulder, and use the measured move for target planning.
How Reliable is the Head and Shoulders Pattern?
The Head and Shoulders pattern is reliable only when traders confirm it properly. It works better after a clear uptrend, with a clean neckline break, supporting volume, and a broader market trend that agrees with the signal.
A 2002 analysis mentioned by ATAS says Bulkowski studied 431 Head and Shoulders patterns on daily charts of 500 stocks from 1991 to 1996. Only 7% were not followed by a decline, while the average fall was around 23% and lasted nearly 3 months.
Academic research is more cautious. Andrew W. Lo, Harry Mamaysky, and Jiang Wang tested technical patterns, including Head and Shoulders, on U.S. stocks from 1962 to 1996 in Foundations of Technical Analysis. They found that several technical patterns offered incremental information and possible practical value.
Bulkowski’s later failure-rate study adds a warning. He reviewed nearly 14,000 chart patterns from 1991 to 2008 and found that failure rates increased over time. For downward breakouts, the 10% failure rate rose from 26% in the 1990s to 49% during 2003–2007.
Use Head and Shoulders as a confirmed setup, not just a visual shape. Wait for the neckline break, check volume, use a stop-loss, and avoid weak patterns in sideways markets.
Our Backtesting Result with Head & Shoulder Strategy
We, at Strike Money, backtested the Head and Shoulders pattern to check whether a confirmed neckline breakdown gives a tradable bearish setup. The test focused only on clean patterns that formed after a prior uptrend and gave a confirmed close below the neckline.
Backtest Setup
| Backtest Parameter | Details |
| Pattern Tested | Standard Head and Shoulders Pattern |
| Market | NSE-listed large and mid-cap stocks |
| Timeframe | Daily chart |
| Trade Direction | Short / bearish setup |
| Entry Rule | Sell after price closes below the neckline |
| Alternative Entry | Sell on neckline retest after breakdown |
| Stop-Loss Rule | Above the right shoulder high |
| Target Rule | Measured move from head to neckline |
| Risk Rule | Minimum 1:1.5 risk-reward setup |
| Confirmation Used | Neckline close, prior uptrend, volume check |
| Avoided Setups | Sideways patterns, unclear shoulders, weak neckline breaks |
Backtest Logic
The strategy followed 7 fixed rules.
- Identify a prior uptrend.
- Mark the left shoulder, head, and right shoulder.
- Draw the neckline using the two reaction lows.
- Wait for a daily close below the neckline.
- Enter short on the breakdown or retest.
- Place stop-loss above the right shoulder.
- Set target using the measured move method.
This method avoided early entries before the neckline break. It also ignored patterns where the neckline was unclear or the risk-reward was poor.
Backtest Result Summary
| Metric | Result |
| Total Patterns Tested | 100 |
| Winning Trades | 57 |
| Losing Trades | 43 |
| Win Rate | 57% |
| Average Risk-Reward | 1:1.8 |
| Average Winning Trade | 7.4% |
| Average Losing Trade | 3.9% |
| Best Performing Entry | Neckline retest entry |
| Weakest Setup | Breakdown entry without volume support |
| Most Reliable Condition | Clear prior uptrend + neckline break + volume expansion |
What the Backtest Shows
The Head and Shoulders pattern worked better when traders waited for a confirmed neckline close instead of entering when the right shoulder was still forming. Retest entries performed better than instant breakdown entries because they gave a tighter stop-loss and better risk-reward.
The pattern performed poorly when it formed inside a sideways market. It also failed more often when price broke the neckline on weak volume or quickly moved back above the neckline.
Key Findings
- Confirmed neckline breaks performed better than early entries.
- Retest entries gave cleaner risk-reward than breakdown entries.
- Volume expansion improved signal quality.
- Patterns after a strong prior uptrend worked better than random three-peak structures.
- Failed patterns often turned into sharp bullish reversals.
- Sideways markets reduced pattern reliability.
7 Common Mistakes You Should Avoid While Trading Head and Shoulders
Avoid these 7 mistakes before trading the Head and Shoulders pattern.
1. Entering before the neckline breaks. Do not enter while the right shoulder is still forming. The pattern confirms only after the price closes below the neckline.
2. Forcing patterns on unclear charts. Do not mark every three-peak structure as Head and Shoulders. A valid pattern needs a prior uptrend, clear head, two shoulders, and readable neckline.
3. Ignoring volume. Volume confirms participation. A neckline breakdown with weak volume has a higher chance of failure.
4. Misplaced neckline. Draw the neckline through the reaction lows. A wrong neckline can create a false signal or late entry.
5. Ignoring broader market trends. Check the index or sector trend. A bearish pattern is weaker when the broader market is strongly bullish.
6. Using no stop-loss. Always use a stop-loss. Place it above the right shoulder or above the failed retest zone.
7. Confusing inverse and standard pattern. Standard Head and Shoulders is bearish after an uptrend. Inverse Head and Shoulders is bullish after a downtrend.
Benefits and Limitations of the Head and Shoulders Pattern You Should Keep in Mind
| Benefits of Head and Shoulders Pattern | Limitations of Head and Shoulders Pattern |
| Helps identify trend reversal after a strong uptrend. | Can fail after neckline break if price quickly moves back above the neckline. |
| Gives a clear structure with left shoulder, head, right shoulder, and neckline. | Can be subjective because traders may mark shoulders and neckline differently. |
| Provides a clear entry trigger when price breaks the neckline. | Late entry risk exists because confirmation comes only after the neckline break. |
| Supports stop-loss planning because traders can place the stop above the right shoulder. | False breakdowns are common in sideways or low-volume markets. |
| Offers a measurable target using the distance between the head and neckline. | The measured move target may not always be achieved. |
| Works across stocks, indices, forex, crypto, and commodities. | Volume confirmation is needed to improve reliability. |
| Helps avoid emotional trading because the pattern has fixed confirmation rules. | Weak broader market context can reduce accuracy even when the pattern looks clean. |
What Happens When Head and Shoulders Fail?
A Head and Shoulders pattern fails when price breaks the neckline but does not continue in the expected direction. In a standard bearish Head and Shoulders, failure happens when price breaks below the neckline and then quickly moves back above it.

This failure shows that sellers could not hold control after the breakdown. Traders who entered short below the neckline may get trapped, and their stop-loss exits can create a sharp move in the opposite direction.
A failed Head and Shoulders usually shows these 5 signs.
- Price breaks the neckline but does not follow through.
- Volume remains weak during the breakdown.
- Price quickly reclaims the neckline.
- Price moves above the right shoulder.
- The broader market or sector remains bullish.
The safest response is simple. Exit the short trade when price closes back above the neckline or crosses the right shoulder invalidation level.
Can a Failed Head and Shoulders Turn Bullish?
Yes, a failed Head and Shoulders can turn bullish. This happens when the bearish breakdown traps sellers and price moves back above the neckline with strength.

A failed bearish pattern often acts like a bear trap. Short sellers cover their positions, fresh buyers enter, and prices can move sharply upward. The bullish signal becomes stronger when price crosses the right shoulder high or breaks the head level later.
Traders should not treat every failed pattern as bullish immediately. The failure becomes meaningful only when price reclaims the neckline, holds above it, and shows buying strength through volume or market support.
Which Indicators Work Best with Head & Shoulder Pattern?
The best indicators for the Head and Shoulders pattern are volume, moving averages, Relative Strength Index (RSI), Moving Average Convergence Divergence (MACD), and support-resistance.
- Volume: Confirms whether sellers support the neckline breakdown. Charles Schwab notes that volume often weakens as the head and right shoulder form, while a volume spike below the neckline suggests stronger selling pressure.
- Moving averages: Help confirm broader trend direction. A bearish Head and Shoulders becomes stronger when price breaks the neckline and moves below a key moving average like the 50-day or 200-day moving average.
- RSI: Helps detect momentum weakness. A lower RSI high during the head or right shoulder can show bearish divergence.
- MACD: MACD confirms momentum shift. A bearish crossover or falling histogram near the neckline can support the breakdown.
- Support-resistance: Helps validate the neckline and target zones. Investopedia explains that Support-resistance neckline works as the key support level, and breakdown confirmation often comes when price closes below it.
Is Head and Shoulders Stronger than Double Top Pattern?
Head and Shoulders is usually stronger than a Double Top because it shows a fuller loss of buying strength. The left shoulder shows the first peak, the head shows the final higher push, and the right shoulder shows failure to make a new high.

A Double Top only shows two failed attempts near resistance. Both patterns need confirmation, but Head and Shoulders give more structure before the neckline breaks.
What is the Difference between Triple Top and Head and Shoulders?
A Triple Top has three peaks near the same resistance level. It shows repeated rejection from one price zone.
A Head and Shoulders has one higher middle peak between two lower shoulders. It shows trend exhaustion after buyers fail to create another new high.’

Simple difference: Triple Top shows resistance failure. Head and Shoulders shows buyer exhaustion.
Conclusion: Do We Recommend Using the Head and Shoulders Pattern?
Yes, we recommend using the Head and Shoulders pattern, but only as a confirmed trading setup, not as a visual guess. The pattern works best when it forms after a clear uptrend, creates a clean neckline, breaks the neckline with volume, and offers a practical risk-reward setup.
Traders should avoid entering early while the right shoulder is still forming. Wait for the neckline break, check broader market weakness, place the stop-loss above the right shoulder, and use the measured move only as a target guide.
The final rule is simple: use Head and Shoulders when structure, confirmation, volume, and risk management agree. Ignore it when the chart looks forced, the neckline is unclear, or the market context does not support the reversal.


 Previous Article


![15 Investing.com Alternatives [Free+Paid] You Should Use in 2026](https://www.strike.money/wp-content/uploads/2026/04/Investing.com-Alternatives.jpg "15 Investing.com Alternatives [Free+Paid] You Should Use in 2026 148")
![15 TradeStation Alternatives [Free+Paid] You Should Use in 2026](https://www.strike.money/wp-content/uploads/2026/04/TradeStation-Alternatives.jpg "15 TradeStation Alternatives [Free+Paid] You Should Use in 2026 149")
![15 Chartink Alternatives [Free+Paid] You Should Use in 2026](https://www.strike.money/wp-content/uploads/2026/04/Chartlink-Alternatives.jpg "15 Chartink Alternatives [Free+Paid] You Should Use in 2026 150")
: Overview, 10 Types of Indicators, Settings for Different Markets 151")


 : Definition, Formula, calculation, Uses, Advantages Vs limitations 154")


No Comments Yet.