An Inverse Head and Shoulder Pattern is a reversal chart pattern that is seen when a security’s price falls. An Inverse Head and Shoulder Pattern is also called a “Head and Shoulders Bottom” in a reversal chart pattern. An inverse head and shoulder pattern is similar to the standard head and shoulder patterns except it is inverted, and it also indicates a bullish trend reversal upon completion.
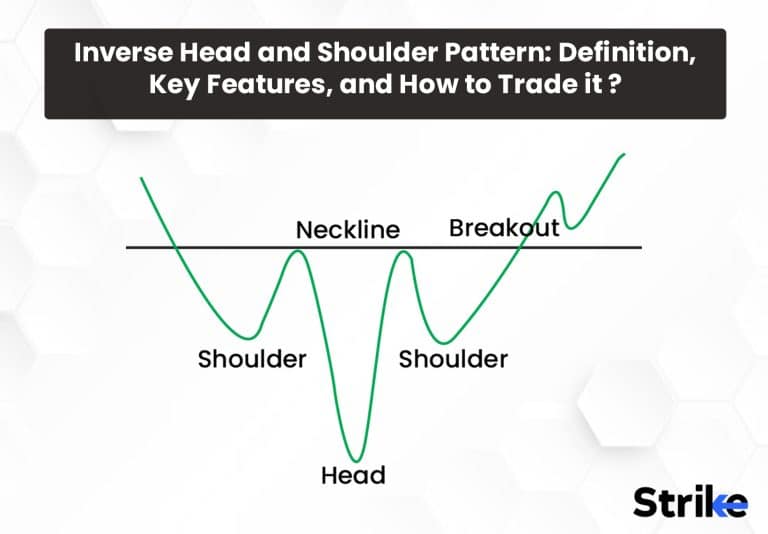
It is characterized by the following key features: The inverse head and shoulders only forms after a prolonged downtrend, marked by lower lows and lower highs. The left shoulder represents the first lower high after the initial drop. The head is the lowest point of the pattern which is lower than the two shoulders, reflecting bears’ strength. The right shoulder forms after the head marking another lower high. It is usually in line with or slightly below the left shoulder. The neckline connects the lowest point of the left and right shoulders.
The inverse head and shoulders pattern is complete when the price breaks above the neckline after forming the right shoulder. The breakout signals a trend reversal from down to up.
To trade this pattern, one should wait for a confirmed break and close above the neckline. Place entry order just above neckline or on throwback to neckline. Keep stop loss below the right shoulder. Target minimum move equal to height of pattern measured from head to neckline.
The inverse head and shoulders signals exhaustion among sellers. Trading the pattern in the direction of the breakout offers a high probability reversal setup.
What does Inverse head and Shoulders Pattern indicate in Technical Analysis?
Inverse head and shoulders is a price pattern in technical analysis that indicates a potential reversal from a downtrend to an uptrend. The pattern is similar to the shape of a person’s head and two shoulders in an inverted position, with three consistent lows and peaks. The person’s head is represented as three successive lows, with the middle low being the deepest in a technical chart pattern, and the two shoulders are represented with two outside lows being shallower in the technical chart pattern. The two shoulders are of equal height and width in technical analysis. The pattern identifies a potential reversal in a downtrend, which indicates a possible bullish trend.

The pattern in technical analysis indicates a potential change in the asset or security direction, signalling a positive outlook for future price movements. Traders and investors consider this price pattern in technical analysis as a bullish reversal signal.
What is the other term for Inverse head and Shoulder Pattern?
Another term for Inverse Head and Shoulder Pattern is Head and Shoulder Bottom. An inverse head and shoulders bottom is similar to the standard head and shoulders pattern, but it is inverted. The inverse head and shoulder pattern can also be called reverse head and shoulders.
The head and shoulder bottom, or reverse head and shoulders, occurs after a downtrend and signals a potential reversal to the upside. The inverse head and shoulder pattern is considered a bullish reversal pattern.
How significant is the inverse Head and Shoulders Pattern in Technical analysis?
An inverse head and shoulder pattern is significant in technical analysis as it indicates a bullish trend reversal. An inverse head and shoulder pattern starts with a downtrend and, upon completion, signals a bullish trend reversal. The price starts moving upwards after the breakout, which provides the traders with a lot of buying opportunities. It also changes market sentiment. An inverse head and shoulder pattern also provides necessary insights and potential trend reversal information that helps traders and investors to invest and manage risks.
How does an inverse head and shoulder pattern work?
The inverse head and shoulder pattern is a popular tool among traders and is used in technical analysis to predict price trends in financial markets. Traders use it to identify potential reversals in downtrends and to determine market entry and exit points.
The components of an inverse head and shoulders pattern are three troughs and peaks. The first and third troughs are smaller and form the shoulders. The second trough is the deepest and forms the head of the pattern. The troughs are connected by downward-sloping trend lines, which will form the neckline. This is an important part of the pattern. A bullish signal is considered by the traders when the security price rises and breaks above the neckline. This indicates a potential reversal of the prior downtrend. The pattern can provide valuable information to traders and investors when making investment decisions.

The inverse head and shoulders pattern begins with a downtrend. This is the extended move down that eventually leads to exhaustion and a reversal higher as sellers exit and buyers step up. This downtrend faces minor support, which forms the first shoulder. The market begins to move higher, but it bounces off strong resistance, and the downtrend resumes. This resistance level forms what is called the neckline.
The inverse head and shoulder finds strong support after the market makes a lower low, which forms the head of the pattern. The market finds resistance at the neckline once more, which leads to the formation of the second shoulder. This is the point where the inverse head and shoulders pattern is taking shape, but the pattern hasn’t been confirmed just yet.
The pattern is only confirmed when the price breaks above the neckline, and this is called a breakout.
What are the key features of the inverse Head and Shoulders Pattern?
The inverse head and shoulders pattern is a chart pattern in technical analysis that provide valuable insights like the highs and lows of the market.There are 5 main key features of the inverse head and shoulders pattern.
- Head and shoulders: The most important feature in the inverse head and shoulder are the highs and lows. There is a left and right shoulder, along with the head, in the formation of the inverse head and shoulder. The left shoulder is the first trough that forms the new low in the current trend. The market then rises again to break at the resistance level. The second trough forms a new low that is lower than the first one. This is called the head. Sometimes the high in the rise also breaks the downtrend line. The third low ends above the second low, creating the right shoulders. It is usually in the line of the left shoulder or symmetrical. Symmetry is usually preferred, but it is not guaranteed. The formation is complete when the right shoulder breaks through the neckline.
- Resistance: Resistance is also known as the neckline. The neckline is a line that joins both highs.The neckline acts as a resistance level that needs to be broken for confirmation of the pattern.The first high is a point that marks the end of the left shoulder rise and the beginning of the head. The next high point is where the head ends and the right shoulder begins.
- Volume: Volume is a key feature to confirm the trend reversal. The expansion of the volume is not an important feature in the head and shoulders pattern, but it is a key characteristic of the inverse formation. The reversal pattern cannot be confirmed without the expansion of volume. The volume is higher during the formation of the left and right shoulders. Then the volume decreases during the formation of the head.
- Support line: The support line is also known as the trend line. The new support line forms when the resistance line is broken. The pattern only completes when the trendline breaks the neckline, which makes it a key feature. The price usually drops to the support line in an uptrend, which gives traders the opportunity to buy again.
- Price Target: The price or profit target are easily calculated by traders using the inverse head and shoulders pattern. It is calculated by measuring the gap between the head and the neckline. This is placed against the opposite side of the neckline in an uptrend to set a profit target.
These are the 5 features that help the traders identify an inverse head and shoulder pattern. This provides valuable insights that help the traders make the right trading decisions. As with any chart pattern, sound analysis is required to validate the formation and manage risk. When traded well, the inverse head and shoulders can capture significant upside moves.
How does an inverse head and shoulder pattern form?
The inverse head and shoulder pattern starts with a downtrend. This is characterised by lows and highs. The price moves downward, and it hits a low point called a trough. The market slowly recovers and swings upward. Market resistance pushes it back down, and it forms another trough. The price drops in the market to a point where the market can’t support it, which leads to the price rising again. The price falls once more, but not as low as the previous one. This creates the three troughs or lows, namely the left shoulder, head, and right shoulder.
The left shoulder is formed when the price reaches a low point and starts to rise. The head is formed after the formation of the left shoulder. This is the point where the price drops to a point where the market can’t support it. The right shoulder is formed after this, and the price decreases again but not as low as the head.
The neckline is also known as the trendline, which connects the shoulders and acts as the market resistance. This line has to be broken for the trend to be confirmed, and it is called a breakout. The breakout indicates a trend reversal.
How to identify an Inverse Head and Shoulders Pattern on the price chart?
Identifying an inverse head and shoulder pattern is a key skill for traders that signal potential trend reversals. An Inverse Head and shoulder pattern is identified on the price pattern by observing 6 main features.
- Downtrend: An inverse head and shoulder pattern starts with a downward trend. It is considered by traders as a trend reversal indicator. This is identified by the highs and lows in a price chart.
- Left Shoulder: The left shoulder is a point where the price falls and slowly starts to rise.
- Head: The head is a point where the price falls again to a point lower than the left shoulder. This is formed after the left shoulder. The price slowly rises again after this fall.
- Right Shoulder: The right shoulder is a point where the price falls again, but not as low as the head. The price slowly rises again.
- Breakout: The inverse head and shoulder pattern has a trendline or neckline that connects the two shoulders. This has to be broken in order to confirm the pattern. This also signals a bullish reversal.
- Volume: The volume is higher during the breakout. The volume is also used to identify the inverse head and shoulder pattern. The volume is higher during the formation of the left shoulder and right shoulder, and then the volume decreases during the formation of the head.
These are the major features used to identify the inverse head and shoulder pattern. Traders and investors should avoid depending only on identification as an indicator and use other indicators before trading and investing to confirm the pattern.
What happens after an inverse head and shoulder breakout?
The next phase after an inverse head and shoulder pattern can vary depending on factors like market sentiment,volume and liquidity and other technical factors. The next phase after a breakout is an upward move in the price pattern. The rise in prices will provide more buying opportunities. The breakout also indicates a bullish trend reversal. Another outcome is when the breakout does not occur. The price reaches the trendline, but it does not increase higher in this case. This leads to a downtrend reversal. The price can also stay at the neckline without an upward or downward trend reversal. This is also considered a bullish reversal, as there is no fall in the price.
What are the strengths of an inverse head and shoulder pattern?
The strengths of an inverse head and shoulder pattern help with the trading strategy as they provide the necessary key information. There are 5 strengths of an inverse head and shoulder pattern.
- Indicator for trend reversal: The Inverse head and shoulder pattern is considered a clear indicator by traders and investors. The breakout acts as a trend reversal, indicating that the downtrend is reversing. The head and shoulder pattern is considered a reliable bullish reversal pattern.
- Price or Profit Target: The inverse head and shoulder pattern is used by traders to set their profits. The price or profit target is easily calculated by traders using the inverse head and shoulders pattern. It is calculated by measuring the gap between the head and the neckline. This is placed against the opposite side of the neckline in an uptrend to set a profit target.
- Volume expansion: The volume increases during the breakout in a head and shoulder pattern. A trend reversal can only be confirmed by the traders if the volume increases. The volume also indicates the buying interest of the traders.Higher volume increases the reliability of the pattern which provides more buying opportunities for traders.
- Market Sentiment: The market sentiment changes from bearish to bullish in an inverse head and shoulder pattern. This helps to increase the buying interest of the traders and creates a shift in favour of the bulls.
- Timeframes: Trading an inverse head and shoulder patterns done in any time frame, depending on the preference of the trader. The different timeframes are intraday, four hour, monthly charts etc.
These 5 strengths help the traders and technical analysts use an inverse head and shoulder pattern in the right way to make informed trading decisions. As with any chart pattern, sound analysis is required to validate the formation and manage risk. When traded well, the inverse head and shoulders can capture significant upside moves.
What are the weaknesses of an inverse head and shoulder pattern?
The weakness of an inverse head and shoulder pattern help with improving the trading strategy. There are 5 weaknesses of an inverse head and shoulder pattern.
- False Breakouts: The breakouts from an inverse head and shoulder pattern is false at times. The market goes back to a downtrend if the upward momentum does not continue. This can affect traders and investors.
- Observing the volume: It is important that the traders observe the volume carefully before confirming the trend reversal. The reversal pattern cannot be confirmed without the expansion of volume. The volume is manipulative and it is necessary that volume analysis is done along with technical factors and market conditions.
- Market volatility: Market volatility can affect price movement. This leads to false breakouts and can affect the inverse head and shoulder pattern. This makes it hard for the traders to rely on the inverse head and shoulders pattern for decision making.
- Ambiguity: The formation of the head and shoulders pattern is unclear in the price chart. The neckline is unclear, and the pattern lacks symmetry. This makes it difficult for the traders to identify an inverse head-and-shoulders pattern.
- Multiple Indicators: Identification of a trend reversal is not the only aspect to consider before investing in an inverse head and shoulder pattern. It is important to confirm an inverse head and shoulder pattern from indicators like Exponential Moving Average (EMA) and Fibonacci Retracement.
These 5 weaknesses help the traders and technical analysts use an inverse head and shoulder pattern in the right way as they provide the necessary information to make an informed trading decision. As with any chart pattern, sound analysis is required to validate the formation and manage risk. When traded well, the inverse head and shoulders can capture significant upside moves.
How to trade an inverse head and shoulder pattern?
Trading an inverse head and shoulder pattern the right way is important as it helps with fixing a profit target. An inverse head and shoulder pattern is traded using 6 methods.

- Identify the Pattern: The first step is to identify the pattern. An inverse head and shoulder pattern starts with a downward trend. It is considered by traders as a trend reversal indicator. This is identified by the highs and lows in a price chart. There are three troughs or lows, namely the left shoulder, head, and right shoulder which is used to identify the pattern further.
- The Neckline: The next step after the identification of the pattern is to draw a neckline by connecting the two highs between the shoulders and the head. The neckline is also known as the trendline, and it acts as the market’s resistance.
- The Breakout: The next step is to wait for the price to break above the neckline. The trendline, or neckline, that connects the two shoulders has to be broken in order to confirm the pattern. This process is called a breakout. This also signals a bullish reversal.
- Determine the Entry Point: The next step is to determine the entry point . The entry point is determined when the price breaks above the neckline and reaches a certain level of confirmation. The traders enter a long position at this point.
- Setting up a stop-loss order: A stop-loss order is set below the neckline or the pattern’s low. A stop-loss is a type of order that investors or traders use to limit their potential losses in the stock market. It works by automatically selling a security when its price reaches a certain level, known as the stop price. This helps traders avoid larger losses if the price of the security continues to drop.
- Profit Target: The price or profit target can be easily calculated by traders using the inverse head and shoulders pattern. It is calculated by measuring the gap between the head and the neckline. This is placed against the opposite side of the neckline in an uptrend to set a profit target.
These 6 methods provide the traders with necessary information to identify the pattern and set targets.
What is the best time frame to trade an inverse head and shoulders pattern?
There is no specific time frame for trading an inverse head and shoulders pattern. The trader can choose the time frame depending on his preference. There are timeframes, like intraday charts, daily charts, weekly charts, and monthly charts which are used depending on the trading style of the trader. The trader can use any time frame to trade an inverse head and shoulders pattern.
What is the best way to trade an inverse head and shoulders pattern?
The best way to trade an inverse head and shoulder pattern is to start by identifying the left shoulder, head, and right shoulder. The next step is to determine an entry point based on the distance from the neckline to the head. Traders enter the long position at this point and place a stop-loss order. The profit target is decided by the traders by measuring the gap between the head and the neckline.
Is it a good idea to trade an Inverse Head and Shoulders Pattern with Exponential Moving Average (EMA)?
Yes, it is a good idea to trade an inverse head and shoulder pattern with Exponential Moving Average (EMA).
Exponential moving averages (EMAs) are designed to see price trends over specific time frames, such as 50 or 200 days. This helps the trader select the best time frame to trade an inverse head and shoulder pattern.
Is it worth it to trade an Inverse Head and Shoulders Pattern with Fibonacci Retracement?
Yes, it is worth it to trade an Inverse Head and Shoulders Pattern with Fibonacci Retracement.
Fibonacci retracement levels also connect any two points that the trader views as relevant, typically a high point and a low point. This can be used by traders to connect the highs and lows in an inverse head and shoulder pattern.
Is the Inverse Head and Shoulders Pattern also used to Trade in the Stock Market?
Yes, the Inverse Head and Shoulders Pattern is also used to trade in the stock market. The pattern is a bullish reversal pattern that can also indicate a potential trend reversal from a downtrend to an uptrend.
Is Inverse Head and Shoulders Pattern Bullish or Bearish?
The Inverse Head and Shoulders Pattern indicates a bullish trend reversal pattern. The Inverse Head and Shoulders Pattern signals the end of a bearish phase and the onset of an upward trend. An inverse head and shoulders pattern predicts a bearish-to-bullish trend. It starts with a downward trend that is bearish. The completion of the Inverse Head and Shoulders Pattern indicates a bullish trend.
How reliable is the Inverse Head and Shoulders Pattern?
The inverse head and shoulders pattern is generally considered to be a reliable bullish reversal pattern. It is used by traders and analysts to provide valuable insights on potential trend reversals. The reliability of the inverse head and shoulders pattern also depends on factors such as market conditions, historical trend analysis, and technical indicators.
What volume to use for Inverse Head and Shoulders?
There is no specific volume for an inverse head and shoulders pattern. The trend reversal pattern cannot be confirmed without the expansion of volume. The volume is higher during the formation of the left and right shoulders. Then the volume decreases during the formation of the head. The volume also increases during the breakout, and the trend reversal is not confirmed until it increases.
What is an example of an Inverse Head and Shoulders Pattern in Trading?
The inverse head and shoulder pattern starts in a downtrend with the formation of a left shoulder, the head, and the right shoulder. Here is an example of an inverse head and shoulder pattern in a price chart.

An inverse head and shoulder pattern starts with a downward trend which can be identified by the highs and lows in a price chart. The left shoulder is denoted with L. The left shoulder is the point where the price falls and slowly starts to rise. The head is denoted with H. The head is the point where the price falls again to a point lower than the left shoulder as shown in the image.The price slowly starts to rise again after this fall. The right shoulder is denoted with R. The right shoulder is the point where the price falls again, but not as low as the head. The price slowly rises again.
A neckline is a line drawn by connecting the two highs between the shoulders and the head as shown in the image. It acts as the market’s resistance here.
An inverse head and shoulder pattern is confirmed when the price moves above the neckline and it keeps getting higher. The price then breaks above the neckline and signals a bullish reversal.
Can Inverse Head and Shoulders Patterns forecast market trends?
No, an inverse head and shoulders pattern does not forecast market trends. An inverse head and shoulders pattern can only indicate trend reversals from downward to upward and provide valuable insights into trends.
What are some common mistakes Traders do when trading an Inverse Head and Shoulders Pattern?
Trading in the financial market is a challenging process and traders can make mistakes. There are 3 common mistakes made by traders while trading an inverse head and shoulder pattern.
- Managing Risks: Some traders do not set up stop loss orders. A stop loss is a type of order that investors or traders use to limit their potential losses in the stock market. This helps traders avoid larger losses if the price of the security continues to drop.
- Long entry: The traders should start trading only after the completion of an inverse head and shoulder pattern. It is important that the traders observe the volume and factors like market resistance, upward price movement before entering the market.
- Technical indicators: Traders should use technical indicators and confirm the pattern before investing. Confirmation from indicators like Exponential Moving Average (EMA), Fibonacci Retracement is an important factor.
These are the 3 common mistakes made by traders while trading an inverse head and shoulder pattern. Recognizing these mistakes will help the traders take informed decisions and avoid losses. Focusing on risk management is a vital step as it helps the traders minimise the adverse effects of loss.


 Previous Article


![15 Investing.com Alternatives [Free+Paid] You Should Use in 2026](https://www.strike.money/wp-content/uploads/2026/04/Investing.com-Alternatives.jpg "15 Investing.com Alternatives [Free+Paid] You Should Use in 2026 52")
![15 TradeStation Alternatives [Free+Paid] You Should Use in 2026](https://www.strike.money/wp-content/uploads/2026/04/TradeStation-Alternatives.jpg "15 TradeStation Alternatives [Free+Paid] You Should Use in 2026 53")
![15 Chartink Alternatives [Free+Paid] You Should Use in 2026](https://www.strike.money/wp-content/uploads/2026/04/Chartlink-Alternatives.jpg "15 Chartink Alternatives [Free+Paid] You Should Use in 2026 54")
: Overview, 10 Types of Indicators, Settings for Different Markets 56")

 : Definition, Formula, calculation, Uses, Advantages Vs limitations 58")


: How We Used This 70/30 Indicator in 6 High Win-rate Strategies 62")


No Comments Yet.