Exponential Moving Average, also known as EMA, is useful for traders to stay aligned with the evolving momentum of the market. EMA also enhances clarity by smoothing price behaviour, allowing market participants to make more informed and timely decisions. It is used by many traders in the intraday, the swing and the positional trading since it adds structure, consistency and flow to their analysis. It is one of the most used instruments in technical trading due to its potential to emphasize the strength of trends, show the existence of minor changes, and enable the disciplined entry and exit of the market. It also enables traders to move through markets more accurately by eliminating noise and emphasizing significant movement.
What is Exponential Moving Average (EMA)?
The Exponential Moving Average(EMA) is a type of moving average which gives more weight to recent price data, making it faster and more responsive to new market trends compared to simple moving average (SMA). EMA is used as a technical indicator to identify the market trend by smoothing out the price fluctuation.
How Does EMA Work in Technical Analysis? [With Example]
In technical analysis, EMA works by calculating an average price that updates every candle, but it gives more importance to the newest prices. This makes the line move closer and faster toward the current market price.
For example, If a trader uses a 10 period EMA on a 15 min chart, it means it is calculating the average price of the last 10 candles (150 minutes) of 15 min, but the higher weight is given to the most recent candle.
What’s the Formula of Exponential Moving Average?
The formula for calculating the Exponential Moving Average (EMA) is given below.
EMA = (Current Closing Price × Multiplier ) + ( Previous EMA ×( 1− Multiplier ))
Where the multiplier (also called smoothing factor) is calculated as
Multiplier = 2 /N + 1
Here,
N is the number of periods for which the EMA is being calculated (e.g., 20 for a 20-day EMA).
How is Exponential Moving Average Calculated?
Lets calculate Exponential Moving Average ( EMA) of 10 periods using the formula mentioned above.
Closing Prices (Last 10 candles)
| Day | Price |
| 1 | 50 |
| 2 | 52 |
| 3 | 51 |
| 4 | 53 |
| 5 | 54 |
| 6 | 55 |
| 7 | 57 |
| 8 | 56 |
| 9 | 58 |
| 10 | 60 |
Step 1: Calculate SMA for first 10 values
This will be our first EMA value
SMA = 50+52+51+53+54+55+57+56+58+60 / 10
SMA = 546 / 10= 54.6
So first EMA₁₀ = 54.6
Step 2: Find Multiplier for 10 EMA
Multiplier = 2 / 10+1 = 2 / 11 = 0.1818 Multiplier
Step 3: Calculate EMA for next candle (Day 11)
Let Day-11 price = 62
Previous EMA = 54.6
EMA=(Close×Multiplier)+(PreviousEMA×(1−Multiplier))
EMA=(62×0.1818)+(54.6×0.8182)
EMA=11.27+44.70=55.97
10-EMA after Day-11 = 55.97
How to Use EMA in Trading?
EMA in trading is used for four major purposes which includes trend identification, getting entry and exit signals, setting profit target and stoploss, and using it as dynamic support and resistance.
? Definition, Formula, Calculation, and Trading, 181")
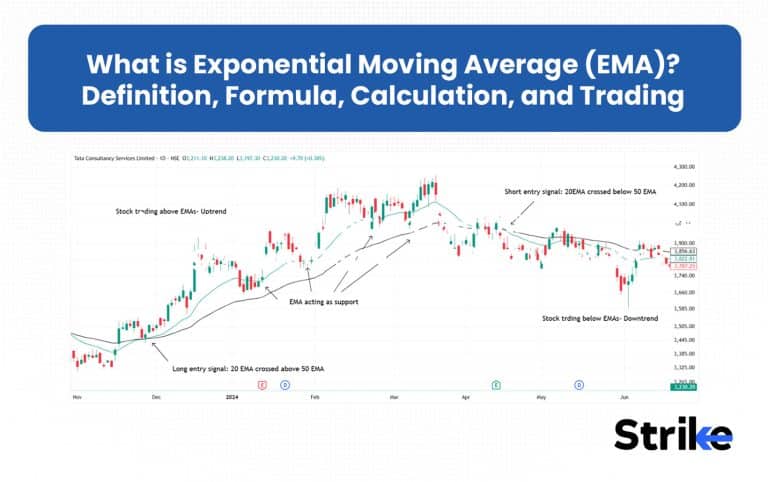
- Trend Identification: If price is moving above EMA, it indicates an uptrend and if price is moving below EMA, it indicates downtrend. Use longer period EMAs such as 50, 100 or 200 to identify broader trends of the market.
- Entry and Exit Signals: EMA crossovers are popularly used as entry and exit signals. A buy signal occurs when a fast EMA (9 EMA) crosses above slow EMA (21 EMA) from below. A sell signal occurs when fast EMA (9 EMA ) crosses below slow EMA (21 EMA) from above. Traders use these signals to enter or exit the trade.
- Support and Resistance: Traders look for price to pull back or retrace to a key EMA (e.g., 20 or 50 EMA) and then resume the trend, using it as dynamic support/resistance. Entry is taken when price shows signs of bouncing off the EMA with confirmation from volume or momentum indicators.
- Setting Profit Target and Stoploss: Traders use EMA to ride the trend and trail their stop loss and take profit. For instance, traders will hold their long positions until price breaks below 10 period EMA.
Using EMA in this structured way allows traders to combine trend-following with timely entries/exits and risk management effectively.
There are a bunch of different scanners available in the market, such as strike.money, chartink, screener, stock edge and etc, which filters out the EMA cross signal, reducing traders time for selecting stocks.
How do you Read EMA Signals?
EMA signals are read by analyzing price position relative to the EMA line, its slope for trend direction, and crossovers for buy/sell triggers, with rising EMA indicating uptrends and falling EMA signaling downtrends.
EMA Buy Signal
? Definition, Formula, Calculation, and Trading, 182")
- EMA gives a buy signal when price closes above a rising EMA, and bounces back by taking support during the pullback.
- EMA also gives buy signal when short period EMA such as 9 crosses above long period EMA such as 20 from below.
EMA Sell Signal
? Definition, Formula, Calculation, and Trading, 183")
- EMA gives a sell signal when price closes below a falling EMA, and bounces back by taking resistance during the pullback.
- EMA also gives sell signals when short period EMA such as 9 crosses below long period EMA such as 20 from above.
Trend Identification
? Definition, Formula, Calculation, and Trading, 184")
- An upward movement of EMA and price trading above EMA indicates that the price is in uptrend.
- A downward movement of EMA and price trading below EMA indicates that the price is in downtrend.
- A horizontal EMA line indicates that the price movements are in a sideways direction.
- Multi-EMA (e.g. 9,20 and 50-EMA ) to measure the strength of the trend- the steeper the slope, the stronger the momentum.
EMA Pullback
? Definition, Formula, Calculation, and Trading, 185")
- In an uptrend, EMA acts as a dynamic support for buy entries. One can enter long once price forms a bullish pattern on rising EMA in an uptrend pullback.
- In a downtrend, EMA acts as a dynamic resistance for sell entries. One can enter short once price forms a bearish pattern on falling EMA in an downtrend pullback.
How EMA Zone Buy Sell Signals Indicator Works?
An EMA Zone Buy Sell Signals indicator works by identifying an area around EMA lines or area between two EMA as a zone for support and resistance rather than a single line, as price respects areas more frequently than they respect points.
- Uptrend Buy Signal: In an upward trend a buy signal is created once price confirms dynamic support by testing lower EMA zone, rejection wick or bullish candle and closes higher than the zone.
- Downtrend Sell Signal: A sell signal is developed when the price tests the upper EMA area in a declining sequence and closes lower than the upper EMA area, indicating resistance.
EMA zones between two EMAs prove more reliable for support/resistance than single lines, as price respects these broader areas with higher frequency, enhancing signal accuracy in trend pullbacks
What are the Popular EMA Crossover Strategies?
The popular EMA crossover strategies used by the trailers include 9/20 crossover, 20/50 crossover, 50/200 crossover and 3 EMA.
9/20 EMA Crossover
? Definition, Formula, Calculation, and Trading, 187")
- This strategy uses 9 period EMA as fast moving average and 20 period EMA as slow moving average.
- A buy signal occurs when 9 period EMA crosses above 20 period EMA from below.
- A sell signal occurs when the 9 period EMA crosses below the 20 period EMA from above.
- This strategy is popular for short term and intraday trading due to its sensitivity to recent price changes.
20/50 EMA Crossover
? Definition, Formula, Calculation, and Trading, 188")
- This strategy uses 20 period EMA as fast moving average and 50 period EMA as slow moving average.
- A buy signal occurs when 20 period EMA crosses above 50 period EMA from below.
- A sell signal occurs when the 20 period EMA crosses below the 50 period EMA from above.
- This strategy provides a more reliable signal compared to 9/21 crossover. This strategy is popular for swing trading.
50/200 EMA Crossover
? Definition, Formula, Calculation, and Trading, 189")
- This strategy uses 50 period EMA as fast moving average and 200 period EMA as slow moving average.
- A buy signal occurs when the 50 period EMA crosses above the 200 period EMA from below.
- A sell signal occurs when the 50 period EMA crosses below the 200 period EMA from above.
- This strategy is favored by positional traders and investors for identifying major market moves.
3 EMA Strategy
? Definition, Formula, Calculation, and Trading, 190")
- This strategy involves use of three EMA which involves short, medium and long EMA ( eg, 9,21 and 50 EMA).
- A buy signal occurs when short period EMA crosses above medium and long term EMA from below.
- A sell signal occurs when short period EMA crosses below medium and long term EMA from above.
- This triple crossover aims to reduce false signals by requiring alignment among all three EMAs, making it popular for short-term trades and scalping.
EMA crossover strategies scale from sensitive 9/20 for intraday to robust 50/200 for long-term trends, with triple EMAs filtering noise for higher reliability across timeframes.
Which EMA is more Accurate?
There is no single “ most accurate” EMA in the market. The accuracy of EMA depends entirely on the trader’s objectives, trading style, and the current market conditions. To have fast signals and fast entries, traders use 9/12/20 EMA, whereas 34/50 EMA is good to have a balanced picture of the trend, and 100/200 EMA is more reliable and has fewer false indicators.
However, the 200 EMA is known as the king, as it is more of a long term market sentiment and less noisy than other EMAs and is more followed by institutions and large players. When price trades above the 200 EMA, the long-term trend remains bullish, and when it trades below, it signals broader weakness, making it a powerful directional guide.
What Time Frames are Commonly Used for EMAs?
The commonly used time frames used for EMAs totally depends on trading styles and objective of the trade.
| Trading Style / Purpose | Common Time Frames for EMA | Most Used EMA Pairs |
| Scalping (fast execution) | 1-min, 2-min, 5-min | 5 & 9, 5 & 13 |
| Intraday (trend + timing) | 5-min, 10-min, 15-min, 30-min | 9 & 21 (most popular), 10 & 20, 13 & 34 |
| Short-Term Trading | 30-min, 1-hour | 9 & 21, 21 & 50 |
| Swing Trading (clean structure) | 4-hour, Daily | 21 & 50, 34 & 89 |
| Positional / Long-Term | Daily, Weekly, Monthly | 50 & 200, 100 & 200 |
Short EMA periods react quickly to price changes but may produce more false signals, while longer EMA periods provide more reliable signals with less noise, making them better for confirming trends and reducing fake alerts.
What are the Best EMA Indicator Settings?
The best EMA indicator setting depends on the type of trading and time horizon you focus on. Generally the most popular EMA settings include 9, 20, 50, and 200 periods, each suitable for different trading styles and timeframes.
EMA Setting for Day Trading
Shorter EMAs like 9 or 10 periods are more effective for day trading, whereas 21 period EMA can be added to provide trend direction on a medium-term basis. A 50-period EMA can be included to have a bigger market picture.
EMA Setting for Scalping
As scalping demands ultra fast responsiveness, traders use fast EMAs such as 5, 9, 13 and 20. This fast period EMAs help traders to pick fast changes in momentum. Scalpers prioritize quick exits as soon as price separates from the fast EMA.
EMA Setting for Swing Trading/ Medium Term Trend
As swing trading focuses on smoother trend structure and pullback opportunities, it is ideal to use medium term period EMAs such as 20, 50, and 100 EMAs. The 20 EMA is used to follow aggressive trend-following, whereas the 50 EMA is used to find cleaner and more solid swing setups. Many swing traders use 50 and 200 EMA crossover strategies (Golden Crossover) to identify medium term trends.
EMA Setting for Long Term Trend
Long-term trend investing requires very smooth EMAs to avoid noise. The 200-period EMA is an ideal setting to determine the big picture, the long-term direction of the trend.
EMA Setting for Forex Trading
Forex traders adjust EMA settings based on volatility and currency pairs. The most effective EMA settings for forex are
- Day Trading: 9 & 21 EMA or 8 & 20 EMA
- Scalping: 5 & 9 EMA
- Swing: 20 & 50 EMA
- Trend Bias: 100 or 200 EMA
For volatile pairs like GBPJPY, Gold (XAUUSD), 21/50/100 EMA works best. EMA cross & price respecting EMA during London/New York sessions are often preferred trading cues.
How Reliable is the EMA Indicator?
EMA is moderately reliable, but its effectiveness depends heavily on market conditions and how it’s used. The reliability of EMA is very less when it is used alone.
When Oddmund Groette conducted a backtest of a basic moving average crossover system on the S&P 500 from 1960 to 2025 tested lookback periods from 5 to 200 days at 5-day intervals.
Trading rules:
- When the close of the S&P 500 crosses above the N-day moving average, go long.
- When the close of the S&P 500 crosses below the N-day moving average, sell.
The results revealed significant variability in false signal rates:
? Definition, Formula, Calculation, and Trading, 191")
- The best win rate was 43% (5-day lookback period), implying a false signal rate of 57% (100% – 43%).
- The worst win rate was 24% (120-day lookback period), equating to a false signal rate of 76% (100% – 24%). These findings indicate that shorter lookback periods reduce false signals, likely due to their responsiveness to price changes, while longer periods, such as 120 days, increase false signals due to delayed reactions to market shifts.
A trader can apply several approaches to reduce the false signals and increase the reliability of the EMA.
- Using a combination of different EMAs.
- Using multiframe confirmation
- Using EMA in combination with other indicators such as RSI, MACD, or Bollinger Bands.
Hence, EMA alone is not very accurate, but the accuracy and reliability can be increased by adding different indicators.
Is EMA Strategy Profitable?
Yes, EMA strategy is profitable, but its success largely depends on market conditions, asset class, and execution. Strategy using a single EMA often has less profitability, specially during the sideways market. However, the profitability improves when you use two or three EMA strategies.
EMA strategy works best in trending markets with clear trend direction, high volume asset and momentum phase. Hence, avoid trading in sideways and news driven markets to improve profitability.
You can also combine RSI, MACD and other indicators for extra confirmation and to avoid fake signals.
Does EMA Give False Signal?
Yes, the Exponential Moving Average (EMA) does give false signals, particularly in choppy or sideways markets where the price movement does not have a distinct direction. Since the EMA reacts to the latest price focusing on current data, it is more likely to give whipsaws or false signals than a Simple Moving Average (SMA). The false signals happen when the EMA rapidly switches back and forth as a result of the market-noise and unexpected changes in price as opposed to actual changes in trends.
How to Filter False EMA Signals?
There are five major ways to filter false EMA signals.The ways involve use of multiple EMA periods, adding confirmation indicators, candle close confirmation, using long period EMA, and applying volume.
- Use Multiple EMA Periods: Use the combination of a short-term and long-term EMAs (e.g., 8 EMA and 20 EMA) and trade them according to their alignment and the distance between them to verify the strength of the trend instead of the ideal EMA crossover.
- Add Confirmation Indicators: Add additional momentum indicators such as RSI (Relative Strength Index) or MACD to ensure that the trend is strong and not just trading on weak or false signals.
- Wait for Close Confirmation on Price: Trade only after candlesticks close strongly above or below EMA rather than on intrabar price changes, which will minimize false signals.
- Adjust EMA Settings: Longer periods EMAs are less sensitive and give fewer false signals on volatile or sideways markets, hence adjust EMA settings to market volatility and time frame.
- Apply Volume or Price Action Confirmation: Before making a trade decision, confirm EMA signals by large volume spikes or breakout candlestick patterns.
Employing these strategies helps reduce the frequency of false signals generated by the EMA and enhances trade decision quality by filtering out noise and confirming trend direction.
What are the Advantages & Limitations of Exponential Moving Average
The advantages and limitations of exponential moving averages are mentioned below in the table.
| Advantages | Limitations |
| Reacts faster to recent price changes | Too sensitive in sideways/choppy markets |
| Useful for identifying trends early | Generates more false signals than SMA |
| Works well in strong trending markets | Lagging indicator — signals come after price moves |
| Acts as dynamic support/resistance | Less reliable without confluence/confirmation |
| Good for pullback, breakout, and trend-following setups | Difficult to use for range-bound trading |
| Helps visualize momentum strength | Requires filtering with volume/RSI/price action |
EMA excels in trending markets with fast signals and dynamic support, but falters in choppy conditions with false signals, it is best used with confirmation tools.
Is EMA a leading or lagging indicator?
EMA is a lagging indicator because it calculates the value using past price data, and therefore it follows price movement instead of predicting it. Compared to an SMA, the EMA reduces delay by giving higher weight to recent prices, which makes it feel faster than other Leading or Lagging Indicators, but it still uses past data. Because of this reliance on historical price action, both the EMA and SMA are fundamentally categorized as Leading or Lagging Indicators that trail current market movements.
Why does EMA react faster than SMA?
EMA reacts faster than SMA because the exponential moving average gives more weight to the recent price data, and it is more sensitive to the new price changes whereas the simple moving average gives equal weight to all the prices during the period and it is slow to respond.
The formula used by the EMA incorporated a smoothing factor that puts more weight on recent prices whereas SMA is a simple arithmetic mean of past prices that puts an equal weight on every data point hence the faster EMA response to price changes.
EMA vs WMA vs HMA vs SMA
The comparison between EMA vs WMA vs HMA vs SMA is mentioned below in the table.
| Moving Average | Calculation Method | Sensitivity to Price Changes | Lag | Smoothness | Typical Use |
| SMA (Simple Moving Average) | Arithmetic mean of closing prices over a period, equal weight to each data point | Low (slow to react) | High | Smooth but delayed | Long-term trends, stable signals |
| EMA (Exponential Moving Average) | Weighted average with exponentially decreasing weights for older data | Higher than SMA, reacts faster | Less lag than SMA | Less smooth than SMA | Shorter-term trends, faster signal |
| WMA (Weighted Moving Average) | Linear weights decreasing for older data; more weight to recent prices | More responsive than SMA, less than EMA | Moderate lag | Between SMA and EMA smoothness | Balanced responsiveness and smoothness |
| HMA (Hull Moving Average) | Uses weighted moving averages in multi-step calculation to reduce lag and smooth fluctuations | Very high; designed for minimal lag | Minimal lag | Smooth like SMA | Fast reaction with smooth curve for quick decisions |
HMA delivers the best balance of minimal lag and smoothness for fast trends, while SMA suits stable long-term analysis; EMA and WMA offer responsive middle grounds for varying market conditions.
Is EMA the same as EWMA?
Yes, the Exponential Moving Average (EMA) is the same as the Exponentially Weighted Moving Average (EWMA). The EMA is also called the EWMA as it places more weight on the recent price data points as opposed to the Simple moving average (SMA), which gives equal weightage to all price data points in a period.
Do Golden Cross & Death Cross use EMA?
Yes, Golden Cross and Death Cross can use EMAs, but traditionally these crossovers use SMA. As standard market context,
- Golden crossover = 50-SMA crossing above 200-SMA
- Death Crossover = 50-SMA crossing below 200-SMA
EMAs can also be used in golden and death crossovers to get faster reaction, earlier trend detection and quicker shift in market direction.
What are the Other Types of Indicators beside EMA?
The different types of indicator beside EMA is mentioned below in the table.
| Indicator Type | Examples | What it Helps With |
| Momentum Indicators | RSI, Stochastic, RMI/RMI Sir Indicator, CCI | Shows overbought/oversold & trend strength |
| Trend Indicators | ADX, Parabolic SAR, Ichimoku | Confirms trend direction & trend power |
| Volume Indicators | OBV, Volume Bars, Volume Profile | Measures participation, demand/supply zones |
| Volatility Indicators | Bollinger Bands, ATR, Keltner Channel | Shows market expansion, risk & zones |
| Strength/Comparison Indicators | RRG (Relative Rotation Graph), RMI | Compares sector/stock strength or momentum |
| Support/Resistance Indicators | Pivot Points, Fibonacci, Demand/Supply Zones | Marks key price reaction levels |
| Cycle Indicators | Elliott Wave Tools, Fibonacci Time Zones | Helps identify market phases/cycles |
| Sentiment/OI Indicators | Open Interest, Strike.OI Insights (platform based) | Shows buildup, trend bias in derivatives |
| Market Breadth Indicators | Advance–Decline Line, McClellan Oscillator | Measures overall market participation |
These indicator types complement EMAs by providing additional insights into different aspects of market behavior, enhancing trading decisions.
How can EMAs be used in Conjunction with other Trading Indicators?
EMAs can be used with conjunction with other trading indicators to confirm trend direction, momentum, volatility, and market structure. EMA alone only gives trend direction, but using it with different indicators gives conviction.
There are top 5 indicators that can be used in Conjunction with EMA. The indicators are RSI, MACD, Bollinger Band, Volume and support & resistance.
1. EMA + RSI (Trend + Momentum Filter)
Use EMA for trend direction, RSI to confirm strength.
? Definition, Formula, Calculation, and Trading, 192")
- Price above EMA + RSI > 55 = Long bias
- Price below EMA + RSI < 45 = Short bias
- Avoid trades when RSI stays between 45–55 (range market)
Filters weak momentum & avoids sideways chop.
2. EMA + MACD (Trend + Trend Confirmation)
EMA gives signals early, MACD confirms sustained trend.
? Definition, Formula, Calculation, and Trading, 193")
- 9 EMA & 21 EMA crossover = early signal
- MACD line crossing signal line = confirmation
- MACD histogram rising = strength
Reduces false signals caused by volatility.
3. EMA + Support/Resistance (Price + Structure)
EMAs alone can fake you out. Levels add context.
- Buy when price breaks resistance + retests with EMA support
- Sell when support breaks + EMA rejects price
Trades only taken at meaningful price zones.
4. EMA + Volume (Trend + Participation)
Trend only matters if volume confirms it.
? Definition, Formula, Calculation, and Trading, 195")
- EMA crossover + rising volume → strong entry
- EMA crossover + low volume → avoid (fake breakout risk)
Filters weak breakouts with no backing.
5. EMA + Bollinger Bands (Trend + Volatility)
Use EMA to define trends, Bollinger Bands to gauge volatility & breakout potential.
? Definition, Formula, Calculation, and Trading, 196")
- Price riding upper band + above EMA → uptrend continuation
- Price at lower band + below EMA → downtrend continuation
- Band squeeze + EMA breakout → trend ignition setup
Helps identify expansions after consolidation.
Can EMAs be used in Combination with Candlestick Patterns?
Yes, EMAs can be used in combination with candlestick patterns, and can turn a simple setup signal into a powerful, high-probability entry setup. EMA defines trend, support and resistance, whereas candlestick patterns define entry and psychology.
Here are two major ways to use candlestick patterns with EMA. The ways are pullback and rejection candlestick at EMA and EMA break, retest and reversal pattern.
1. Pullback and Rejection Candlestick at EMA
? Definition, Formula, Calculation, and Trading, 197")
- Use EMA as dynamic support and resistance.
- Price trading above 20 or 50 EMA suggests an uptrend.
- If price pullback to 20 or 50 EMA and forms a bullish candle (Hammer / Bullish Engulfing / Pin bar)
- Enter after bullish candle close near EMA
This setup works best in trending markets.
2. EMA Break + Retest + Reversal Pattern
? Definition, Formula, Calculation, and Trading, 198")
- Candlestick confirms real move of breakout
- Wait for Price breaks EMA and comes back to retest.
- Look for reversal candlestick pattern such as Engulfing or Morning Star at EMA
This filters many false breakouts.


 Previous Article


![15 Investing.com Alternatives [Free+Paid] You Should Use in 2026](https://www.strike.money/wp-content/uploads/2026/04/Investing.com-Alternatives.jpg "15 Investing.com Alternatives [Free+Paid] You Should Use in 2026 220")
![15 TradeStation Alternatives [Free+Paid] You Should Use in 2026](https://www.strike.money/wp-content/uploads/2026/04/TradeStation-Alternatives.jpg "15 TradeStation Alternatives [Free+Paid] You Should Use in 2026 221")
![15 Chartink Alternatives [Free+Paid] You Should Use in 2026](https://www.strike.money/wp-content/uploads/2026/04/Chartlink-Alternatives.jpg "15 Chartink Alternatives [Free+Paid] You Should Use in 2026 222")
: Overview, 10 Types of Indicators, Settings for Different Markets 223")


 : Definition, Formula, calculation, Uses, Advantages Vs limitations 226")


: How We Used This 70/30 Indicator in 6 High Win-rate Strategies 229")


No Comments Yet.