The Commodity Channel Index (CCI) measures the current price level relative to an average price level over a given period of time. The Commodity Channel Index was initially introduced for the commodities market but traders have been using it for trading across all sorts of financial instruments.
This momentum-based oscillating indicator also helps in identifying overbought and oversold situations in stocks. CCI’s ability to analyze price trend direction and strength in a stock enables traders to determine their trading decisions.
The CCI indicator works on the premise that the prices in the market tend to deviate from their mean in predictable ways. It aims to capture those cyclical patterns by analyzing the relationship of an asset’s current price and its historical average.
: Definition, How it Works, Calculation, and Trading 61")
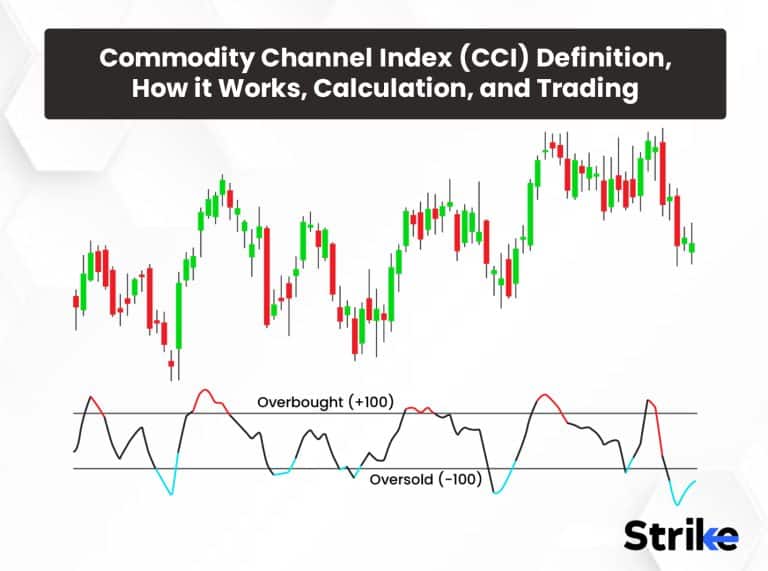
The CCI indicator hovers around zero level moving into positive and negative zones.
Whenever the CCI is above +100 level, traders believe that the stock is in strong uptrend. Conversely, CCI below -100 level shows that the stock is in a strong downtrend and traders can use different technical analysis methods to confirm sell signals in this situation.
A common way to trade with CCI is to identify potential market reversal zones. CCI signals potential overbought and oversold zones whenever it crosses +100 and -100 levels. Traders believe that the price will return to its mean and look for buying and selling opportunities whenever the CCI crosses its extreme levels. The Commodity Channel Index is an important technical tool which helps traders in measuring price trends, potential trend reversals and the strength of an asset’s movements. Traders can increase their chances of success in the market by using the CCI indicator effectively.
What is Commodity Channel Index (CCI)?
The Commodity Channel Index or CCI is a technical indicator which measures the stock price relative to its average price over a specific period. The CCI indicator plots the difference between the price of a security and its moving average. The CCI indicator has no upward or downward limit. CCI’s readings get relatively higher when the price is far above its average and similarly, it gets relatively lower when the price is far lower below its average.
: Definition, How it Works, Calculation, and Trading 62")
The CCI indicator is plotted between 3 horizontal lines that form a channel. This indicator has been designed in a way that approximately 70-80% of a stock’s price movements fall between -100 and +100.
The price of a stock is above its historical average whenever the CCI is above zero and conversely, the price of a stock is below its historical average whenever the CCI is below zero. This way, CCI helps traders to find potential overbought and oversold regions in a stock that potentially signal a trend reversal.
Who developed the CCI?
The Commodity Channel Index was developed by Donald Lambert and featured in his book “Commodity Channel Index: Tools for Trading Cyclical Trends” in 1980. The CCI was introduced as a means to analyze and predict cyclical movements in the commodity markets.
Lambert observed that the commodity prices tend to fluctuate in a cyclical manner. He wanted to capture these fluctuations and potential trend reversals when the price reaches extreme levels. Lambert’s belief that the price movements of commodities tend to deviate from their mean in a consistent manner led to the development of the Commodity Channel Index. Later, the CCI was being used to identify potential overbought and oversold zones in all sorts of financial instruments. The CCI’s relevance persists despite being introduced several decades ago.
How does Commodity Channel Index (CCI) work?
The Commodity Channel Index works on the fundamental that all prices tend to deviate from their mean in predictable cyclical patterns in a consistent manner. The CCI calculates how far the price of an asset has deviated from its historical average over a specific time period.
: Definition, How it Works, Calculation, and Trading 63")
The Commodity Channel Index has 3 horizontal lines.
Line 1 is +100, Line 2 is 0 and Line 3 is -100. Price of any stock is likely to trade between this zone 70-80% of the time. However, CCI triggers a potential overbought or oversold scenario in a stock whenever the readings go above or below +100 and -100.
CCI suggests a strong uptrend and potential overbought scenario when it is above +100. This is why a trader can consider exiting from his existing bullish trade whenever the CCI goes above +100. Conversely, a trader can consider an exit from his existing bearish trade whenever the CCI goes below -100 as it is a signal of oversold condition in the stock. An example of working of CCI in conjunction with price action and price is displayed in the image below.
: Definition, How it Works, Calculation, and Trading 64")
Furthermore, CCI can also signal clear buying and selling signals. For example, if the CCI line crosses below the -100 line and then crosses back above it, a trader can take a bullish trade here by buying the stock and vice versa.
How is Commodity Channel Index (CCI) used in Technical Analysis?
Traders use the Commodity Channel Index in technical analysis for gaining insights into market trends, potential reversal and the overall price strength. The Commodity Channel Index is used in technical analysis in 4 common ways.
The CCI indicator is very effective when it comes to identifying overbought and oversold conditions in an asset. Whenever a stock is above its historical average, the CCI rises above +100 indicating a potential overbought territory. Similarly, whenever a stock is below its historical average, the CCI goes below -100 indicating a potential oversold territory. This enables traders to look for potential reversal points as the CCI reaches these extreme levels.
Chart uploaded below is an example of how prices react when CCI reaches overbought or oversold territories. On the left side, the purple box represents the conjunction of price and CCI when CCI was in an overbought zone. Prices corrected sharply towards downside till a point when the positive divergence got created as marked by black arrows. Price managed to form a double bottom and appropriate candlestick patterns were spotted to further solidify a view towards upside. This way, an example of price reacting when CCI reaches extreme points and how divergence affects the trend is showcased in the example below.
: Definition, How it Works, Calculation, and Trading 65")
A consistently positive CCI signals a strong uptrend and conversely a consistently negative CCI signals a strong downtrend. This information helps traders in identifying the price trends of a stock effectively.
CCI divergence occurs when the direction of the stock’s price is different from the CCI indicator. Meaning, the stock is making a higher high and higher low while the CCI is making lower highs. This is called a bearish divergence. Similarly, when the stock is making a lower high and lower lows while the CCI is making higher lows signals a bullish divergence in that particular stock. This piece of information can help a trader spot potential trend reversals in the market. An example of how divergence affects prices is also covered in the chart uploaded above.
CCI indicates a potential trend reversal from bearish to bullish when it crosses above zero. Conversely, it indicates a potential trend reversal from bullish to bearish when it crosses below zero. Traders can increase their chance of success by planning the direction of their trade according to this.
: Definition, How it Works, Calculation, and Trading 66")
Chart uploaded above shows the overall activity of price when CCI showed some significant readings. Firstly, we can see how the double bottom on CCI appeared around the Support zone on the price chart. This is used as a strong indication for an upside. Further, the red horizontal line shows the 0 level on CCI. Whenever CCI approached 0 level, it bounced resulting in continuation of trend on price. This information is highly useful for traders. One can take these readings, dive into lower time frames to gather different confirmations to make trading plans to take long setups.
Regardless of its effectiveness, it is important to consider that the CCI is not a standalone indicator. Traders should use the CCI with additional technical indicators to improve the effectiveness of their trades.
How is Commodity Channel Index (CCI) calculated?
The Commodity Channel Index is calculated by figuring out the difference between the historical average price of an asset and the average of the means over a specific period. This difference is then compared to the average difference over the time period. The sum of this is then multiplied by a constant to ensure that most values of the CCI fall within the standard range of -100 to +100.
The formula used for calculating the Commodity Channel Index is
CCI = (AveP – SMA_of_AveP) / (0.015 * Mean Deviation)
Where: CCI = Commodity Channel Index AveP = Average Price = (High + Low + Close) / 3
70-80% of the CCI values fall within the +1—to -100 range because of the 0.015 constant.
How do Traders use Commodity Channel Index (CCI)?
Traders use the Commodity Channel Index to track market movements, confirm market trends and generate trading signals. Traders have started using the Commodity Channel Index on all sorts of timeframes even though it was initially designed to spot long-term trend changes. Its flexibility allows traders to fine-tune CCI-based strategies by adjusting CCI parameters. For example, traders change the number of periods used in the calculation of the CCI and the rules for entry and exit according to different market situations.
Traders also use CCI on a longer time frame to identify the dominant trend of a stock and on the shorter time frame to find pullbacks and take an entry. In the chart below, When CCI reaches the extreme low point on the visible range of time, a bounce is expected. This expectation and reading would have given a trader edge by finding more confirmations by analyzing and finding potential long entries on lower time frames. That point had a previous support zone as well. On daily time frame, it gave a bullish candlestick pattern, adding further confirmation to a trading plan.
: Definition, How it Works, Calculation, and Trading 67")
What trading strategies are used with Commodity Channel Index (CCI)?
Traders use different types of trading strategies with Commodity Channel Index. Here are the 4 most common trading strategies used with the Commodity Channel Index.
One of the most common CCI strategies involved identifying overbought and oversold levels of a stock with the help of CCI. The CCI indicates a potential overbought zone whenever it crosses the +100 level. Traders can use this information to exit from their existing bullish trades. They can also look for selling opportunities as the stock is more likely to take a pullback from this level. The same is applicable in a bearish scenario as well. An example of how exit of long positions and how fresh buy positions can be avoided is shown in the example below.
: Definition, How it Works, Calculation, and Trading 68")
A CCI divergence occurs when the price is making a higher high and higher low while the CCI is making Lower highs and lower lows. This indicates a bearish divergence and traders should start looking for selling opportunities at this point. Conversely, when the price is making a lower high and lower low and the CCI is making a higher high and higher low, this indicates a bullish divergence and traders should look to buy in this type of market. An example of divergence and how traders can use the information from CCI to solidify a trading plan can be seen from the image uploaded below.
: Definition, How it Works, Calculation, and Trading 69")
Traders can draw a trendline on the CCI indicator just as they do on the price chart. CCI signals a change in the direction of the trend whenever it breaks a trendline in the direction opposite to the established trend.
Traders can combine the CCI indicator with Moving Average on any charting software. This combination can help a trader in confirming trends and generating crossover signals. For example, CCI crossing above the moving average is a bullish signal and a trader should only look for buying opportunities at this point and vice versa.
It is important to consider that no trading strategy is foolproof. Traders should check and validate their trading strategy and plan before actually taking trades in the market. They should also follow effective risk management techniques to increase their chances of success in the market.
When do traders use Commodity Channel Index (CCI) indicator?
Traders use the Commodity Channel Index indicator to gain valuable insights into market trends and potential trading opportunities. Traders also use the Commodity Channel Index indicator for 5 more purposes. It is used to identify potential overbought and oversold scenarios in a stock and potential trend reversals in a stocks, confirming the marking trend as well as the strength of the trend, setting up stop loss and take profit levels, and multi-timeframe analysis.
Traders use CCI as an effective versatile indicator. However, it is important to note that CCI is not a standalone indicator. You can use the CCI indicator in conjunction with multi-timeframe analysis, price action study, candlestick patterns and other indicators to improve your chart reading skills.
Do traders use the CCI to identify overbought and oversold conditions?
Yes, traders use the CCI to identify the overbought and oversold conditions in a stock. The Commodity Channel Index helps traders identify an overbought/oversold scenario in a stock because it measures how far the current price of an asset has deviated from its historical mean over a specific time period.
How effective is Commodity Channel Index (CCI)?
The Commodity Channel Index is very effective as it helps traders in identifying the strength of a trend, potential overbought/oversold zones and divergences in a stock. However, its effectiveness can differ from trader to trader. The effectiveness of the Commodity Channel Index depends on factors like the ability of a trader to use the CCI, to read charts, current market situation, etc.
Is Commodity Channel Index (CCI) accurate?
Yes, Commodity channel index (CCI) is accurate. Though no indicator can provide accurate signals, traders measure in terms of precision. This precise tool can be used as signal and further multi time frame analysis and other indicators can be used in conjunction to further improve the accuracy of the prediction.
Is Commodity Channel Index (CCI) reliable?
No, the Commodity Channel Index is not reliable as a standalone trading indicator. The Commodity Channel Index’s reliability depends on factors such as market conditions and the trader’s strategy. The CCI is also susceptible to generating false trading signals during choppy or range bound markets. The indicator should be used alongside multi-timeframe analysis, price action study, candlestick patterns and other indicators to improve your chart reading skills.
How does CCI work in conjunction with other Indicators?
The Commodity Channel Index’s versatility makes it more effective when used in conjunction with other indicators. The Commodity Channel Index works effectively with these 5 technical indicators.
The CCI and the RSI are both momentum indicators. Using these two indicators together can help traders in identifying the potential overbought and oversold conditions in a stock more effectively. For example, the success rate of the trade will increase whenever the CCI shows overbought/oversold readings aligning with the readings of RSI.
Traders also combine the CCI with Fibonacci Retracement in order to find potential support/resistance levels effectively. For example, the significance of a potential support/resistance level is reinforced when the CCI shows overbought/oversold conditions near a significant Fibonacci level.
: Definition, How it Works, Calculation, and Trading 70")
In the chart uploaded above, one can see how multiple indicators and tools can be used in conjunction to CCI to potentially strengthen a trading plan. A purple line is the 200 SMA and it acts as a strong support level. Additionally, divergence is observed between price and RSI and CCI further adding fuel to strengthen a trade setup meant for upside. This way traders can take additional confirmations from different indicators, multi time frame analysis, price action and candlestick patterns can be used to take a long setup.
CCI and the Moving Average are commonly used to confirm the direction of the trend. The CCI above a Moving Average signals a bullish trend while the CCI below a Moving Average shows a bearish trend.
Traders can identify potential breakout and reversal points by overlaying Bollinger Bands on the CCI chart. For example, CCI moving outside of the Bollinger Bands indicates extreme price movements which signal a potential reversal in the market.
Traders can use Candlestick Patterns in conjunction with CCI to identify potential entry and exit points. For example, a bullish engulfing candle near a CCI oversold level can indicate a potential reversal from bearish to bullish trend. All of the above mentioned points are covered in an example attached in the chart above.
Traders should always remember that the effectiveness of combining technical tools together depends on a trader’s skill and experience. Traders should not overload their charts with multiple indicators as it will lead to confusion. Instead, traders should focus on 2-3 effective indicators that compliment each other.
Which is better, RSI or CCI?
The Commodity Channel Index and the Relative Strength Index are both momentum oscillators that hover in positive and negative ranges.
The Relative Strength Index or RSI measures the speed and change of price movements over a specific time period (Usually 14). It oscillates between a defined 0 to 100 range and is used to identify overbought and oversold scenarios in a stock.
On the other hand, the Commodity Channel Index or CCI measures an asset’s typical price to its moving average and then divides those by the absolute value of its mean from the typical price. High CCI readings mean that the stock is above its historical high while low CCI readings mean that the stock is below its historical low.
Concluding one is better than the other is tough but the RSI is comparatively easy to read as it oscillates between a defined range unlike CCI.
How can traders use the CCI to trade different markets?
Traders can use the Commodity Channel Index to trade different markets by applying the same principles and following the same strategies. Traders can use the CCI indicator to trade different market types like stocks, forex, commodities etc. Initially, the CCI was introduced for the commodities market but over the years it has proven its efficiency across all the market types.
What are the advantages of CCI?
The Commodity Channel Index is a valuable technical tool as it offers multiple advantages. Following are the 3 advantages of the CCI indicator.
- Identifying trend and Trend’s strength :
The Commodity Channel Index helps traders in identifying the market trend with no efforts. A positive CCI reading signals an uptrend while a negative CCI reading shows a downtrend.
- Effective across different markets and timeframes:
The Commodity Channel Index is a versatile indicator which is effectively used in all market types such as stocks, forex, commodities etc. It can also be used across all types of trading time frames from day trading time frames like 15 minutes to longer time frames like daily timeframe.
- Integration with other technical tools:
The Commodity Channel Index is used in conjunction with different technical tools such as the RSI, Moving Average, Bollinger Bands, Fibonacci Retracement, etc. This helps a trader in increasing the effectiveness of his/her analysis and gain multiple perspectives from a single price chart.
The CCI indicator is an effective technical tool but it is also important to understand that no technical indicator guarantees successful trading outcomes. Applying effective risk management techniques and practicing sound trading discipline are crucial factors behind trading success.
What are the disadvantages of CCI?
The Commodity Channel Index is a versatile indicator but it does have its shortcomings. Following are 3 main disadvantages of the CCI.
- False signals in choppy/range bound market:
The Commodity Channel Index is susceptible to generate false trading signals during a choppy/range bound market. The CCI can generate signals that do not reflect the market’s direction during times of low volatility.
- CCI is a lagging indicator:
The Commodity Channel Index is a lagging indicator because it relies on the past price data to generate trading signals. The CCI can fall behind during times of rapid changes in the market’s condition.
- No fixed Overbought/oversold levels:
The Commodity Channel Index does not have predetermined threshold levels like the RSI. The readings above or below +100 and -100 is not be suitable for all assets and trading time frames.
One should also note that every technical tool has its disadvantages. The Commodity Channel Index is a valuable technical indicator when used with conjunction of other technical tools.
What are some CCI mistakes traders make?
Traders who are new to using the Commodity Channel Index make the same mistakes when applying the indicator to their trading strategies. Here are 3 of the most common mistakes traders make while using CCI.
- Relying solely on CCI signals:
This is one of the most common mistakes traders make. Traders should never rely solely on CCI signals and must always consider other forms of analysis or use other indicators. Traders should use the CCI in conjunction with other indicators to improve the overall effectiveness of their analysis.
- Misinterpreting overbought and oversold levels:
Traders often misinterpret overbought and oversold levels while using CCI. Just because the CCI’s reading is above +100 or below -100 does not guarantee an immediate reversal in the market. The overbought and oversold periods can persist for longer periods in certain situations.
- Using default parameters without optimization:
Different asset classes and trading time frames require parameter changes in the CCI to match the prevailing market conditions. Traders often use the default CCI setting in every type of market or trading time frame.
Traders can improve on their mistakes by using the Commodity Channel Index on a daily basis and educating themselves on each of the indicator’s parameters. Consistent learning is a must while trading with technical tools.
Is CCI a buy, sell or hold?
CCI can signal for Buy, sell or hold. If CCI resonates sharply around 0 level with no precise direction, the trend is likely to be interpreted as range bound and trades can be avoided. If CCI strongly rejects and bounces from oversold or overbought regions, necessary steps can be taken to take complimentary trades based on other readings. The CCI readings in these extreme points can give signals to exit current trades.
Is CCI a good indicator?
Yes, The Commodity Channel Index is a good indicator. The CCI is a good indicator only when used appropriately and in conjunction with multi-timeframe analysis, price action study and other indicators and complimentary technical tools.
What is the difference between CCI and Stochastic Oscillator?
The Commodity Channel Index and the Stochastic Oscillator are both momentum oscillators used to identify overbought and oversold scenarios in a stock. But they differ in terms of.
- Calculation:
The Commodity Channel Index determines the difference between the current price to its historical average over a specified time period. While the Stochastic Oscillator compares the closing price of an asset to its price range over a specified time period. It oscillates between 0 to 100.
- Oscillation Range:
The CCI oscillates around its center line at zero. It signals overbought/oversold conditions above +100 and below -100. While the Stochastic Oscillator oscillates between 0 and 100. It signals overbought conditions when the %K line is above 80 and oversold conditions when it falls below 20.
- Signal Crossover Interpretation:
The Commodity Channel Index crossovers above +100 or below -100 indicates potential trend changes or overbought/oversold conditions. While in the case of Stochastic Oscillator, crossovers of the %K and %D lines above 80 or below 20 are used commonly for identifying overbought and oversold conditions.
The Commodity Channel Index and the Stochastic Oscillator are both momentum oscillators but they differ on the basis of calculation methods, oscillation ranges and their sensitivity to the price movements within a stock.


 Previous Article


![15 Investing.com Alternatives [Free+Paid] You Should Use in 2026](https://www.strike.money/wp-content/uploads/2026/04/Investing.com-Alternatives.jpg "15 Investing.com Alternatives [Free+Paid] You Should Use in 2026 76")
![15 TradeStation Alternatives [Free+Paid] You Should Use in 2026](https://www.strike.money/wp-content/uploads/2026/04/TradeStation-Alternatives.jpg "15 TradeStation Alternatives [Free+Paid] You Should Use in 2026 77")
![15 Chartink Alternatives [Free+Paid] You Should Use in 2026](https://www.strike.money/wp-content/uploads/2026/04/Chartlink-Alternatives.jpg "15 Chartink Alternatives [Free+Paid] You Should Use in 2026 78")


 : Definition, Formula, calculation, Uses, Advantages Vs limitations 82")


No Comments Yet.