The Volume Oscillator (VO) is a powerful technical indicator used by traders and investors to analyse the relationship between trading volume and price movements in financial markets. The volume oscillator (VO) quantifies the difference between two moving averages of volume and offers useful information about market patterns and prospective trading opportunities.
The Volume Oscillator’s primary focus is on the volume’s departure from its moving averages. This makes it easier to spot changes in buying and selling pressure, which either confirms or suggests future trend reversals. The VO is frequently used in conjunction with other technical indicators by traders to strengthen their entire market research and validate signals.
Volume oscillators come in a variety of forms, with the Moving Average Convergence Divergence (MACD) and Percentage Volume Oscillator (PVO) serving as two well-known examples. Each type aids traders in gaining a thorough understanding of the market and offers particular insights into volume movements.
Traders use a number of important methods while using the Volume Oscillator. Finding bullish or bearish divergence between volume and price is a popular application. It is known as divergence when an asset’s price moves in one direction while its volume moves in the opposite direction. This acts as a useful tool for decision-making and serves as a warning indicator for prospective trend reversals.
What does Volume Oscillator (VO) mean?
The Volume Oscillator (VO) is a technical indicator used in financial markets to analyze the interplay between trading volume and price movements. The Volume Oscillator (VO) measures the variation between two volume moving averages, giving traders and investors information about market movements and prospective trading opportunities.
The Volume Oscillator is a momentum-based indicator, and its main goal is to identify changes in buying and selling activity by calculating volume deviations from its moving averages. Volume Oscillator data is useful for spotting future trend reversals or confirming the strength of current trends.
The adaptability of the Volume Oscillator is one of its key benefits. It is used with many other financial products, including stocks, foreign exchange, and commodities. It is also used for other timeframes, giving traders a broader comprehension of market dynamics over a range of timeframes.
Traders improve their trading selections by including the Volume Oscillator in their technical analysis. It aids in signal confirmation and complements other technical indicators, improving the precision of market analysis as a whole.
How does the Volume Oscillator (VO) work?
The Volume Oscillator (VO) calculates the variance between two volume moving averages. The Volume Oscillator analyses the relationship between trade volume and price changes in financial markets in order to provide insights into market trends and prospective trading opportunities.
The first stage entails computing two trading volume moving averages. The two most common moving averages are short-term and long-term. The long-term moving average indicates a longer time period, while the short-term moving average just includes recent volume data.
The Volume Oscillator calculates the variance between them after the two moving averages have been computed. This deviation reflects the divergence or convergence of volume over time. The VO shows a positive number, indicating increased volume when the short-term moving average is higher than the long-term moving average. The VO displays a negative number, indicating diminishing volume if the short-term moving average is lower than the long-term moving average.
Traders spot probable trend reversals or confirmations by contrasting volume variances with price changes. A trend reversal is imminent if the VO and price movements diverge. A waning bullish trend, for instance, is indicated by rising prices and falling volume (negative VO). A fading negative trend, on the other hand, is indicated if prices are declining and volume is rising (positive VO). Confirmation takes place and solidifies the current trend when the VO and prices move in the same direction.
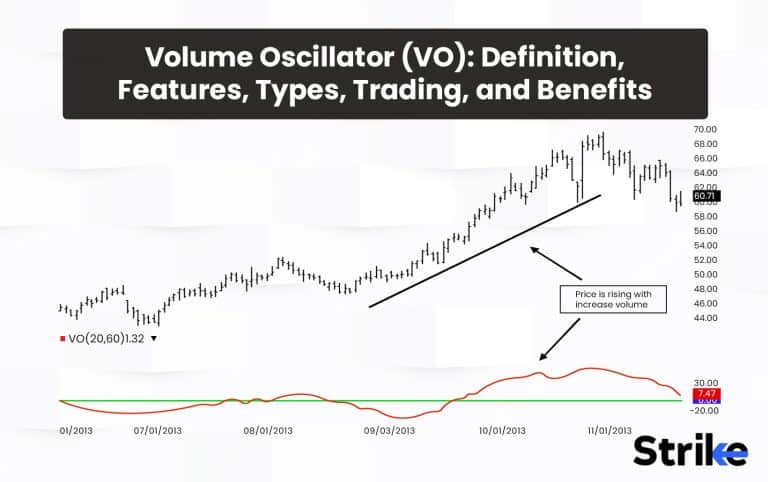
An example of how VO can work alongside the price of the script is attached below:
: Definition, Features, Types, Trading, and Benefits 36")
The Volume Oscillator (VO) is used for a variety of financial instruments and timeframes. Traders include it in their technical analysis to better comprehend market dynamics and supplement other indicators in their trading techniques.
How is the Volume Oscillator (VO) used in Technical Analysis?
The Volume Oscillator (VO) is a useful instrument in technical analysis since it sheds light on how trading volume and price changes are related to one another.
One of the Volume Oscillator’s main applications is spotting possible trend reversals. The VO and price movements diverging can indicate that the current trend is about to shift. The prices, for instance, are hitting higher highs but the VO is hitting lower highs, it is a sign that buying pressure is waning and a bullish trend is gaining traction, which will eventually result in a trend reversal.
Traders employ the Volume Oscillator to verify the strength of price changes. Volume growth during price trends verifies the strength of the trend. The prices, for instance, are rising and the VO is rising as well, this indicates that greater trade activity is supporting the upward price movement, giving the trend more conviction. An example of how a trader can deploy VO to take high probability trading setups.
The VO respects the price’s Higher Highs and also shows HH’s on the indicator. Further, during retracement of the price, VO managed to make a double bottom and gave Higher Lows while price continued to retrace sharply near the proper support level. Further, VO spiked above 0 indicating increasing buying pressure. The breakout occurred and this is how a trader could have used this information to take this high probability long setup.
: Definition, Features, Types, Trading, and Benefits 37")
A divergence between the VO and price might be a strong indicator in technical analysis. A positive reversal occurs if, for instance, prices are making lower lows while the VO is making higher lows, which suggests that selling pressure could be easing. An example of how bearish divergence can be spotted between price and VO indicator and how this information could have solidified a trading plan supposed to be taking short setup. Later on, a break below 0 level on indicator could have been used as a signal of continuation of selling pressure and a retracement towards 0 signaling a short trade setup.
: Definition, Features, Types, Trading, and Benefits 38")
The Volume Oscillator assists in determining when the market is overbought or oversold. It is overbought or oversold in the market, which causes a price reversal when the VO hits extreme levels.
The Volume Oscillator improves the precision of trading signals by supporting other technical indicators. It is frequently used in conjunction with moving averages, trend lines, and other oscillators by traders to confirm trading judgements.
Traders use the Volume Oscillator to determine whether the related volume validates the formation of a technical pattern on a price chart, such as a breakout or reversal pattern.
What are the key features of a Volume Oscillator (VO)?
The Volume Oscillator is a popular technical analysis tool that provides insightful information about market sentiment. The Volume Oscillator’s five main characteristics are Listed and discussed in detail below.
Calculates momentum
The VO gauges momentum by comparing volume flow over short and long lookback periods.
Identifies divergence
It highlights divergence between price and volume flow to signal potential reversals.
Oscillates around zero
The VO oscillates above and below a zero centerline providing clear overbought and oversold signals.
Easy to interpret
Crossovers of the zero line, peaks, troughs and divergences provide high probability trading signals.
Customizable parameters
Users tweak the short and long period settings based on their trading style and timeframe, adding flexibility.
The Volume Oscillator is a valuable momentum indicator for traders when used prudently. But like any indicator, it should be combined with other signals and analysis to confirm trading decisions. Understanding both the strengths and limitations of the VO is key to utilizing it effectively in one’s trading process.
How is the Volume Oscillator (VO) measured?
The Volume Oscillator (VO) is measured by calculating the difference between two moving averages of the trading volume. The four steps involved in the calculation of the Volume Oscillator are listed below.
- You must choose two moving averages to measure the Volume Oscillator. The two most common moving averages are short-term and long-term. The long-term moving average indicates a longer time period, while the short-term moving average just includes recent volume data.
- Determine the two moving averages of the trading volume based on the selected time periods. Calculate the average volume over the past 10 days and the average volume over the past 30 days, for instance, if you chose a 10-day moving average for the short term and a 30-day moving average for the long term.
- Find the difference between the short-term and long-term moving averages after calculating the moving averages. The variation in volume from the average volume throughout the selected periods is represented by this difference.
- Plot the volume deviation with positive values on the chart above the centerline (often denoted by zero) and negative values below the centerline. The VO will bounce above and below the centerline as the volume varies in relation to the moving averages.
What are the best Types of Volume Oscillators (VO)?
The best types of Volume Oscillators (VO) are those that provide accurate and reliable insights into market trends and trading opportunities. Here are the five widely used and effective types of Volume Oscillators.
CMF (Chaikin Money Flow)
A volume-based indicator that incorporates price and volume data is the Chaikin Money Flow; it is also referred to as the Chaikin Oscillator. It determines whether assets are accumulating or being distributed by computing the difference between two moving averages of the Accumulation Distribution Line (ADL). The Chaikin Money Flow helps traders measure the strength of trends and potential trend reversals by offering insights about buying and selling pressure in the market.
Volume Weighted Average Price (VWAP):
A benchmark price called VWAP is determined by accounting for both price and trading volume. It displays the typical price at which an asset has traded over a given time period, weighted by the volume at each price level. VWAP is frequently used by intraday traders to get additional confirmation about a trading setup. It is widely used on lower time frames and even algorithms are constructed using VWAP.
On-Balance-Volume (OBV):
A volume-based indicator called the On-Balance-Volume aids traders in evaluating the cumulative volume flows in relation to price fluctuations. It reflects the net volume flow into or out of an asset based on the movement of the price. Volume is added to the OBV when prices close higher and subtracted when prices close lower. The OBV sheds light on probable trend divergences or confirmations.
Klinger Oscillator:
The Klinger Oscillator combines volume’s direction and force to measure market momentum and trend strength. It is determined by subtracting the volume’s two exponential moving averages. The Klinger Oscillator aids traders in spotting shifts in buying or selling pressure, which can point to potential trend confirmations or reversals.
Accumulation/Distribution Line (ADL):
A volume-based indicator called the accumulation/distribution line depicts the flow of capital into or out of an asset based on both the closing price and trading volume. The volume is added to the ADL when prices close higher than expected, and when prices close lower than expected, the volume is subtracted from the ADL. The ADL provides information on possible trend strengths or weaknesses by assisting traders in analyzing the money movement into and out of an asset.
How to use the Volume Oscillator (VO) in Trading?
The Volume Oscillator plays a crucial role in technical analysis while trading, and hence it should be used efficiently to maximize effective decisions. The below-mentioned eight procedures should be followed to efficiently use the Volume Oscillator (VO) in trading.
Look out for any divergence in the volume and price changes in the Volume Oscillator. The Volume Oscillator indicates an upcoming trend reversal when it displays a direction that differs from the price trend. A possible bearish reversal and waning buying interest are indicated if prices are increasing but the VO is decreasing.
Confirm price patterns using the VO. Volume growth during price uptrends- or downtrends contributes to the trend’s strength. A bullish trend is strengthened by rising VO and rising prices, whereas a bearish trend is confirmed by decreasing VO and declining prices.
Watch for extremely high or low VO levels (typically zero) above or below the midline. Low negative numbers signify oversold conditions, while high positive values indicate overbought circumstances. These abysmal levels are a hint of impending price reversals.
Combine it with other technical indicators like trendlines or moving averages to increase the VO’s potency. The reliability of trading decisions is increased when indications from numerous indicators are confirmed.
Keep an eye out for large volume spikes, which indicate important market developments or potential price breakouts. A comparable increase in volume in the VO may signal the start of a new trend or the continuation of an already established one.
Track the evolution of the VO’s divergence over time. The divergence that doesn’t change could make the case for a potential trend reversal stronger. Look for numerous occurrences of divergence across a number of periods to boost your confidence in the signal.
Make sure VO and Trading Time Frame Align. Longer-term investors favour a longer period VO whereas short-term traders select a shorter period VO. The timing must match for a more precise trend analysis.
Risk management is crucial for any trading plan. Use stop-loss orders to reduce potential losses, and be sure to size your positions appropriately based on your risk tolerance.
You can learn a lot about market dynamics, trend strength, and potential reversals by including the Volume Oscillator in your trading research. Use the VO along with other technical and fundamental analysis tools to make informed trading decisions, keeping in mind that no indicator is infallible.
What trading strategies are best in conjunction with Volume Oscillator (VO)?
VO works best when used in conjunction with trading strategies like divergence trading. Below is a complete list of such strategies.
1. Divergence Trading:
Finding differences between the price movement of an asset and the indications provided by an indicator like the Volume Oscillator (VO) is the basis of the divergence trading method. The two types of divergences are: bullish divergence, which occurs when the price makes lower lows while the VO makes higher lows or price makes higher highs and VO makes lower highs, and bearish divergence, which occurs when the price makes lower highs and VO makes higher highs.
: Definition, Features, Types, Trading, and Benefits 39")
: Definition, Features, Types, Trading, and Benefits 40")
Using the Volume Oscillator to trade divergences can be profitable, especially when paired with different time frame analysis, price action and other technical indicators or candlestick patterns. Before deciding to trade based only on divergence indications, traders must exercise caution and take other aspects into account.
2. Trend Confirmation:
Trend confirmation includes confirming the strength of price trends using the Volume Oscillator. It validates the strength of the trend and gives traders more confidence in their positions when volume rises during price uptrends or downtrends.
Traders use the VO to determine if increased trading activity supports rising or decreasing prices. A bullish trend, showing significant buying interest, is confirmed by growing VO along with rising prices. A bearish trend and selling pressure, on the other hand, are confirmed by dropping VO and falling prices. An example is attached below. When VO suggests trend confirmation of existing trend followed by multiple information like higher lows on VO from the extreme point suggesting increase in volume activity in parallel to existing trend that is bullish. This is how the indicator helps in confirming a trend and high probability trade setups can be identified.
: Definition, Features, Types, Trading, and Benefits 41")
3. Breakout Trading:
Breakout trading is the act of taking a position when the price of an asset crosses over or under a barrier or support level. It seeks to catch substantial price movements that occur after such breakout moments.
The Volume Oscillator (VO) is used by traders to confirm breakout trades by watching for volume expansion during the breakout. The potential power of a breakout is validated by a spike in volume during a breakout, which shows traders’ significant engagement and conviction.
: Definition, Features, Types, Trading, and Benefits 42")
The Volume Oscillator helps improve breakout trading techniques by confirming the breakout’s momentum. A breakthrough that is followed by a large increase in volume is regarded as more dependable, raising the likelihood of a profitable transaction.
4. Volume Spike Trading:
Trading volume spikes are the process of profiting from abrupt and massive jumps in trading volume. Increases in volume frequently follow important market developments, news items, or abrupt changes in attitude.
The Volume Oscillator is used by traders to spot volume spikes, which are indicated by wildly high VO readings. A sharp change in the market’s dynamics are signaled by an abrupt increase in volume, which provides trading opportunities.
Using the Volume Oscillator in conjunction with other indicators or chart patterns can make volume spike trading profitable. Traders, however, should proceed with caution and take other aspects into account before making trading decisions based on only volume spikes. Volume spikes can offer useful information regarding market sentiment and probable price moves.
When used in conjunction with different trading methods, the Volume Oscillator may be a potent instrument. It is crucial to combine them with different time frame analysis, price action, candlestick patterns and other technical indicators, price patterns, and fundamental analysis to improve the overall effectiveness of trading decisions.
What are the Benefits of the Volume Oscillator (VO)?
In their market analysis and trading decisions, traders and investors might benefit from the Volume Oscillator (VO). The following are some of the main advantages of using the Volume Oscillator.
- Volume Confirmation:The VO aids in the confirmation of price movements by examining the correlation between trade volume and price developments. The strength and dependability of a trend are confirmed when volume rises during price uptrends or downtrends.
- Spotting Divergence: The VO is useful for spotting divergence in price and volume fluctuations. Divergence can provide traders with early warning signs for prospective changes in market direction by indicating potential trend reversals or trend continuance.
- Trend Reversal Signals: Traders can foresee future trend reversals by keeping an eye out for divergences in the VO. It could portend a forthcoming shift in the market mood when the VO deviates from the current price trend.
- Overbought and Oversold Conditions: The VO can assist in determining when the market is overbought or oversold. Extreme VO readings that are both above and below the midline signs of impending market corrections or reversals.
- Confirmation of Breakouts: The VO can confirm the reliability of price breakouts when combined with breakout trading tactics. Increased volume during a breakout strengthens the move’s conviction and raises the likelihood of a profitable transaction.
- Enhanced Technical Study: The VO gives traders a thorough study of market dynamics by combining it with other technical tools and indicators. It can improve the precision of trading signals when used in conjunction with other indicators, such as trend lines or moving averages.
- Determining Volume Spikes: The VO can assist traders in determining volume spikes, which are rapid and significant surges in trading volume. Significant market events or news releases frequently coincide with volume surges, which offer vital clues about the mood of the market and probable price moves.
- Flexibility: The Volume Oscillator is adaptable to a range of financial instruments and timeframes, making it appropriate for diverse trading strategies and time horizons for investments.
- Risk management: Traders can determine the level of market activity and evaluate the liquidity of an asset by examining volume trends. Risk management and position sizing can both benefit from knowing this information.
The Volume Oscillator is a useful indicator that provides information on market mood, trend strength, and probable reversals. It could be an important addition to a trader’s toolkit, assisting them in making better trading decisions and increasing their overall success.
What are the Limitations of Volume Oscillator (VO)?
Traders and investors find the Volume Oscillator (VO) to be a helpful instrument, but there are certain drawbacks they should be aware of.
- Volume Data Reliability: The quality of the volume data used affects the VO’s accuracy and dependability. The accuracy, completeness, or manipulation of volume data in some markets or trading platforms have an impact on how well the VO’s signals work.
- Lagging Indicator: The VO is a lagging indicator, like many technical indicators. It does not provide real-time signals and miss some short-term market changes because it bases its calculations on historical volume data.
- Whipsaw Signals: The Volume Oscillator produces erroneous or whipsaw signals during times of low or unpredictable volume, which could result in incorrect trading decisions and possible losses.
- No Direct Price Information: The VO only takes volume data into account; price information is not included. Other indicators offer price-related cues that it does not pick up on, and as a result, it does not fully reflect market behavior.
- The VO is not a stand-alone indicator: It works best when combined with other technical indicators, chart patterns, and fundamental research. Making trading decisions simply based on the VO does not give you a complete picture of the market.
- Subjective Interpretation: Particularly for new traders, interpreting the Volume Oscillator’s signals can be subjective. Its readings are interpreted differently by different traders, resulting in various trading choices.
- Not Suitable for All Market Conditions: Depending on the market circumstances, the VO’s efficacy change. Its indications could not be as trustworthy in markets with low volume or high volatility, which would result in less precision in trading decisions.
- The VO Might Not Work Well on All Timeframes: The VO Not Work Well on All Timeframes. Lower periods produce noisy signals due to short-term volume swings, while longer timeframes do so but are not suited for scalpers or day traders.
- Complexity for New Traders: It is difficult for new traders to comprehend the various kinds of divergences, overbought/oversold conditions, and effective use of the VO.
- Market Mood and News Impact: The VO does not take into account external factors that affect trading activity, news events, or market mood. Significant news releases or abrupt shifts in attitude can have an impact on volume patterns and do not be fully represented in the VO.
The Volume Oscillator is still a useful tool when used wisely and in conjunction with other indicators and analysis techniques despite these drawbacks. Traders should be aware of their limitations and incorporate them into a thorough trading plan to make wise choices in the financial markets.
What common mistakes do Traders make when trading with the Volume Oscillator (VO)?
Traders, particularly those who are new to using the Volume Oscillator (VO), are prone to making a number of typical errors. Trading techniques are enhanced and potential pitfalls are avoided by being aware of these errors. Here are a few such errors:
- Over-Reliance on VO Signals: Using only VO signals without taking into account other technical indicators or market conditions is one of the most frequent blunders. The VO is just one tool in a trader’s arsenal, and for more reliable trading decisions, it should be utilized in concert with other analysis techniques.
- Ignoring Price Action: Traders only pay attention to the VO’s signals, omitting crucial chart patterns and price action patterns. Price action should be taken into account in addition to VO signals because it can reveal important information about market sentiment and probable price reversals.
- Ignoring Divergence Continuity: Over time, traders neglect to keep track of divergence continuity. Divergence is not always significant in a single event, but repeated occurrences across several periods can support the possibility of trend reversals.
- VO Isolation: Some traders employ the VO without taking into account the fundamental analysis, news, or the larger market situation. Trading volume is impacted by market sentiment and outside variables, therefore traders should consider these in their research.
- Ignoring major Volume Spikes: Traders could fail to pay enough attention to major volume spikes, which are essential for comprehending market dynamics and spotting prospective chances.
- Poor Time Frame Selection: Traders could employ the VO on the wrong timeframes. Using the VO on the incorrect time frame could result in poor trading decisions because different timeframes can generate different signals.
- Ignoring the Reliability and Quality of Volume Data: Traders do not check the accuracy and dependability of the volume data utilized for the VO. Signals can become unreliable as a result of inaccurate or modified volume data.
- Chasing Whipsaw Signals: The VO provides whipsaw signals when there is low volume or inconsistent market activity. These erroneous indications cause traders to place transactions, which could result in losses.
- Inadequate Risk Management: When trading with the VO, traders do not use the right risk management strategies. To safeguard capital, risk must be managed using stop-loss orders and position sizing.
- Ignoring Market Sentiment: Traders simply pay attention to the VO’s readings, omitting the larger market sentiment. For determining the general market direction, it is essential to comprehend the market mood.
Trading strategies should use the Volume Oscillator to help traders avoid these common blunders. Other technical indicators, price action analysis, fundamental research, and market background can all be incorporated in this way. Traders can improve their overall trading performance and make more informed trading decisions by using a variety of tools and approaches.
Is Volume Oscillator (VO) reliable?
Volume Oscillator works well on higher time frames like daily, weekly and monthly. One can take signals from daily or weekly charts and diving in a lower time frame can assist traders in gathering confluences. Further, confirmations from price action, candlestick patterns and indicators can thereby increase trader’s perception of the market to take high probability trading setups. As a momentum oscillator, the volume oscillator aids traders and investors in spotting probable trend reversals and validating the strength of price movements based on volume data.
Is the Volume Oscillator (VO) accurate?
No indicator is really accurate so traders measure in terms of precision. Yes, Volume Oscillator is precise but must be used alongside other indicators and tools. Different time frame analysis and price action study can further solidify a trade setup that is confirmed by volume oscillator.
What is the difference between Volume Oscillators and Moving Averages?
Moving averages and the Volume Oscillator are both technical analysis tools that traders and investors use to understand market trends and momentum, but their computations and goals are different.
1. Volume Oscillator (VO):
The Volume Oscillator, commonly referred to as the Volume Oscillator Indicator (VOI), is a momentum oscillator that concentrates on evaluating volume data as opposed to price data. It aids traders in comprehending how volume and price changes are related. The VO calculates the difference between two volume moving averages and displays this difference as a line or a histogram on a secondary chart that is displayed beneath the main price chart.
Filtering away short-term volume fluctuations and presenting a clearer picture of volume trends are the main goals of the Volume Oscillator. It can validate the strength of price movements when volume grows during uptrends or downtrends, and it can indicate probable trend reversals when volume diverges from price action.
2. Moving Averages:
The trend-following indicator, moving averages (MAs), examines price data over a predetermined amount of time. They eliminate price peaks and valleys and produce a solitary, continuous line that represents the average price for the chosen time period on the price chart. Simple Moving Averages (SMA) and Exponential Moving Averages (EMA) are the two primary types of moving averages.
Moving averages aid traders in spotting market trends as well as potential support and resistance levels. The price signals an uptrend or downturn depending on whether it is above or below the moving average. Crossovers between moving averages, such as when a short-term MA crosses above or below a long-term MA, can indicate changes in trend.
The main distinction between the Volume Oscillator and Moving Averages is how they are calculated and what they are used for. Moving Averages examine price data to spot patterns and potential turning points, while the Volume Oscillator examines volume data to comprehend volume trends and their link with price. Both tools have distinct functions and are combined to create a thorough technical analysis plan.


 Previous Article


![15 Investing.com Alternatives [Free+Paid] You Should Use in 2026](https://www.strike.money/wp-content/uploads/2026/04/Investing.com-Alternatives.jpg "15 Investing.com Alternatives [Free+Paid] You Should Use in 2026 46")
![15 TradeStation Alternatives [Free+Paid] You Should Use in 2026](https://www.strike.money/wp-content/uploads/2026/04/TradeStation-Alternatives.jpg "15 TradeStation Alternatives [Free+Paid] You Should Use in 2026 47")
![15 Chartink Alternatives [Free+Paid] You Should Use in 2026](https://www.strike.money/wp-content/uploads/2026/04/Chartlink-Alternatives.jpg "15 Chartink Alternatives [Free+Paid] You Should Use in 2026 48")
: Overview, 10 Types of Indicators, Settings for Different Markets 50")

 : Definition, Formula, calculation, Uses, Advantages Vs limitations 52")


: How We Used This 70/30 Indicator in 6 High Win-rate Strategies 56")


No Comments Yet.